Mastering Test Reporting in Software Testing

When you hear “test reporting,” what comes to mind? For many, it’s a simple pass/fail summary. But that’s like looking at a car’s dashboard and only seeing if the engine is on or off, completely ignoring the speedometer, fuel gauge, and all the warning lights.
Test reporting is the process of gathering up all the raw data from your testing efforts and transforming it into something everyone can actually use. It’s about turning a mountain of raw test results into actionable insights that tell the real story of your software’s quality, flag potential risks, and help guide the entire project.
Why Test Reporting Is More Than Just Pass or Fail

In any software project, testing generates a massive amount of data. Every single test run, every bug found, and every feature validated adds to the pile. Without a smart way to sort through it, all that information is just noise. This is where test reporting in software testing steps in, acting as a critical communication tool that cuts through the static.
Think of a good test report not as a report card, but as a diagnostic chart for your software’s health. A doctor doesn’t just give you a thumbs-up or thumbs-down. They give you specifics: blood pressure, cholesterol levels, and other vital signs. A great test report does the exact same thing for your application.
Translating Data into Decisions
The real magic of a test report is its ability to translate complex, technical data into a format that different people—from developers to project managers to VPs—can easily grasp and act on. It’s about telling a compelling story with data, one that answers the big questions about where the project stands.
A solid report empowers teams by:
- Providing Visibility: It offers a clear window into the entire QA process, showing exactly what’s been tested, what worked, what broke, and what’s still left to do.
- Identifying Risks: By spotlighting critical bugs, consistent test failures, and areas with shoddy test coverage, reports help teams see trouble on the horizon before it affects users.
- Guiding Priorities: When a developer sees a detailed breakdown of high-severity bugs, they know precisely where to focus their energy for the biggest impact.
- Informing Stakeholders: High-level summaries give business leaders the information they need to make crucial go/no-go decisions for a release.
A test report is the bridge between the QA team’s technical findings and the project team’s strategic decisions. It ensures everyone is working from the same set of facts, fostering alignment and a shared understanding of quality.
The Growing Importance of Effective Reporting
The need for clear, insightful test reporting has never been more critical. Development cycles are getting faster, applications are becoming more complex, and teams need reliable data to move quickly without breaking things.
The market reflects this trend. The global software testing market was valued at over USD 54.68 billion in 2025 and is expected to rocket past USD 99.79 billion by 2035. This boom is driven by businesses going digital and shifting to the cloud, both of which demand smarter, more scalable testing solutions. You can explore the software testing market growth insights to see the full picture.
Ultimately, test reporting isn’t just a box to check at the end of a sprint. It’s a continuous feedback loop that drives improvement, reduces guesswork, and helps teams ship a product that actually meets user expectations. It turns testing from a simple verification task into a strategic asset that delivers real business value.
The Anatomy of a High-Impact Test Report
A mediocre test report is a data dump—a long list of passed tests, failed tests, and bug IDs. It’s noise. A high-impact report, on the other hand, is a strategic document. It doesn’t just present data; it tells a story about your software’s quality and guides everyone toward smart decisions.
To build one that actually gets read, you have to think beyond simple checklists. Think of it like a blueprint. Every section has a purpose and builds on the last, giving a complete picture of the project’s health.
Crafting a Compelling Executive Summary
This is the first thing people see, and for busy stakeholders, it might be the only thing they read. The Executive Summary isn’t just an introduction; it’s the entire report distilled into a few powerful sentences. It has to deliver the bottom line, fast.
Your summary needs to answer three questions immediately:
- What’s the overall quality status? Are we on track for release, or are there major roadblocks?
- What are the biggest risks? Point out any critical issues that could blow up the timeline or frustrate users.
- What should we do next? Should we focus on fixing bugs, or is the build stable enough to move forward?
A sharp, direct summary ensures your key message lands. Anything less just creates confusion.
Detailing Test Execution and Scope
Right after the summary, you need to provide context. The Test Execution Scope section is all about transparency—it shows exactly what was tested and what wasn’t. This is where you manage expectations.
Be specific. Include details like:
- The build or version number of the application.
- The environments where tests were run (e.g., specific browsers, operating systems).
- A clear count of total tests planned, executed, passed, and failed.
This grounds your report in facts. Saying 95% of tests passed is meaningless without knowing if that’s 95 out of 100 or 950 out of 1000. Context is everything.
A great test report preemptively answers the questions your audience will ask. By clearly defining the scope, you build credibility and ensure everyone is interpreting the results from the same starting point.
Transforming Defect Lists into Actionable Insights
This is where most reports fall flat. A simple list of bug IDs is just noise. An insightful Defect Analysis section, however, groups and categorizes defects to reveal patterns and guide the team on where to focus.
Instead of just listing bugs, a powerful analysis does three things:
- Categorizes by Severity and Priority: It groups bugs from critical showstoppers down to minor cosmetic issues. This immediately tells developers what to fix first.
- Identifies Defect Clusters: Are most of the critical bugs popping up in a single new feature? Highlighting these “hotspots” can expose deeper architectural problems.
- Analyzes Trends Over Time: Is the number of new critical defects growing as you get closer to release? That trend line is a massive red flag for stability.
This approach turns a raw list of bugs into a diagnostic tool. It shifts the conversation from “Here’s what’s broken” to “Here’s where we’re broken and why.” This analytical depth is what separates a report that gets filed away from one that drives real action.
Tracking QA Metrics That Actually Matter
Data without context is just noise. An effective test report cuts through that noise, focusing on the handful of key performance indicators (KPIs) that truly reveal the health of your software. Instead of just throwing numbers at a wall, organizing metrics into logical categories helps you tell a clear, compelling story about quality.
This structured approach lets stakeholders instantly grasp different aspects of the project. Think of it like a branching tree, where a high-level summary splits into distinct areas like defects, execution status, and test coverage.
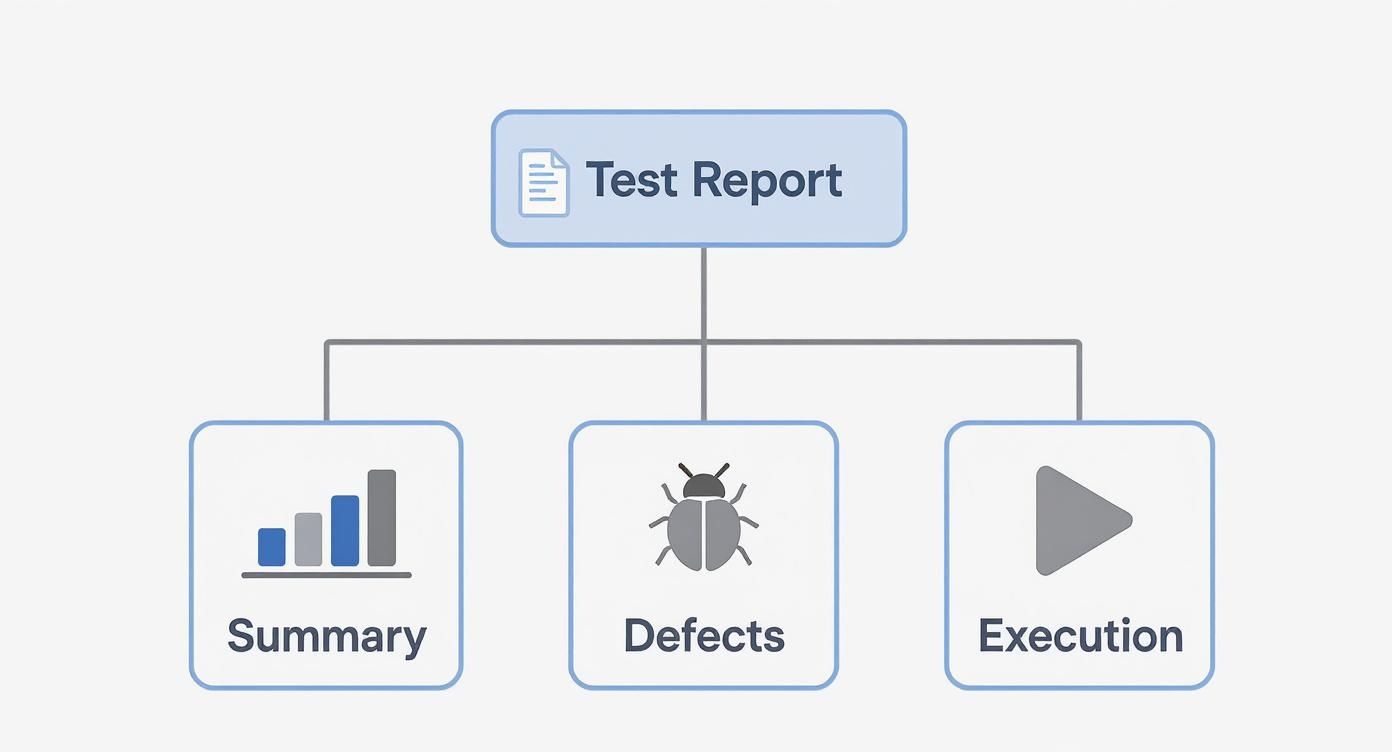
Each branch is a vital part of the quality narrative, allowing everyone from developers to product managers to drill down into the data that matters most to their role.
Test Execution Metrics
First up, test execution metrics give you a real-time snapshot of the testing process itself. They answer the big questions: How much have we done? How much is left? Are we on track?
A few essential metrics in this category include:
- Test Pass Rate: The percentage of tests that passed out of all tests run. A consistently low pass rate—say, below 80%—is often a major red flag signaling an unstable build.
- Tests Executed vs. Planned: This is a straightforward progress tracker. If you’re consistently falling behind schedule here, it could point to resource shortages or unforeseen roadblocks.
- Blocked Tests: The number of tests you couldn’t run because of a critical bug or an unavailable dependency. A high number of blocked tests can bring your entire QA effort to a screeching halt.
Think of these metrics as the heartbeat of your testing cycle. They give you an immediate sense of your team’s velocity and the stability of the application you’re testing.
Defect Analysis Metrics
While execution metrics focus on the process, defect metrics get to the heart of your product’s quality. They go way beyond a simple bug count to analyze the severity, density, and real-world impact of the issues you’re finding. These are your diagnostic tools.
Tracking key defect metrics allows you to pinpoint “bug hotspots” in your application. Over time, you can refine your testing strategy to catch more critical issues before they ever see the light of day. For a deeper look, check out our guide on the essential metrics for software testing every team should be tracking.
The table below breaks down the most critical metrics that transform a simple bug list into a strategic tool for improving software quality.
Essential QA Metrics for Comprehensive Test Reporting
| Metric | What It Measures | Why It Is Important |
|---|---|---|
| Defect Density | The number of confirmed defects per unit of code (e.g., per 1,000 lines). | A rising density in a specific module is a strong indicator of poor code quality or underlying architectural problems. |
| Defect Severity Index | A weighted score that prioritizes critical and major bugs over minor ones. | It helps focus your team’s limited resources on fixing the issues that have the biggest impact on users. |
| Defect Leakage | The percentage of defects missed by QA and found by users in production. | A high leakage rate (often over 5%) signals serious gaps in your testing process or coverage. |
By analyzing these trends, you shift from simply finding bugs to understanding their root causes. This is how you move from a reactive to a proactive approach, preventing future issues and dramatically cutting down on rework.
Requirements and Coverage Metrics
The final piece of the puzzle is confirming you’re actually testing the right things. Coverage metrics are all about connecting your testing efforts back to the business requirements, ensuring every feature has been properly validated.
These metrics answer the most important question of all: “Did we build what the user actually asked for?”
Here are the most valuable ones to track:
- Requirements Coverage: What percentage of business requirements have test cases written for them? If this number is low, you have massive blind spots where features are shipping completely un-validated.
- Test Coverage: This goes a step deeper, measuring how much of your actual codebase is executed by your automated tests. Tools can measure this by statement, branch, or function to find untested code paths.
- Requirements Volatility: This tracks how often requirements change during a development cycle. High volatility isn’t just a nuisance; it can derail testing schedules and points to a need for better planning upfront.
Together, these three categories give you a balanced, comprehensive view of software quality. They stop teams from chasing vanity metrics—like a huge number of tests executed—that look impressive on paper but mean nothing for the end-user experience. When you track what truly matters, your test reports become an indispensable tool for shipping great software.
Choosing the Right Report for the Right Audience
Handing a 50-page, deeply technical report to a C-suite executive is a bit like giving a chemical analysis to a chef. The data is correct, but it’s completely useless for what they need to do. When it comes to effective test reporting in software testing, the goal isn’t to create one perfect document—it’s to craft the right one for the right audience.
A one-size-fits-all approach is a surefire way to get your hard work ignored. The real secret is understanding that different stakeholders are trying to answer different questions. A developer needs the nitty-gritty details to squash a bug, while a project manager needs a bird’s-eye view to gauge risks and timelines. If you tailor your report, you make sure the message actually lands and drives action.
Daily Summaries for Development Teams
For the developers and QA engineers in the trenches, information has to be immediate and actionable. They don’t have time for polished presentations; they need a quick, clear signal on the health of the latest build. This is where a daily summary report shines.
Think of this report as lean and mean. It’s often automated and piped directly into the team’s chat channel. Its whole purpose is to answer a single question: “Is this build stable enough for us to keep working?”
A good daily summary includes just the essentials:
- Build Version and Environment: So everyone knows exactly what was tested.
- Critical Test Failures: A short, prioritized list of new, show-stopping bugs.
- Blocked Tests: Anything getting in the way of further testing.
- Pass/Fail Count: A quick snapshot of the overall test run.
This keeps the feedback loop incredibly tight. Developers can jump on critical issues in hours, not days.
Weekly Milestone Reports for Project Managers
Project managers operate at a higher altitude. They aren’t worried about a specific line of code; they’re focused on schedules, risks, and the overall trajectory of the project. A weekly milestone report gives them the perspective they need to steer the ship.
This report zooms out from the daily chaos to reveal trends and track progress against the current sprint or release goals. It’s all about connecting testing activities to the project’s key milestones.
A project manager’s report should translate test data into business impact. Instead of listing bugs, it should answer questions like, “Are we on track to meet our release date?” or “Does this new feature meet quality standards for user acceptance testing?”
An effective weekly report synthesizes data to highlight:
- Progress Against Test Plan: A simple percentage of planned tests that are complete.
- Defect Trends: Charts showing whether critical bugs are piling up or getting resolved.
- Risk Assessment: Pinpoints features with high bug counts that could derail the timeline.
- Requirements Coverage: Confirms that the most important business requirements have been successfully tested.
This is the kind of reporting that lets project managers make smart decisions, move resources to where they’re needed most, and give clear status updates to everyone else.
End-of-Cycle Analysis for Leadership
When a major release is on the line, executives and business leaders need the final word. They are the ones making the ultimate go/no-go call, and their world revolves around business risk, not technical debt. The end-of-cycle analysis is the comprehensive, high-level summary built just for them.
This report isn’t about individual test cases; it’s about the holistic quality of the product. It’s the final verdict on whether the software is ready for prime time.
It needs to deliver a clear, concise recommendation backed by solid evidence:
- Executive Summary: A single paragraph on release readiness, highlighting the final pass rate and any lingering critical risks.
- Risk Overview: A non-technical breakdown of any known issues that could impact customers, along with plans to handle them.
- Quality Metrics Summary: High-level numbers like final Defect Density or Defect Leakage from past cycles to give them context.
- QA Team Recommendation: A clear “go” or “no-go” from the team, based on all the data.
By tailoring test reporting in software testing to each audience, you turn a simple status update into a powerful decision-making tool. It guarantees your data isn’t just seen—it’s understood, valued, and acted on by every person involved.
Automating Your Reports for Real-Time Insights

Manual report generation is a relic. In a world of continuous integration and delivery, teams simply can’t afford to wait days—or even hours—for a compiled summary of test results. That delay creates a dangerous information gap where critical bugs can fester and unstable builds grind development to a halt.
To keep pace, test reporting in software testing has to be dynamic, immediate, and woven right into the development workflow. This is where automation comes in. By plugging your testing tools directly into your CI/CD pipeline, you transform reporting from a chore into a continuous, real-time feedback loop.
Designing Reports for Instant Clarity
Before you automate anything, the report itself needs to be designed for a five-second scan. An automated report that’s just a data dump is still noise, it’s just delivered faster. The goal is to present information so clearly that anyone—from a developer to a product manager—can grasp the key takeaways instantly.
A few core design principles make all the difference:
- Lead with the Bottom Line: Put the most critical metrics right at the top. Think overall pass/fail rates and new critical defects, displayed in a way that’s impossible to miss.
- Use Strong Visualizations: A simple bar chart or trend line is worth a thousand rows in a spreadsheet. A graph showing a rising defect trend is instantly more alarming than a table of raw numbers.
- Emphasize Conciseness: Be ruthless. Cut any data that doesn’t drive an immediate decision. Every single element on the dashboard should have a clear purpose.
Get this right, and when a report is automatically generated, its message is unmistakable.
Integrating Reporting into Your CI/CD Pipeline
The real magic happens when reports are generated and distributed automatically with every single code change. By integrating your reporting tools into your Continuous Integration/Continuous Delivery (CI/CD) pipeline, you make quality feedback an unavoidable part of the development process.
This integration usually follows a few key steps:
- Trigger on Build: Configure your CI server (like Jenkins, GitLab CI, or GitHub Actions) to kick off your automated test suite every time a developer commits new code.
- Execute and Collect: As the tests run, the framework gathers all the crucial data—passes, failures, performance timings, and code coverage.
- Generate and Publish: Once the test run finishes, a post-build action tells your reporting tool to chew on the raw data and spit out a visual report or dashboard.
- Distribute Instantly: The final report is automatically pushed to a shared dashboard, pinged into a team chat channel like Slack, or emailed to key stakeholders.
This creates a tight loop where a developer gets feedback on their code’s quality within minutes of pushing it.
By embedding reporting directly into the CI/CD pipeline, you shift quality assurance from a separate, downstream phase into an integral, real-time component of development itself. It democratizes quality data, making it everyone’s responsibility.
The Rise of Interactive Dashboards
Static, one-off reports are quickly being replaced by live, interactive dashboards. These tools allow stakeholders to move beyond passively consuming data and start actively exploring it themselves. A great dashboard empowers users to drill down from a high-level summary right into the specific test cases, logs, and even the exact code commits related to a failure.
This self-service model is a massive efficiency win. A product manager can filter the view to see the status of just their features, while a developer can investigate a specific failure without having to tap a QA engineer on the shoulder. This doesn’t just save the QA team countless hours answering questions; it builds a culture of shared ownership over quality.
The move toward automation has completely reshaped test reporting in software testing. By 2025, around 44% of IT companies had already integrated automation into at least half of their testing. This trend is only getting stronger with AI, which makes automated, real-time insights more accessible than ever. You can learn more about how automation is shaping modern QA practices. By automating your reports, you build a transparent, data-driven system that provides the instant feedback necessary to deliver high-quality software at speed.
How DevOps Transforms Modern Test Reporting
In the fast-paced world of DevOps, the old way of doing things just doesn’t cut it. Traditional, end-of-cycle reports are becoming obsolete—they’re simply too slow.
When you deploy code multiple times a day, waiting for a weekly summary is like getting yesterday’s news. DevOps thrives on a continuous feedback loop, which means test reporting in software testing must also be continuous.
Instead of static documents, teams now rely on dynamic, real-time quality dashboards that offer immediate insights with every single build. This shift ensures quality is no longer a final gatekeeping step. It’s a shared responsibility woven into the entire development process from the very start.
Shifting Left for Instant Visibility
The “shift-left” principle is at the heart of DevOps, pushing testing activities much earlier in the development lifecycle. This is made possible by integrated tooling that gives the entire team—not just QA—instant visibility into the software’s health.
A developer can now see the impact of their code on quality just minutes after they commit it. This immediate feedback loop empowers teams to catch and fix issues faster, which is absolutely critical for maintaining velocity. You can learn more about how this all fits together in our guide on DevOps continuous testing.
In a DevOps culture, a test report isn’t a historical document. It’s a live pulse monitor for the application, alerting the team to the slightest irregularity the moment it happens.
This approach has seen widespread adoption. It’s estimated that by 2025, three in four technology teams will have embedded DevOps practices, using continuous testing to speed up release cycles and slash the number of bugs that escape into production.
This movement has fueled demand for real-time dashboards and codeless tools, allowing even product owners to track quality without needing deep technical knowledge. You can find more research on the growth of DevOps in software testing and its impact.
Frequently Asked Questions About Test Reporting
Even with the best strategy, practical questions always come up when you get down to the nitty-gritty of test reporting. Let’s tackle some of the most common ones that teams run into.
Think of this as your quick-reference guide for those “what about…” moments that pop up during implementation.
What Is the Single Most Important Metric to Track?
If I had to pick just one, it would be Defect Leakage. Hands down.
This metric tells you what percentage of bugs your QA team missed and real users found in production. It’s the ultimate report card on your testing effectiveness because it directly measures the impact on your customers. A high defect leakage rate is a clear signal that you have serious gaps in your test coverage or your entire approach.
While things like Test Pass Rate are useful for internal tracking, Defect Leakage tells you the story from the only perspective that truly matters: the user’s.
How Often Should Reports Be Generated in an Agile Workflow?
In any kind of agile or DevOps setup, reporting has to be continuous. The old model of a single, big report at the end of a sprint just doesn’t cut it anymore. Instead, you should be generating automated summaries with every single build.
Here’s how that might break down:
- For Development Teams: Reports should pop up daily, or even with every commit. The goal is instant feedback on build stability.
- For Project Managers: A weekly automated summary is usually perfect. It should highlight trends and track progress against the sprint’s goals.
- For Stakeholders: Stick to end-of-cycle or major milestone reports. They just need the high-level overview to make the big decisions.
The rule of thumb is simple: match your reporting frequency to the decision-making speed of your audience. Faster development cycles demand faster feedback loops, which is why real-time dashboards are almost always more valuable than a static document that’s outdated the moment you send it.
What Are the Best Tools for Automating Test Reporting?
The “best” tool really depends on what you’re already using, but a few stand out from the crowd. Most of the popular test automation frameworks like Selenium or Cypress have some reporting features baked in, or at least they integrate nicely with other tools.
If you’re looking to build those live, comprehensive dashboards we just talked about, tools like Grafana, Kibana (from the ELK Stack), and ReportPortal are fantastic choices. They plug right into your test runners and CI/CD pipeline to create interactive, shareable reports that give everyone instant visibility into your product’s quality.
Ready to transform your testing with real user traffic? With GoReplay, you can capture and replay production traffic to validate your application’s performance and stability before deployment. Stop guessing and start testing with data that matters. Discover how GoReplay can enhance your test reporting at https://goreplay.org.