A Guide to Test Metrics in Software Testing

Test metrics are the hard numbers that tell you the real story about your product’s health, your team’s efficiency, and whether you’re actually ready to ship. Think of them as the vital signs for your entire software development lifecycle. Without them, you’re just guessing.
Why Your Testing Strategy Needs a Compass
Are you just hunting for bugs, or are you actually engineering quality?
It’s a serious question. Without data, even the most dedicated testing efforts are a shot in the dark. Imagine a pilot trying to navigate a storm without an instrument panel—that’s what software testing feels like without clear metrics. You’re definitely moving, but you have no clue if you’re heading in the right direction.
Test metrics provide that essential compass. They guide your team away from constantly reacting to problems and toward a proactive, data-driven strategy. Instead of relying on gut feelings, you can use real numbers to answer the tough questions.
This infographic breaks down how test metrics fit into any solid quality assurance strategy.
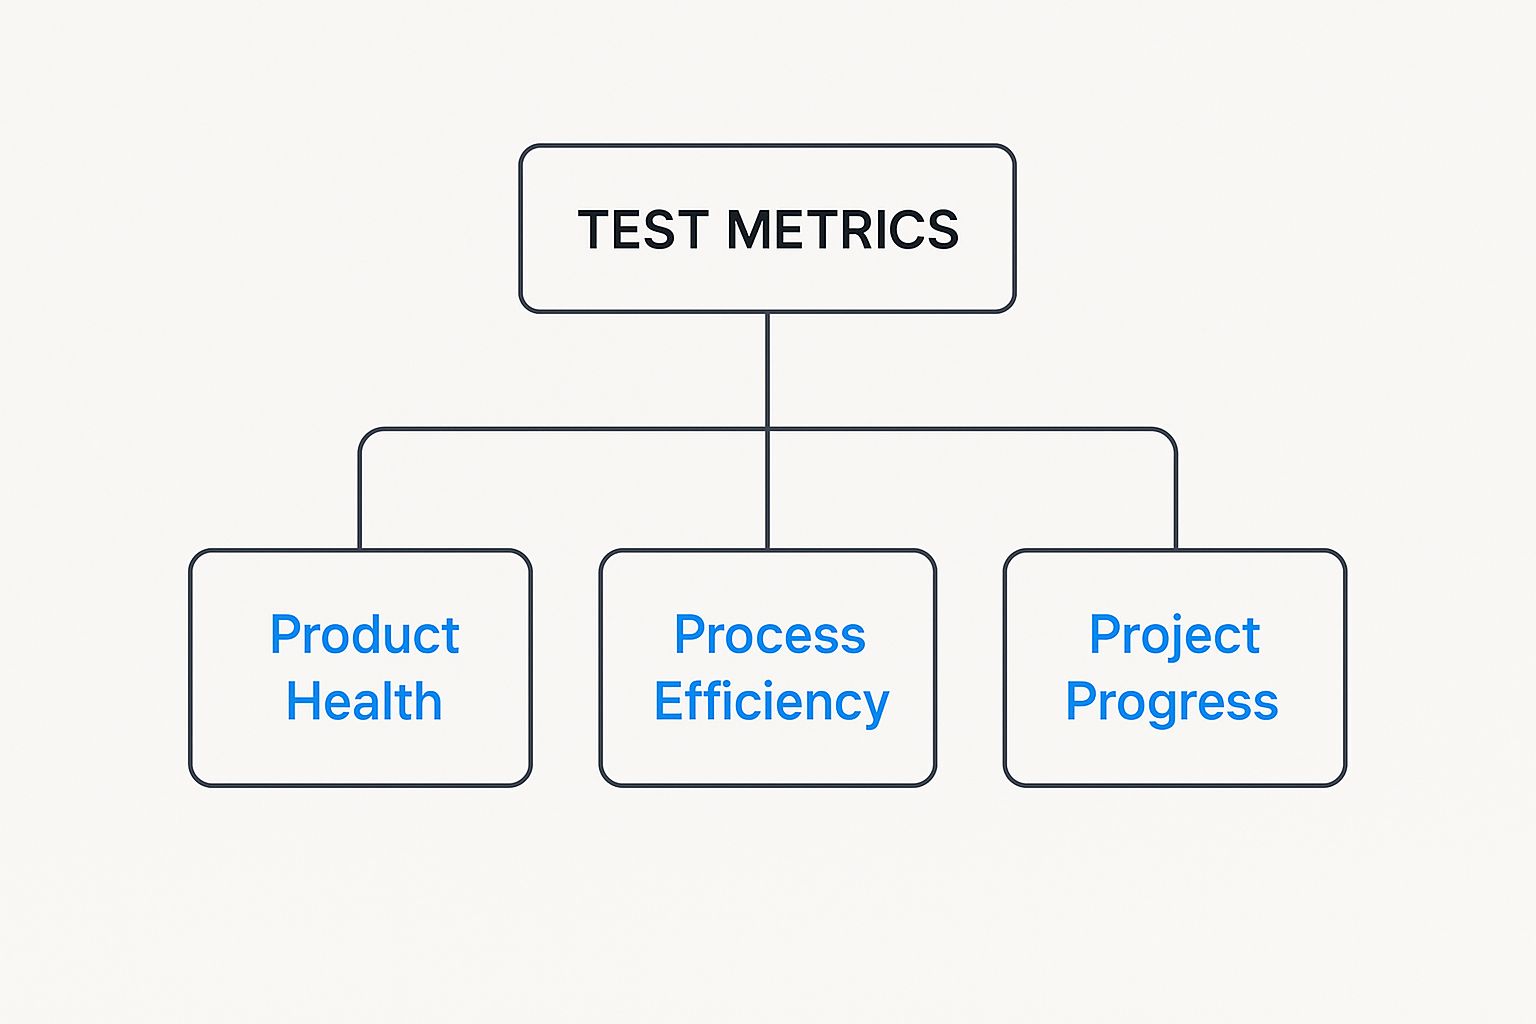
As you can see, the numbers give you a clear hierarchy of insights. They connect high-level project goals all the way down to the nitty-gritty health of the product and the effectiveness of your team’s process. It’s how you turn abstract goals into something you can actually measure.
The Power of Data-Driven Decisions
When you track the right test metrics, you suddenly gain the ability to spot patterns and predict what’s coming next. A sudden spike in defect density after shipping a new feature? That’s an immediate red flag that needs a closer look. Consistently low test coverage in a critical module? That’s a massive business risk hiding in plain sight.
By measuring and analyzing testing activities, teams can establish baselines, track progress, and make data-driven improvements. It’s about moving from “we think it’s ready” to “we know it’s ready.”
This simple shift empowers teams to:
- Pinpoint Bottlenecks: Find out exactly where your process is slowing down. Is it slow bug-fix times? Inefficient test case creation? The data will tell you.
- Demonstrate ROI: Justify spending on new tools, training, or people by showing a measurable improvement in quality or a drop in post-release defects.
- Enhance Predictability: Forecast release timelines based on real defect trends and test completion rates—not just optimistic guesses.
Software testing metrics are typically grouped into several key categories, each offering a different lens through which to view quality and efficiency.
Key Categories of Software Test Metrics
| Metric Category | What It Measures | Primary Goal |
|---|---|---|
| Product Quality Metrics | The overall health and stability of the software. | To determine if the product meets user expectations and quality standards. |
| Process Efficiency Metrics | The effectiveness and speed of the testing and development workflow. | To identify bottlenecks and optimize resource allocation for faster delivery. |
| Test Coverage Metrics | The extent to which the application’s code or features have been tested. | To ensure critical areas of the application are not left untested and reduce risk. |
| Defect Management Metrics | The patterns, severity, and resolution of bugs found during testing. | To understand defect trends, prioritize fixes, and improve code quality over time. |
Understanding these different categories helps teams build a balanced view of their project, ensuring they don't focus on one area (like bug counts) while ignoring another (like process speed).
Moving Beyond Simple Bug Counts
At the end of the day, a mature testing strategy doesn’t just count bugs; it measures the entire quality ecosystem. It’s not just about finding defects but understanding how, where, and why they happen in the first place.
This deeper insight is what allows teams to prevent future issues, put resources where they matter most, and build better software, faster. Using test metrics is the first step in turning your QA process from a simple safety net into a powerful engine for continuous improvement.
Measuring What Matters With Product Metrics
While process metrics help you fine-tune your team’s engine, product metrics tell you if the car is actually roadworthy. These are the numbers that paint a clear picture of your software’s health, stability, and overall quality from the end-user’s perspective.
Essentially, they shift the focus from how you’re testing to what your testing actually reveals about the product itself.
Think of it this way: your software is a newly constructed building. Product metrics are the inspector’s final report—they check for foundational cracks, faulty wiring, and structural integrity. They answer the most critical question of all: Is this product safe and ready for people to use?

This focus on the final output is exactly why product metrics resonate so strongly with stakeholders. They tie directly to customer satisfaction, brand reputation, and the bottom line, making them indispensable test metrics in software testing.
Defect Density: The Flaw Count Per Feature
Defect Density is one of the most direct and powerful product metrics out there. It measures the number of confirmed defects found in a component or the entire system relative to its size—often measured in lines of code. In simple terms, it tells you how “buggy” a piece of code is.
Imagine inspecting two rooms of the same size. One has two minor scuffs, and the other has ten. You instantly know which one has a quality problem. Defect density does the exact same thing for your codebase.
The formula is straightforward:
Defect Density = Total Number of Defects / Size of the Code (e.g., KLOC - Thousands of Lines of Code)
A consistently high defect density in a specific module is a huge red flag. It could point to overly complex code, weak unit testing, or even a developer who needs a bit more support. Tracking this metric helps you aim your refactoring and testing efforts exactly where they’ll make the biggest impact.
Mean Time Between Failures: Predicting Reliability
While defect density looks for flaws in the code, Mean Time Between Failures (MTBF) measures the product’s reliability in action. It calculates the average time your software runs successfully before a critical failure brings it down.
Think of it like a car’s reliability rating. A car with a high MTBF can go for thousands of miles without a major breakdown, giving you confidence on a long road trip. In the same way, software with a high MTBF can be trusted to run critical business operations without unexpected crashes.
Here’s how you calculate it:
MTBF = Total Operational Uptime / Number of Failures
A low MTBF means your users are hitting frequent disruptions, which leads to frustration and a loss of trust. For any application where stability is non-negotiable, like e-commerce platforms or financial systems, improving this number is paramount.
Defect Leakage: The Cost of Escaped Bugs
Defect Leakage, sometimes called the escape rate, is arguably one of the most critical business-facing product metrics. It calculates the percentage of bugs your QA process missed that were later discovered by users in the live production environment.
Every single bug that “leaks” into production is a direct hit to the user experience and your company’s reputation. It’s the ultimate report card on your quality assurance process.
The calculation is a stark reminder of what slipped through the cracks:
Defect Leakage (%) = (Defects Found by Users / Total Defects Found) x 100
A high leakage rate is a clear signal that your testing strategy might not line up with real-world user behavior, or that your test coverage has some serious gaps. For a deeper dive into this, you can explore our complete guide on how to measure software quality for a broader perspective.
The strategic importance of these metrics is reflected across the industry. The software testing market is projected to hit $48.17 billion in 2025 and is on track to nearly double by 2030. This growth is fueled by the staggering cost of software failures, which has pushed some large companies to dedicate over a quarter of their entire software budget to QA—validating the critical need for precise measurement. You can find out more about these software testing market trends and their impact.
How Efficient Is Your Testing Process?
Great software isn’t just about the final product—it’s about how you got there. While product metrics tell you about the health of your software, process metrics are about turning the microscope inward to examine how your own quality assurance team operates.
Think of these numbers as your team’s performance review, but without the awkward small talk. They help you answer the tough questions: Are we even testing the right things? How fast are we finding and squashing critical bugs? And are we spending our time on work that actually moves the needle?

Tracking these test metrics in software testing is how you turn QA from a simple cost center into a powerhouse that drives real value for the business.
Test Coverage: Exploring Your Application’s Territory
Imagine your application is a massive, uncharted map. Test Coverage is the metric that tells you how much of that territory your tests have actually explored. A high coverage percentage means your tests are digging into all the nooks and crannies of your code, leaving fewer places for bugs to hide.
This is usually measured in a couple of key ways:
- Requirements Coverage: This one is simple: what percentage of the specified business requirements have at least one test case tied to them? It’s all about making sure you’re building what you promised.
- Code Coverage: This gets a bit more technical. It calculates the percentage of your source code that gets executed when your automated tests run, revealing which parts of your logic are completely untouched.
A low coverage score in a critical area, like a payment gateway, is a huge red flag. It’s like flying blind in a part of your system where failure could be catastrophic. The goal isn’t always 100% coverage—that can be expensive and impractical—but you absolutely want to ensure all critical paths and high-risk modules are thoroughly vetted.
Test Execution Rate and Pass/Fail Percentage
While coverage tells you what you’re testing, the Test Execution Rate tells you how much testing you’re actually getting done. It’s a raw count of the test cases you run over a specific period, like a day or a single sprint.
This metric really comes to life when you pair it with the Pass/Fail Percentage, which gives you an immediate gut check on your application’s stability. For instance, if you ran 200 test cases and 160 passed, you’re sitting at an 80% pass rate.
A sudden drop in the pass rate from 95% to 60% after a new code merge is a blaring alarm. It tells your team the latest changes likely introduced some nasty regressions that need urgent attention before the entire build is destabilized.
But here’s a twist: a 100% pass rate isn’t always good news. It could mean your tests aren’t tough enough to find real defects. A healthy testing process usually shows a fluctuating—but manageable—fail rate as new features are introduced and eventually stabilized.
The Rise of Automation in Boosting Efficiency
The push for better efficiency is a big reason why test automation has completely taken over the QA world. Its adoption has skyrocketed, with the automation testing market projected to hit an incredible $68 billion by 2025. This isn’t just a trend; it’s a response to the need for faster delivery and higher quality, with 30% of developers now favoring automation over manual testing for its sheer speed.
Automation gives a direct boost to process metrics like test coverage and execution rates. For high-performing teams, integrating it into the DevOps pipeline is no longer a “nice-to-have”—it’s standard practice. To get the full story, check out these key software testing statistics shaping the industry.
Cost Per Bug Fix: Measuring the Financial Impact
Now for the metric that really gets the business folks to listen: the Cost per Bug Fix. This calculation cuts through the technical jargon and quantifies the financial impact of your quality efforts. It adds up all the time and resources—from developers, testers, and project managers—spent finding, diagnosing, and resolving a single defect.
The real magic happens when you track this metric across different development stages. A bug caught early in a unit test might only cost $100 to fix. If that same bug slips into integration testing, the cost can easily jump to $1,000 as it gets tangled up with other systems.
And if that bug makes it all the way to production? The cost explodes, potentially reaching $10,000 or more when you factor in customer support, emergency patches, and the damage to your brand’s reputation. By showing this stark financial difference, QA teams can make a powerful case for investing in better tools and earlier testing. It proves that quality isn’t just an expense—it’s an investment with a massive return.
How AI Is Redefining Test Metrics
Artificial intelligence isn’t some far-off concept anymore—it’s here, and it’s completely reshaping how we think about software quality. We’re moving beyond just running automated scripts. AI is fundamentally changing how we approach, measure, and even talk about test metrics in software testing. This is a massive shift from reactive bug hunting to a more predictive, proactive kind of quality engineering.
Think of it this way: traditional testing is like a detective showing up at a crime scene, trying to piece together what went wrong after the fact. AI is more like a high-tech security system analyzing behavioral patterns to predict where a break-in is most likely to happen, then beefing up security in that specific spot before anyone even tries. That predictive power is where AI really shines.

From Reactive Data to Predictive Insights
Historically, our metrics told a story about the past. A metric like defect density would show us where problems had already cropped up. AI flips that entire model on its head. It digs into historical data from everywhere—code repos, bug trackers, past test runs—to actually forecast future risks.
AI algorithms can now pinpoint “defect hotspots” by finding correlations between things like code complexity, which developer worked on it, and how often a module changes. This lets teams stop guessing and start allocating their testing resources with surgical precision. Instead of a scattergun approach, you can focus intense manual and automated testing on the areas with the highest probability of failure.
This isn’t just theory; it’s happening now. Recent industry data shows that 42% of enterprise-scale companies are already using AI in their testing workflows. And the results speak for themselves. 45.6% of these organizations are seeing better test automation efficiency, and 34.7% have improved their ability to generate realistic test data—a notoriously tricky problem. You can dig deeper into the current state of AI adoption in testing to see just how widespread this has become.
Smarter Test Suite Optimization
What’s one of the biggest drags on any testing process? A bloated, unreliable test suite. Over time, regression suites get clogged with redundant, outdated, or “flaky” tests—the ones that fail randomly for no obvious reason, wasting hours of developer time. AI-driven tools can now analyze a test suite’s execution history to automatically flag these problem children.
AI doesn’t just run tests faster; it helps you run the right tests. By intelligently pruning the test suite, AI makes metrics like pass/fail rates and execution times more meaningful and reliable.
This kind of optimization delivers some huge wins:
- Faster Feedback Loops: When you’re running fewer, more targeted tests, developers get feedback from the CI/CD pipeline in minutes, not hours.
- Reduced Maintenance: Your team spends way less time chasing down flaky tests and more time on work that actually adds value.
- Increased Trust: A reliable test suite means everyone has more confidence in the quality signals it produces.
Generating Realistic Test Data and Environments
One of the oldest challenges in testing is creating data that actually looks and feels like the real world. Bad test data can give you a false sense of security, leading to misleading performance metrics and letting critical bugs slip right into production.
AI is tackling this head-on by generating synthetic data that mimics real user behavior and data patterns, all without compromising user privacy. For example, an AI tool can analyze production traffic to learn what a typical user journey looks like and then spin up thousands of unique test data sets that follow those same patterns. This is a game-changer for getting accurate and reliable measurements from performance, load, and stress testing.
By using AI to build smarter, more predictive testing strategies, teams aren’t just finding bugs faster. They’re building a more efficient, data-driven quality process that anticipates problems before they happen, optimizes precious resources, and ultimately delivers a much more stable product to users.
Building a Data-Driven Testing Culture
Collecting data is easy. The hard part is turning all those numbers into real, meaningful change. If you want to move from a culture run on gut feelings to one driven by data, you need a plan. It’s about making test metrics in software testing a shared language across the team, not just another report that gets filed away and forgotten.
The first step? Tie your metrics to clear, specific goals. Don’t just vaguely aim to “improve quality.” Get specific. Set a tangible target like, “we will reduce production defect leakage by 15% this quarter.” That kind of clarity turns a fuzzy ambition into a measurable mission everyone can get behind.
Start With What Truly Matters
It’s tempting to track every metric under the sun, but that’s a fast track to “analysis paralysis,” where the team is so overwhelmed with data they don’t know what to focus on. Start small. Pick a handful of powerful metrics that speak directly to your biggest pain points right now.
Are post-release bugs making your customers angry? Zero in on Defect Leakage. Is your testing cycle dragging on forever? Start tracking your Test Execution Rate and Mean Time to Repair (MTTR).
The real goal is to get past vanity metrics. Who cares about the raw number of test cases you ran? A high test count means nothing if those tests aren’t actually finding the bugs that matter. Focus on the numbers that spark real conversations and drive action.
Once you’ve picked your core metrics, you need to establish a baseline. You can’t know if you’re getting better if you don’t know where you started. Just look at your data from the last few sprints or releases to set your starting point. This baseline is the benchmark you’ll measure all future progress against.
Make Your Data Visible and Accessible
Nobody wants to stare at raw numbers in a spreadsheet. That’s a surefire way to get your data ignored. To really build a data-driven culture, you have to make the information visual. Turning complex data into simple, intuitive charts and graphs makes it easy for everyone—from engineers to product managers—to understand what’s happening.
A centralized dashboard is perfect for this. A good dashboard tells a story at a glance, highlighting trends, celebrating wins, and flagging problems before they blow up. When you visualize progress, metrics naturally become part of the team’s daily rhythm—a talking point in stand-ups, retrospectives, and planning meetings. For some practical ideas, check out our guide on building a software quality metrics dashboard.
Common Test Metrics and Their Pitfalls
Metrics are incredibly powerful, but they can also be misused. A common mistake is using them to assign blame, which creates a culture of fear where people hide mistakes instead of learning from them. It’s crucial to understand both the purpose of a metric and how it can be misinterpreted.
The table below breaks down a few popular metrics, their intended use, and the common traps to avoid.
| Metric | Intended Purpose | Common Misuse or Pitfall |
|---|---|---|
| Test Case Pass Rate | To provide a quick snapshot of build stability after a change. | Punishing teams for a low pass rate, which can discourage rigorous testing that actually finds real bugs. |
| Defect Density | To identify high-risk modules that may need refactoring or more testing. | Comparing developers based on the defect density of their code, ignoring critical context like complexity. |
| Number of Bugs Found | To understand the volume and trend of defects over time. | Rewarding testers solely based on the number of bugs they log, which often promotes quantity over quality. |
Ultimately, building a data-driven culture is a marathon, not a sprint. It’s about consistently using data to ask better questions, which leads to making smarter decisions. By setting clear goals, choosing metrics that matter, and making that data visible and collaborative, you can turn a bunch of numbers into a powerful engine for continuous improvement.
Putting It All Together: Your Path to a Smarter Testing Strategy
Let’s bring it all home. We’ve seen that test metrics are far more than just numbers on a dashboard—they’re the story of your product’s quality, your team’s efficiency, and your operational maturity. When you learn to read the stories behind the data, you can stop just reacting to problems and start engineering real quality.
The big idea is this: you can shift from constantly fixing bugs after the fact to proactively building a better product from the start. This happens when you connect the dots between different metrics. For example, a product metric like Defect Density tells you where the fires are, while a process metric like Test Coverage can reveal why they started in the first place.
Your First Step Towards Data-Driven Quality
The trick is to start small and be strategic. Don’t drown yourself by trying to track two dozen metrics overnight. Instead, find a specific, nagging pain point in your current workflow and target it.
- Tired of post-release hotfixes? Start tracking Defect Leakage to see what’s actually slipping through to your users.
- Worried about hidden weak spots? Zero in on Code Coverage for your most critical application modules.
- Stuck in slow development cycles? Measure Mean Time to Repair (MTTR) to find the real bottlenecks in your fix-and-deploy process.
Pick one or two metrics that solve a real problem you have right now. Build from there. As you get comfortable with this data-driven mindset—backed by the power of modern automation—you’ll start building a far more predictable and efficient development lifecycle.
A smarter testing strategy doesn’t begin with a massive, complicated overhaul. It starts with the first measurement, the first real insight, and the first informed decision that follows.
By weaving these practices into your routine, you’re not just improving testing; you’re building a foundation for continuous, sustainable improvement. It’s a proactive stance that helps you prevent bugs instead of just finding them, leading directly to higher-quality software and a much more successful product. Your path forward starts now.
Your Questions About Test Metrics, Answered
Jumping into the world of test metrics can feel like a lot. It’s easy to get bogged down in theory, but what teams really want to know is how to make these concepts work without creating a bunch of extra overhead. Let’s tackle some of the most common questions that come up.
How Many Metrics Should We Actually Track?
This is always the first question, and the answer is almost always: “fewer than you think.” It’s tempting to track dozens of data points, but that just creates noise.
As a rule of thumb, start with three to five core metrics that get straight to the heart of your team’s biggest challenge right now.
For instance, if your main goal is to improve stability and stop shipping surprises to users, you’d want to focus on:
- Defect Leakage: To see what’s slipping past your tests and into production.
- Defect Density: To pinpoint which parts of your codebase are causing the most trouble.
- Mean Time to Repair (MTTR): To measure how fast you can fix things when they break.
Steer clear of “vanity metrics.” The total number of tests you run doesn’t mean much if they aren’t finding the bugs that matter.
The best metrics are the ones that spark a real conversation and push your team to act. If a metric doesn’t help you decide what to do next, it’s just distracting you.
Do These Metrics Even Work in an Agile World?
Absolutely. In fact, metrics are crucial for agile teams trying to keep quality high while moving at speed. The trick is to adapt them to your sprint-based workflow.
Instead of analyzing data over months, you look for trends within and across sprints.
For example, tracking the sprint-over-sprint pass/fail percentage gives you a live reading on build health. A sudden drop is a clear red flag that a recent change introduced regressions. In the same way, keeping an eye on the defect arrival rate during a sprint helps you know if testing is keeping up with development.
Okay, So Which Metrics Are the Most Important?
There’s no magic bullet here—the “most important” metric really depends on your project’s goals. But a few stand out because they deliver serious value almost every time.
Defect Leakage (sometimes called Escape Rate) is often at the top of the list. Why? Because it directly measures the success of your entire quality process from the only perspective that truly matters: the customer’s.
It answers the big question: “Did we find the problems before our users did?” A low leakage rate is a powerful signal that your testing strategy is solid and mature.
Ultimately, the most important metrics are the ones that lead to smarter, more confident decisions. Start with a clear goal, pick the metrics that line up with it, and don’t be afraid to adjust as you go.
Ready to transform your testing strategy with real production traffic? GoReplay allows you to capture and replay live user sessions in your test environments, ensuring your updates are battle-tested before they go live. Discover a smarter way to test at https://goreplay.org.