Your First Test for Resilience with GoReplay
Let’s be honest, a proper test for resilience has to go beyond the clean, predictable conditions of a lab. It means throwing the chaotic, messy reality of actual user traffic at your application—something a traditional staging environment just can’t do. This is exactly why tools that can replay real production traffic are no longer a nice-to-have; they’re essential.
Why Staging Environments Give a False Sense of Security

That pristine staging environment you’ve so carefully built? It’s a carefully constructed illusion. It’s clean, predictable, and almost completely useless for figuring out how your system will actually behave under the pressure of real-world chaos.
This gap between ideal lab conditions and the messy truth is precisely where resilience breaks down. Most traditional testing relies on synthetic traffic generators that follow perfect, scripted paths. These tools are fine for establishing a baseline, but they’re terrible at finding the very edge cases that cause real outages.
The Problem With Perfect, Scripted Traffic
Synthetic load generators are built on a mountain of assumptions. They assume users follow a logical flow, that every request is perfectly formed, and that the timing between actions is consistent. Real user behavior, of course, is anything but.
Just think about the difference:
- Synthetic Traffic: A script simulates 1,000 users adding an item to their cart and checking out. Every request is well-formed and follows the “happy path” you designed.
- Real Traffic: A user frantically clicks the “add to cart” button five times, another abandons their session midway through checkout, and a bot scrapes your product pages with malformed HTTP headers.
This is the kind of unpredictable, erratic activity that synthetic tests miss entirely. These aren’t just minor details; they are the exact scenarios that expose race conditions, trigger memory leaks, and lead to cascading failures in production.
The number of cyberattacks on financial institutions has nearly doubled since the pandemic, often exploiting these unforeseen weaknesses. A severe incident can interrupt essential services, disrupt business, and damage customer trust.
This just drives home the point: a system’s ability to withstand the unexpected is what truly matters. Waiting for a real outage to discover these flaws is a reactive, painful, and very expensive strategy.
Finding Failure Before Your Customers Do
A true resilience test requires moving past simulation and into replication. By capturing and replaying your actual production traffic, you can finally introduce the authentic chaos of your user base into a controlled test environment. This isn’t just about volume; it’s about the sheer variety and unpredictability of the real world.
Replaying real traffic lets you:
- Uncover Hidden Bugs: See how your application really handles duplicate requests, strange user-agent strings, and abandoned API calls.
- Validate Caching Strategies: Find out if your caching layer holds up against the erratic access patterns of actual users, not just a simplified script.
- Pinpoint Performance Bottlenecks: Identify slow database queries or API endpoints that only become obvious with a realistic mix of read/write operations.
In the end, your staging environment gives you a false sense of security because it only tests for conditions you’ve already thought of. Real resilience is about preparing for the unexpected. Using a tool like GoReplay to mirror production traffic is the only way to safely introduce that necessary element of surprise, letting you find and fix failures long before they ever impact a customer.
Laying the Groundwork for a Successful Traffic Replay Test

Before you run a single command, your success really hinges on thoughtful prep work. A powerful resilience test isn’t just about blindly replaying traffic; it’s about creating the right conditions to get meaningful answers. This foundational work ensures your efforts are focused and deliver actionable results instead of just noise.
First things first, you need to sort out access and permissions. You’ll need credentials for both your production environment (where you capture traffic) and the test environment (where you replay it). In production, this usually just means enough access to run GoReplay and listen on a network port—you shouldn’t need full root privileges.
Over in your staging or shadow environment, you’ll need permissions to run GoReplay again, but also to monitor the system’s vitals. Think CPU, memory, and error logs. The goal is to see everything without causing disruptions or opening unnecessary security holes.
Getting GoReplay Installed and Thinking About Your Network
With permissions handled, it’s time to get GoReplay onto your Linux server. This part is usually straightforward—just download the latest binary from the official repository and pop it into a standard directory like /usr/local/bin to make it accessible system-wide.
Beyond the install, your network setup is a critical piece of the puzzle. It’s a classic mistake to overlook the dependencies of your test environment.
A valuable resilience test is built on a clear question. Are you testing for a sudden traffic spike? A specific service failure? A slow dependency? A focused hypothesis prevents you from getting lost in a sea of data.
For instance, if your production app relies on external APIs for payment processing or data enrichment, your test environment must be able to reach those same endpoints. If it can’t, you’ll get a flood of false negatives as requests fail for simple networking reasons, not because of a real weakness in your application. Make sure your DNS and firewall rules in staging mirror production as closely as possible.
The Most Important Step: Forming a Test Hypothesis
Finally, and this is the most important part, you need a clear hypothesis. What are you actually trying to break? The goal of a resilience test isn’t just to “see what happens.” It’s to confirm or deny a specific suspicion you have about a potential weakness. This deliberate approach is what separates professional testing from just messing around.
This kind of targeted thinking is more crucial than ever as systems get more complex. In fact, recent data shows that many operational controls fail under pressure—with 22% of endpoint security tools not operating as intended and patch delays averaging a staggering 56 days. These gaps show that resilience isn’t just about infrastructure; it’s about proactively finding and fixing these weak spots before they turn into real incidents. You can dig into these findings in the full 2025 Resilience Risk Index from Absolute.com.
So, what does a good hypothesis look like? Here are a few I’ve used in the past:
- Hypothesis: Our new caching layer will buckle under a 3x traffic surge, which will then overload the database.
- Hypothesis: Injecting a 500ms latency into the inventory service is going to cause a cascading failure in the checkout process.
- Hypothesis: I bet the latest deployment has a memory leak that will become obvious after replaying just one hour of peak traffic.
By defining exactly what you’re looking for, you can focus your analysis on the right metrics and logs. It makes pinpointing the root cause of any failures you uncover so much easier.
Alright, let’s get into the nitty-gritty of capturing the traffic you’ll need for your resilience test. This is where the magic really starts.
How to Capture Real Production Traffic with GoReplay
Now that you’ve got your environment ready and a solid hypothesis in mind, it’s time to gather the raw materials. We’re going to use GoReplay to passively listen in on your production server and record real, live user traffic.
The beauty of this approach is that GoReplay doesn’t interfere with or slow down live requests. It just sits there, quietly recording everything, which makes it an incredibly safe and powerful tool for this critical first step.
The basic idea is simple: start a GoReplay process, point it at the network port your application uses, and tell it to save all the incoming HTTP requests to a file. This file becomes your golden dataset—a perfect snapshot of genuine user behavior.
Kicking Off the Capture
You’d be surprised how straightforward it is to get started. The fundamental GoReplay command just needs to know where the traffic is coming from (the input) and where you want to save it (the output).
Let’s say your application is running on port 8080. To start capturing traffic and save it to a file named production.gor, you’d run a command like this:
sudo gor --input-raw :8080 --output-file production.gor
This tells GoReplay to listen (--input-raw) on port 8080 and write everything it hears to the file (--output-file). We use sudo here because listening on low-numbered network ports usually requires elevated privileges. Once you execute that, GoReplay will start logging every single request, creating a perfect replica of your traffic.
To get the most out of your capture, it helps to understand the key flags available.
Essential GoReplay Capture Commands
Here’s a quick breakdown of some of the most useful GoReplay flags for capturing production traffic for your resilience test.
| Flag | Purpose | Example Usage |
|---|---|---|
--input-raw | Specifies the network interface and port to capture traffic from. | --input-raw :8000 |
--output-file | Defines the file where captured traffic will be saved. | --output-file my_traffic.gor |
--http-allow-url | A filter to capture only requests matching a specific URL path. | --http-allow-url /api/v1/users |
--http-disallow-url | The opposite of allow; it ignores requests matching a path. | --http-disallow-url /admin |
--http-allow-header | Captures requests containing a specific header and value. | --http-allow-header "Auth: Bearer" |
--http-allow-method | A filter to capture only specific HTTP methods like GET or POST. | --http-allow-method GET |
These commands are your basic toolkit for tailoring the capture to fit your exact testing needs.
How Long Should You Capture Traffic?
This is a question I hear all the time. The honest answer? It depends entirely on your traffic patterns and what you’re trying to test.
- For a general resilience test, I recommend capturing traffic over a full business cycle. This could mean a full 24-hour period to ensure you get both peak hours and the quieter overnight lulls.
- To test a specific event, like a marketing campaign launch, you might only need to capture traffic during that specific window.
- If you’re hunting down a suspected bottleneck, capturing just 30-60 minutes of peak traffic is often more than enough to create a dataset that will properly stress the system.
The goal here is to gather a representative sample. You need enough data to include all the weird, unpredictable requests that synthetic tests inevitably miss. It’s this variety that makes a replay-based test for resilience so incredibly valuable. For a deeper look, our guide on how traffic replay improves load testing accuracy has some great insights.
The staggering economic impact of system failures highlights the importance of robust testing. When systems fail, the costs ripple outwards, affecting economies and societies on a massive scale. This underscores the critical need for effective resilience strategies.
The financial toll of these disruptions is a stark reminder of what’s at stake. According to a recent United Nations report, the global economic cost of disasters has soared past $2.3 trillion annually when considering cascading damages. This figure emphasizes why testing for resilience is no longer optional; it’s a fundamental requirement for building sustainable and reliable systems in our interconnected world. You can explore the full findings from the UNDRR’s Global Assessment Report.
Dealing With HTTPS and Filtering Traffic
So, what about encrypted traffic? You can’t just point GoReplay at an HTTPS port (like 443) and expect to see anything useful. The data is encrypted.
The trick is to capture the traffic before it gets encrypted. Most modern setups involve a reverse proxy (like Nginx or a load balancer) that handles the TLS termination on port 443 and forwards unencrypted traffic to your application server on a local port, like 8080. You just point GoReplay at that unencrypted port. Simple.
You can also get laser-focused with your capture. If your hypothesis is about a specific API endpoint, you can use filters to only record the traffic that matters. This keeps your capture files small and your tests precise.
For instance, to capture only the requests heading to your /api/v2/checkout endpoint, you could use a command like this:
sudo gor --input-raw :8080 --output-file checkout.gor --http-allow-url /api/v2/checkout
That --http-allow-url flag is a lifesaver for isolating a critical user journey you want to hammer. By building a focused dataset now, you’ll be able to run a much cleaner test for resilience and get clearer, more actionable results when it’s time for the replay phase.
Alright, let’s get this done. You’ve got your captured traffic file, and now it’s time for the main event: running the actual test and simulating some chaos. This is where we move from prep work to active experimentation. The whole point is to safely replicate the stress of production so you can see exactly how your system holds up—or where it breaks—under real pressure.
The basic command to replay the traffic is just as straightforward as the capture command. You just point it at the traffic file you made and tell it which test endpoint to hit. If you’re running a test server locally on port 8081, it looks like this:
gor --input-file "production.gor" --output-http "http://localhost:8081"
That one line takes every request from your production.gor file and shoots it over to your test server. It perfectly mimics the sequence and timing of your real users. Simple.
Amplifying Reality to Find Your Breaking Points
Just replaying traffic one-to-one is a solid start for checking if things are working correctly. But a real test for resilience means pushing the system beyond its comfort zone. You need to simulate those sudden, massive spikes in demand—like when a new feature goes viral or a marketing campaign blows up.
GoReplay makes this incredibly simple. You can multiply the traffic with a quick rate-limiting flag. Want to see how your app handles double the load? Just add a percentage. To replay traffic at 200% of its original speed, you’d use this:
gor --input-file "production.gor" --output-http "http://localhost:8081|200%"
You can even simulate something that feels like a denial-of-service attack by cranking this up to 1000% or more. I’ve used this technique countless times to find hidden bottlenecks that only show up when multiple parts of the system are getting hammered at once. You might discover that while your application servers are fine, your database connection pool gets exhausted almost immediately.
A critical part of any resilience test is moving from a passive baseline assessment to active intervention. The true insights come from manipulating the environment and observing the system’s reaction, which then informs your post-test evaluation and hardening efforts.
The diagram below shows how these stages all connect to form a complete testing cycle.
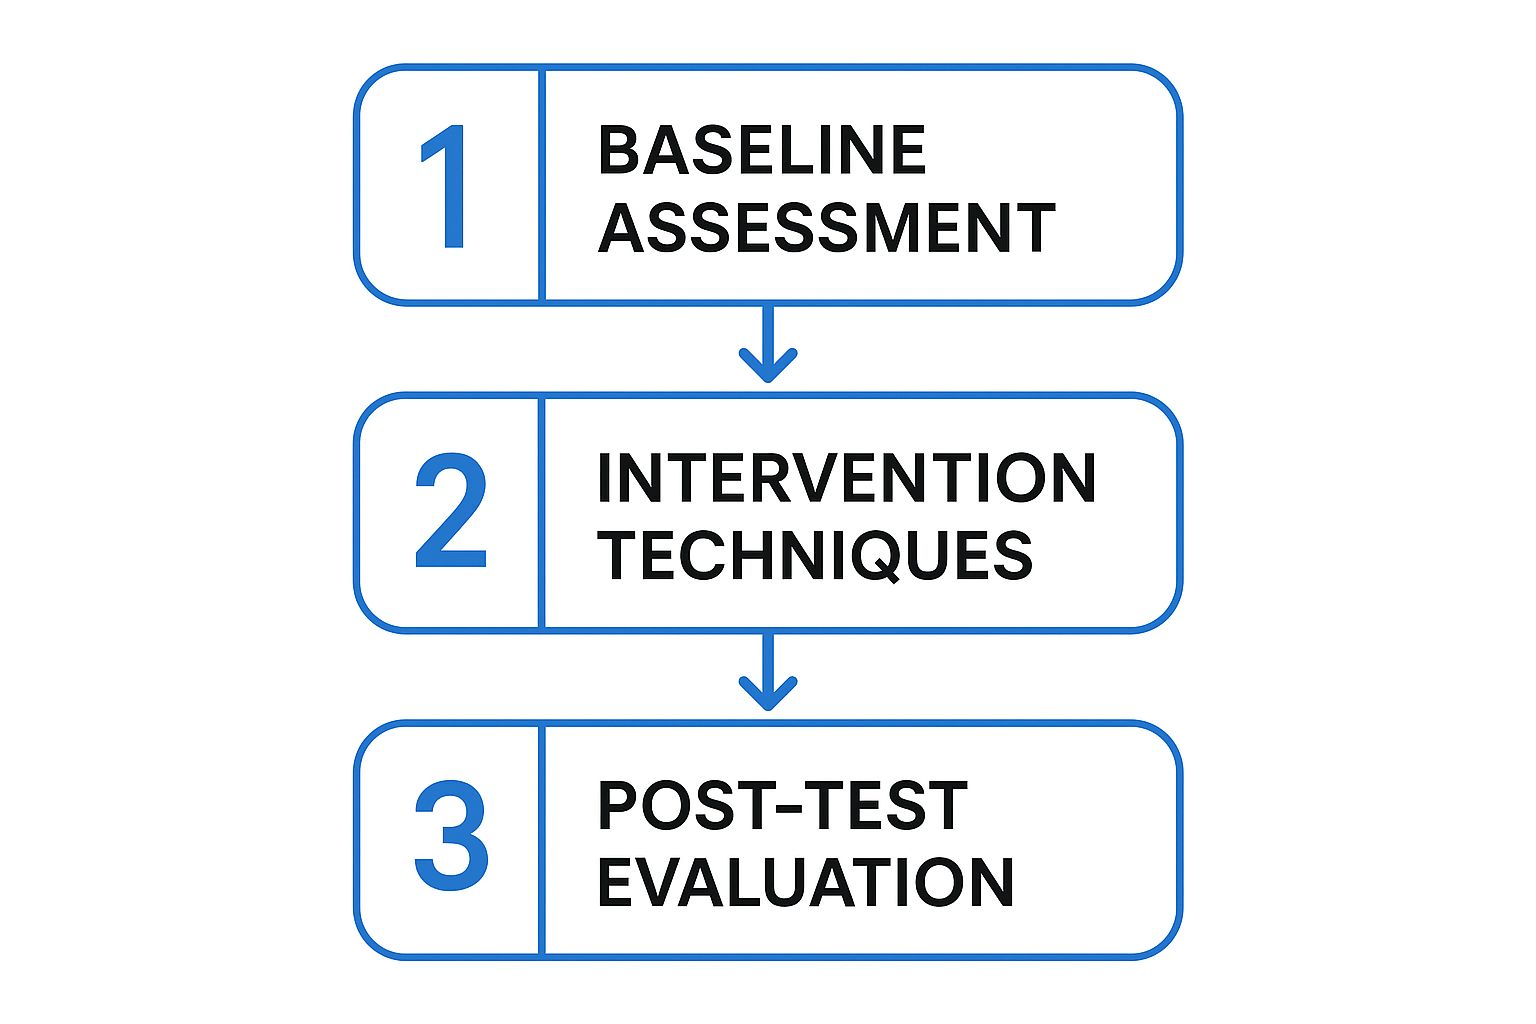
As the flow shows, once you know how your system behaves normally, you have to apply specific stressors—like multiplying traffic or injecting latency—to really understand its limits.
Introducing Controlled Chaos by Modifying Requests
Besides just slamming the system with more volume, you can get more surgical by modifying requests on the fly. This is a core practice of chaos engineering, where you intentionally inject failures to see how the system handles them.
GoReplay supports this with powerful middleware. You can write a simple script to intercept and change requests right before they hit your test server.
Here are a few ways I’ve put this to use:
- Injecting Latency: What happens if a key downstream microservice suddenly gets slow? You can simulate this by adding a delay to any requests heading to that service. It’s a fantastic way to check if your timeout and circuit breaker configurations are actually working as you expect.
- Altering HTTP Headers: Test your auth logic by rewriting or just stripping out
Authorizationheaders. Does your application fail gracefully with a401 Unauthorizederror, or does it fall over with an unhandled exception? - Fuzzing with Malformed Data: Introduce a little chaos by sending unexpected data. For example, modify a POST request to send a string where a JSON payload expects an integer. This is great for uncovering missing input validation that could lead to nasty bugs.
These interventions are what make a test for resilience so powerful. Modern distributed systems often fail in complex, cascading ways. In fact, research on database resilience shows that failures are now the norm, with organizations averaging 86 outages a year. Your testing needs to account for these “grey failures”—like a temporary disk stall or a network partition—not just the perfect “sunny day” scenarios.
By simulating these specific failure modes with GoReplay, you’re actively hunting for weaknesses. You’re not just load testing; you’re running targeted, hypothesis-driven experiments to build a more robust and dependable application. The goal is to find these problems in a controlled environment so your customers never have to.
How to Analyze Test Results and Harden Your System
Running the resilience test was the easy part. Now comes the real work: turning a mountain of raw data into actionable insights that actually strengthen your application. The success of your entire resilience testing effort hinges on what you do next.
Your first stop should always be the high-level system metrics. During the replay, you need to be watching your key performance indicators like a hawk. These are your early warning signs that something is under stress.
Starting with the Vital Signs
I always start by focusing on three core areas. Think of them as the pulse, temperature, and blood pressure of your system.
- Application Error Rates: Keep a close eye on your logging and monitoring dashboards. Are you seeing a spike in 5xx server-side errors? A sudden jump from 0.1% to 5% is a massive red flag that you can’t ignore.
- Response Latency: Watch your p95 or p99 latencies. Are they creeping up? A slow degradation in response time under load often points to a downstream bottleneck, like a struggling database or a third-party API that can’t keep up.
- Server Resource Utilization: Check the CPU and memory usage on your application servers. If CPU usage smashes through 95% and stays there, you’ve likely found a performance ceiling. A steady increase in memory that never drops is a classic sign of a memory leak.
The real value of a resilience test isn’t just finding a single breaking point. It’s about systematically understanding how your system behaves under different kinds of stress, converting those observations into concrete improvements, and then repeating the process.
This initial overview gives you a “where to dig” map. If you see a spike in 5xx errors that lines up perfectly with high CPU, you know exactly where to start your investigation.
Pinpointing Discrepancies with GoReplay
Once you have a general idea of what went wrong, it’s time to get much more specific. GoReplay’s output comparison feature is an incredibly powerful tool for this. It lets you compare the responses from your test environment directly against the original responses captured from production.
This comparison can instantly highlight subtle but critical issues. For instance, you might discover that under load, your test environment starts returning slightly different JSON payloads or incorrect HTTP status codes for certain requests. These are the kinds of insidious bugs that are nearly impossible to find with synthetic testing but become glaringly obvious with a real-traffic replay.
A proper test for resilience should always include this deep comparison step. It’s what separates a superficial check from a truly thorough analysis.
Categorizing and Prioritizing Fixes
As you uncover issues, you need a framework to organize them and, more importantly, act on them. I like to categorize findings into three main buckets. This simple system helps my team prioritize the work and focus on what matters most.
| Category | Description | Example |
|---|---|---|
| Critical Failures | Issues that cause complete service outages, data corruption, or major user-facing errors. | The application crashes and requires a manual restart after replaying traffic at 2x speed. |
| Performance Bottlenecks | Problems that degrade performance but don’t cause a total failure. | API response time for the /cart endpoint increases by 300% when DB CPU is over 80%. |
| Minor Discrepancies | Small deviations from expected behavior that don’t immediately impact users but hint at code quality issues. | A specific error message in the test environment has a typo compared to the production response. |
Critical failures are all-hands-on-deck, fix-it-now problems. Performance bottlenecks are next on the list, as they have a nasty habit of becoming critical failures over time. Minor discrepancies can be tackled when time permits.
This structured approach turns your test results into a clear, prioritized backlog of hardening tasks. For more strategies on building robust systems, check out our guide on stress testing for software applications.
When you start talking about replaying live production traffic, even in a test environment, some very important questions always come up. It’s smart to ask them. Getting these concerns addressed upfront is key to moving forward with a traffic replay strategy confidently and, more importantly, safely.
Let’s dive into the big ones I hear most often.
How Do You Protect User Data and Privacy?
This is the big one—and it should be. The idea of replaying raw production traffic immediately brings up red flags around personally identifiable information (PII). Let’s be crystal clear: you should never replay sensitive user data as-is.
The right way to do this is with data masking or obfuscation. This is where a tool like GoReplay really shines, because it supports middleware that can intercept and sanitize requests on the fly. You can modify the traffic before it ever gets written to a file or replayed to your staging environment.
For example, you can write a simple middleware script to find and replace real user IDs, email addresses, or auth tokens with fake (but correctly formatted) data. This way, you preserve the complex structure of real requests—all the headers, parameters, and chaos—without ever compromising user privacy.
Will Capturing Traffic Slow Down Production?
A totally valid fear. The last thing you want is for your resilience test to cause the exact outage you’re trying to prevent.
Fortunately, tools like GoReplay are engineered to be incredibly lightweight. It works by passively listening to network traffic, almost like tcpdump does. It doesn’t sit in the request path, so it adds zero latency to live user transactions. The listener process just copies packets as they fly by. While it does consume a tiny amount of CPU and memory, the footprint is so small that it’s typically unnoticeable and won’t impact your production app’s performance.
A common misconception is that traffic replay is just another form of load testing. While related, they serve different purposes. Load testing asks “how much,” while a resilience test asks “what if.”
How Is This Different from Load Testing?
This question really gets to the heart of why you’d use traffic replay. While both are about pushing your system, they answer very different questions.
- Load Testing: This is all about capacity. It answers questions like, “Can our API handle 5,000 concurrent users?” You typically use predictable, synthetic traffic to measure raw throughput and latency. It’s about finding the ceiling.
- Resilience Testing: This is about reliability and robustness. It answers, “What happens when our system gets hit with weird, unexpected, or malformed requests?” It uses the messy, chaotic nature of real user traffic to uncover hidden bugs and bizarre failure modes that synthetic scripts would never dream of.
The two aren’t mutually exclusive; they’re actually perfect partners. A solid testing strategy uses load testing to check for performance bottlenecks and a resilience test with real traffic to make sure your system can withstand the chaos of the real world.
Ready to move beyond synthetic tests and discover how your application really behaves under pressure? GoReplay gives you the power to safely capture and replay real production traffic, uncovering hidden weaknesses before they impact your customers. Start your first true resilience test today with GoReplay.