A Practical Guide to Stress Testing Web Sites

That moment your marketing campaign goes viral should be a cause for celebration. But is your website ready for the flood of traffic, or will it buckle under the pressure, turning a massive win into a public-facing disaster?
Stress testing your website is the only way to swap that guesswork for genuine, data-driven confidence. It’s how you find out exactly how your system behaves when pushed to its limits.
Why Stress Testing Is Critical for Your Website

Let’s be clear: stress testing isn’t just some technical box-ticking exercise. It’s a core business strategy that directly shields your revenue and hard-earned reputation. In a world where user patience is practically zero, sluggish performance or, worse, an outage isn’t a minor inconvenience—it’s a direct hit to your bottom line.
A properly executed stress test hammers your site with overwhelming traffic to find its breaking point before your customers do. This moves you from a reactive, crisis-management footing to a state of confident preparedness. You can roll out new products, launch that huge campaign, or handle a sudden viral spike knowing your infrastructure won’t let you down.
Connecting Resilience to Revenue
The financial damage from a poorly performing website is genuinely staggering. Every second of delay, every moment of downtime, is another potential customer clicking away to a competitor. Stress testing gives you the roadmap to fortify your digital storefront against these expensive failures.
This isn’t just a hunch; the market data backs it up. The stress testing market is projected to skyrocket by USD 4.91 billion between 2023 and 2028, with a compound annual growth rate of 17.53%. This explosive growth points to a critical business reality: industry benchmarks show that 85% of consumers will bail on a slow site. Suddenly, stress testing becomes a matter of survival. You can dig into more data on this market trend to see the bigger picture.
Downtime is no longer just a technical problem; it’s a financial liability. Proactive stress testing is the insurance policy that protects your digital revenue streams, user trust, and long-term brand equity.
Beyond Theory with Real Traffic Replay
For years, stress tests have relied on synthetic scripts that basically guess at user behavior. They have their place, but they can’t replicate the beautifully chaotic and unpredictable nature of real human interactions. This is where modern tooling completely changes the game.
By using a real traffic replay approach with a tool like GoReplay, you can capture the actual HTTP requests from your live users and replay them against a safe, isolated test environment. This gives you the most brutally honest simulation possible, uncovering bottlenecks that synthetic scripts would sail right past. It helps you answer the questions that really matter:
- Can our checkout process actually handle 10x the normal transaction volume?
- How does that one critical API endpoint hold up under a sudden, massive load?
- What is the true breaking point of our database when it’s hit with complex, real-world queries?
This guide is all about getting past the theory. We’re going to dive into practical, battle-tested methods for stress testing your website using this incredibly powerful and realistic technique.
Defining Your Stress Test Goals and Scenarios

A good stress test starts long before you fire up a single virtual user. It begins with a rock-solid, documented plan. Without clear goals, you’re just going to end up with a mountain of confusing data instead of real, actionable insights that make your site more resilient.
Your first move? Get past vague ideas like “see if the site can handle traffic.” You need to focus on specific, measurable outcomes. This simple shift turns a technical check into a strategic business activity that actually protects your user experience—and your revenue.
Pinpoint Critical User Journeys
Every website has pathways that are more valuable than others. These are the sequences of clicks and actions that directly drive your business goals. Figuring out these critical user journeys is the foundation of any meaningful test scenario.
For an e-commerce shop, the checkout process is a no-brainer. If you’re running a SaaS application, maybe it’s the main dashboard load or a core reporting feature. Just ask yourself: what would a failure in this specific area cost us?
Your list of critical journeys might look something like this:
- E-commerce: A user searches for a product, adds it to the cart, proceeds to checkout, and completes the purchase.
- SaaS App: A user logs in, loads their primary project dashboard, and exports a performance report.
- Content Site: A user runs a site-wide search and then loads a media-heavy article.
By focusing your tests on these specific website flows, you ensure you’re protecting the parts of your user experience that matter most.
Set Realistic Traffic Targets
Okay, you know what to test. Now you need to decide how much load to throw at it. Pulling a number out of thin air just won’t work. Your traffic targets have to be grounded in real data and smart business projections.
Start by digging into your web analytics. Find your current peak traffic—how many concurrent users are on your site during the busiest hour of the busiest day? That number is your 1x baseline. From there, you can set progressive goals based on what’s coming next.
- Anticipated Growth: If your user base is growing 20% month-over-month, testing at 2x your current peak gives you a healthy buffer for the near future.
- Marketing Campaigns: Planning a huge Black Friday sale or a big product launch? You might need to test for 5x or even 10x your baseline to get ready for that kind of surge.
Your goal isn’t just to pass a test; it’s to find the breaking point. By incrementally cranking up the load (say, from 2x to 5x, then 10x), you discover your system’s true limits. You see how it degrades under pressure, which is vital information for capacity planning.
Define What Failure Actually Means
This might be the most important part of your planning. A test without clear success or failure criteria is just a simulation. You have to define precise, measurable thresholds that tell you exactly when the system is no longer performing at an acceptable level.
These thresholds, often part of a Service Level Agreement (SLA), give your test results context. They are the hard-and-fast benchmarks you’ll measure everything against.
| Metric | Example Threshold | Why It Matters |
|---|---|---|
| Response Time | Page load time must not exceed 3 seconds. | Users hate slow sites and will leave. This directly hits conversions. |
| Error Rate | HTTP 5xx server errors must stay below 1%. | A high error rate means instability and a terrible user experience. |
| CPU Utilization | Server CPU should not sustain above 80%. | High CPU is a classic leading indicator of an overloaded system about to fall over. |
| Throughput | Must handle at least 500 requests/second. | This measures your system’s raw capacity to process user actions. |
With these goals, journeys, and failure thresholds clearly defined, you have a robust plan. Now you’re ready to build out an appropriate test environment and grab the tools you’ll need to run this thing for real.
Building a Test Environment for Accurate Results
The insights you get from a stress test are only as good as the environment you run it in. Seriously. Kicking off a sophisticated test on a setup that doesn’t really match your live system is a fast track to getting garbage data. You’ll either miss critical bottlenecks or, just as bad, waste time chasing phantom issues that don’t even exist in the real world.
Building a proper test environment is an investment, no doubt about it. But it’s an investment that pays for itself over and over by preventing costly production meltdowns. The whole point is to create a sandbox that’s as close to a carbon copy of your production environment as you can possibly get. This fidelity is what separates a truly insightful stress test from a useless academic exercise.
Choosing Your Environment Strategy
You’ve got a couple of options for setting up your testbed, each with its own trade-offs in cost, complexity, and accuracy. The right choice really comes down to your budget, your team’s risk tolerance, and the specific goals you laid out in your test plan.
- Dedicated Staging Server: This is a super common and pretty cost-effective approach. It’s a separate server or cluster that hosts a copy of your application. While it might not have the same raw horsepower as production, it gives you that crucial isolation.
- Full Production Replica: This is the gold standard for accuracy. A full replica mirrors everything—from the server hardware and load balancers to the database size and network configuration. It’s definitely more expensive but delivers results you can actually trust.
For most teams, a well-configured staging environment is a solid place to start. The key is to make sure it mirrors production where it really counts, especially with software versions and network architecture.
The Art of Mirroring Production
Creating a high-fidelity test environment is about more than just deploying the same code. The details are everything. I’ve personally seen tests produce completely useless results because a single, overlooked firewall rule in the test environment throttled traffic in a way that would never happen in production.
To dodge those kinds of pitfalls, you need to get obsessive about mirroring these key areas:
- Hardware and Infrastructure: Use the same instance types, CPU cores, and memory allocations as your production servers. If you use a CDN or a load balancer in production, you absolutely need one in your test environment, too.
- Software and Configurations: All your versions need to be identical. We’re talking operating system, web server (like Nginx or Apache), database, and application runtime (e.g., Node.js, Python). No exceptions.
- Network Conditions: Replicate firewall rules, latency, and even bandwidth constraints. A test environment with unlimited, low-latency access to its database is going to perform wildly different than a production setup with proper network segmentation.
- Data Volume and State: This one is huge. Testing against a nearly empty database is pointless. Your test database has to be populated with a realistic volume of anonymized production data to simulate how your queries perform in the wild.
Getting this level of detail right is crucial. The investment in robust hardware for testing is exploding for this very reason. The global market for stress test benches—the physical hardware used to validate server components—is expected to hit $1,556.34 million by 2025. This just goes to show how much the industry is focusing on hardware-level accuracy to prevent outages that can cost businesses over $100,000 per minute. You can dig into this hardware trend in this market analysis.
A classic mistake is using “clean” or overly sanitized test data. Real-world data is messy. It’s what triggers edge cases and performance bottlenecks that pristine data will never, ever uncover. Always use a recent, anonymized snapshot of your production database.
Isolation Is Non-Negotiable
Last but not least, your test environment must be completely isolated from your production systems. This isn’t a suggestion; it’s a critical safety measure. Under no circumstances should a stress test ever be able to impact your live users or touch production data.
This means separate servers, separate databases, and firewalled network connections. When you’re using a traffic replay tool like GoReplay, you’ll capture traffic from the production network but always replay it against this isolated environment. This setup gives you the best of both worlds: the realism of production traffic patterns without any of the risk.
With this secure, mirrored environment locked in, you’re ready to actually run the test.
How to Stress Test Using Real Traffic Replay
Instead of guessing at user behavior with synthetic scripts, we’re going to use a traffic replay approach. This is where modern, effective stress testing really shines. The idea is simple but powerful: capture real HTTP requests from your live users and replay them against an isolated test environment.
This technique is a total game-changer. You’re no longer testing against a hypothetical user journey; you’re testing against the messy, unpredictable, and wonderfully chaotic reality of how thousands of real people actually use your website.
Capturing Live Traffic with GoReplay
We’ll use an open-source tool called GoReplay to get this done. It’s built for exactly this task. The process kicks off by installing GoReplay on your production server. Don’t worry—it’s designed to listen passively to network traffic without getting in the way of your live application’s performance.
First, you’ll capture live traffic and save it to a file. Just run a command on your production web server to listen on a specific port (like port 80 for HTTP) and write all the incoming requests to a local file.
Here’s a practical example of the command:
sudo ./gor —input-raw :80 —output-file requests.gor
This tells GoReplay to listen for raw traffic on port 80 and dump everything it sees into a file named requests.gor. You can let this run for an hour during peak time or even a full day to grab a really solid, representative sample of your traffic patterns.
The real power here is capturing every nuance of user interaction—every API call, every complex search query, every step in the checkout flow. This rich, real-world data is the foundation of a stress test that will uncover bottlenecks that simple, scripted tests would completely miss.
Replaying Traffic Against Your Test Environment
Once you have your requests.gor file, move it over to a machine that can send traffic to your isolated test environment. Now the fun begins. This is where you can start pushing your system to its limits.
A simple replay command to send the captured traffic to your staging server looks like this: ./gor —input-file requests.gor —output-http=“http://staging.your-website.com” This command reads the saved requests and sends them one-by-one to your staging environment, perfectly mimicking the original user sessions. But for a true stress test, you need to crank up the volume.
To find your website’s breaking point, you can amplify the load. GoReplay lets you multiply the traffic by a specific factor. For instance, to simulate 5x your normal peak traffic, you’d adjust the command like so:
./gor —input-file requests.gor —output-http=“http://staging.your-website.com|500%”
That |500% flag tells GoReplay to replay the traffic at five times the original speed, hitting your test environment with a massive—and realistic—load. You can easily adjust this percentage to simulate 2x, 10x, or even 20x your normal traffic until you find the exact point where things start to break.
This diagram shows the whole process flow, from capturing traffic in production to mirroring it safely in your staging environment.
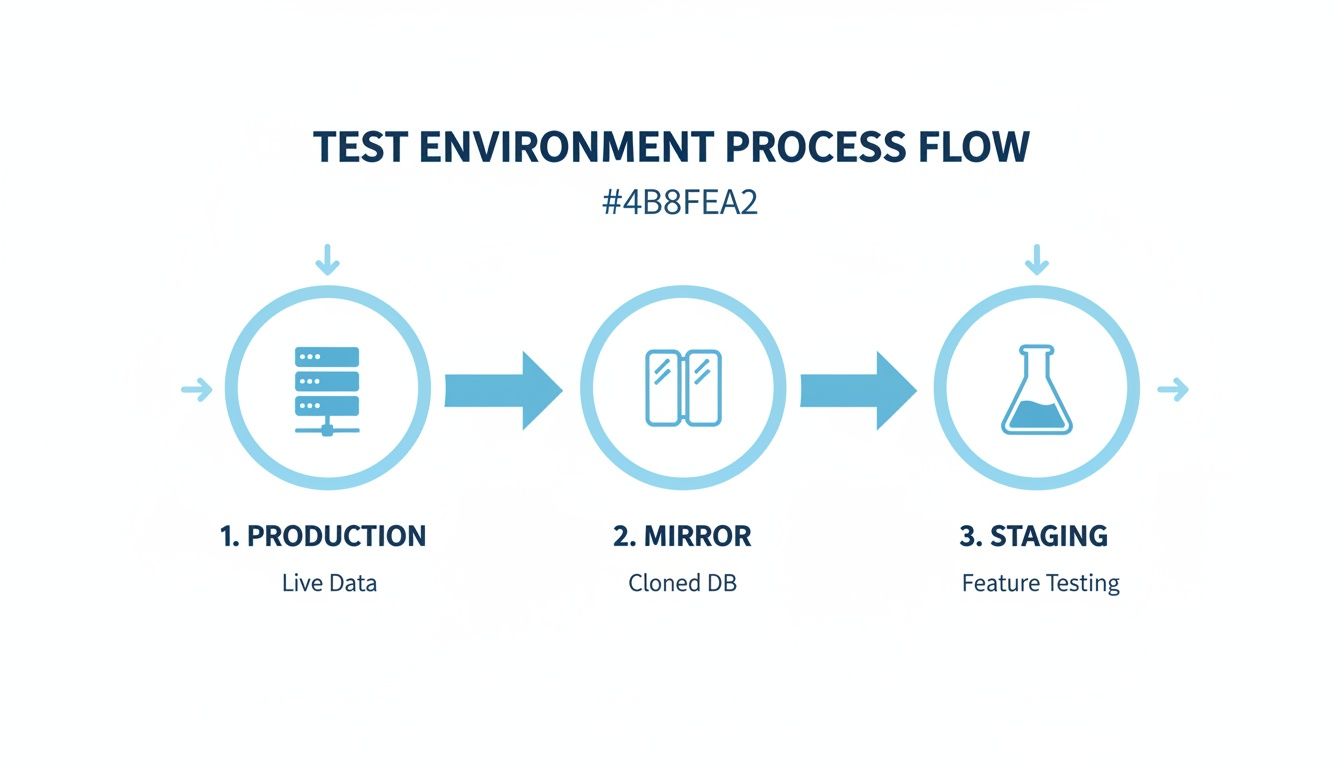
This visual highlights the core principle of isolation. Your live users are never affected while you safely simulate a catastrophic traffic spike on a cloned environment.
Advanced Filtering and Data Masking
Sometimes you don’t need to hammer your entire application. You might want to focus the stress test on a particularly fragile area, like your API or checkout process. GoReplay has powerful filtering options for just that.
You can filter requests based on the URL path, letting you zero in on specific endpoints. For example, this command replays only the traffic directed at your API: ./gor —input-file requests.gor —output-http=“http://staging.your-website.com” —http-allow-url /api/ Data privacy is another huge consideration. Your production traffic is full of sensitive user information like passwords and personal details. With regulations like GDPR in full swing, companies are under pressure to prove their sites can handle surges, facing potential fines up to 4% of global revenue for failures.
GoReplay helps you stay compliant by letting you mask or rewrite sensitive data on the fly. By using real traffic, you gain an unmatched level of accuracy in your stress tests, making sure you’re ready for real-world challenges, not just theoretical ones.
To dig deeper into this approach, check out our guide on how to replay production traffic for realistic load testing.
Analyzing Test Results to Find Performance Bottlenecks
Running the stress test is the easy part. The real work—and the real value—begins when you start digging into the mountain of data it produces. Your job is to become a detective, piecing together clues from different metrics to uncover the hidden weaknesses in your system.
This is where raw numbers transform into an actionable roadmap for building a more resilient website. The key is to look beyond single data points and focus on correlation. A spike in response time is just a symptom; the magic happens when you overlay data streams from your server, application, and database to see how they influence each other under pressure.
Correlating Server and Application Metrics
Your investigation always starts with the vital signs of your infrastructure: the core server-side metrics. These tell you exactly how your hardware is holding up against the traffic storm you’ve unleashed.
Ideally, you’re watching these metrics on a dashboard in real-time as the test runs. This live feedback is gold because it lets you see the precise moment your system starts to degrade as the load ramps up.
Keep a close eye on these fundamentals:
- CPU Utilization: This is often the first thing to break. If your CPU usage shoots up to 90-100% and stays there, your server is officially compute-bound. It just can’t think fast enough.
- Memory Usage: A slow, steady climb in memory usage that never drops back down is a classic sign of a memory leak. High memory can also trigger swapping to disk, which grinds performance to a halt.
- Disk I/O: If you see frantic disk read/write activity, you might be looking at an inefficient database, over-the-top logging, or a caching strategy that isn’t pulling its weight.
- Network Throughput: Are you hitting the ceiling of your network interface? This can become a serious bottleneck, especially for sites that serve a lot of images or video.
While you’re watching the server, you also need to track what your application is doing. The goal is to connect a server symptom (like a maxed-out CPU) to an application behavior (like a sudden flood of errors). For example, you might see your HTTP 5xx server error rate climb at the exact moment your database server’s CPU hits 100%.
Pro Tip: Don’t wait until the test is over to look at the data. Use a live monitoring dashboard (like Grafana or Datadog) to watch metrics as the test runs. This allows you to spot the exact moment performance degrades and correlate it with the traffic load at that instant.
That direct correlation is your smoking gun. It points you directly at the database as the primary bottleneck. Now you know where to focus your energy—maybe it’s time to index slow queries or even upgrade the database hardware. A deeper dive can help you identify performance bottlenecks with much greater certainty.
Pinpointing the Root Cause
Once you’ve connected a server metric to an application problem, it’s time to dig deeper. A high CPU load on your web server is a great clue, but it could be caused by almost anything. Inefficient code? Too many SSL handshakes? A runaway background process?
This is where Application Performance Monitoring (APM) tools become your best friend. They give you code-level visibility, showing you which specific functions or database queries are hogging all the resources.
Sometimes the issue isn’t even complex code but something much simpler, like heavy assets. Learning how to optimize images for web to boost site speed can make a massive difference by just reducing the network load.
To help you get started, here’s a quick-reference guide for diagnosing some common issues you’ll discover during a stress test.
Interpreting Common Performance Bottlenecks
| Symptom Observed | Potential Root Cause | Next Steps for Investigation |
|---|---|---|
| High Response Times but Low CPU | Network latency, slow external API calls, or disk I/O waits. | Check network configuration and analyze the response times of third-party services. |
| High CPU Usage on Web Server | Inefficient application code, too many requests, or complex rendering. | Use a code profiler or APM tool to identify resource-intensive functions. |
| High Memory Usage that grows over time | A memory leak in the application code. | Analyze heap dumps and review code for objects that are not being garbage collected. |
| High Database CPU or Disk I/O | Unindexed queries, inefficient joins, or database connection pool exhaustion. | Review slow query logs and analyze database execution plans. |
This table isn’t exhaustive, but it covers the most frequent culprits we see in the wild and gives you a clear path forward for your investigation.
Creating an Actionable Analysis Report
Finally, all this great analysis needs to be translated into a clear report for your team and stakeholders. A folder full of charts and graphs is useless without interpretation. Your goal is to tell a story with the data you’ve gathered.
A solid post-test report should always include:
- Executive Summary: A quick, one-paragraph overview of the key findings and the single most important recommendation.
- Test Goals vs. Results: How did you do? Clearly compare the performance benchmarks you set (e.g., “response time under 2s”) against what actually happened.
- Bottleneck Analysis: This is the core of the report. Break down each bottleneck you found, complete with the data and charts that prove your case.
- Actionable Recommendations: Create a prioritized to-do list. Each item should be a specific action to fix an issue, assigned to the right team.
A structured report like this turns a technical exercise into a strategic tool that drives real, measurable performance improvements.
Stress Testing FAQs
Diving into performance testing can feel like navigating a minefield of jargon. Getting the fundamentals right from the start is the key to running tests that actually give you valuable, actionable insights.
Let’s clear up some of the most common questions teams have when they start stress testing their websites and applications.
How Often Should We Stress Test Our Web Site?
There’s no magic number here—it really comes down to your development cadence and business rhythm. As a solid rule of thumb, you should run a full stress test before any major product launch or after a significant infrastructure change, like a cloud migration.
For anyone in e-commerce, testing before massive traffic events like Black Friday is non-negotiable. Beyond those big moments, a lot of teams find a quarterly test is a great way to catch any performance issues that have quietly crept in.
The real end-game for mature DevOps teams is baking automated stress testing right into the CI/CD pipeline. This treats performance as a core feature, not an afterthought, giving you constant validation with every single deployment.
What Is the Difference Between Stress, Load, and Soak Testing?
People often use these terms interchangeably, but they are three very different tools for different jobs. Think of it like training an athlete: you need sprints, max-effort lifts, and marathons.
- Load Testing (The Sprint): This is all about measuring performance under expected peak load. The goal is to confirm your site can handle a normal busy day without slowing down. It answers the question: “Can we handle our typical rush hour?”
- Stress Testing (The Max-Effort Lift): This is where you intentionally push the system beyond its limits to find the breaking point. You want to see how and when it fails and—just as important—how it recovers. It answers: “What is our absolute maximum capacity?”
- Soak Testing (The Marathon): Here, you apply a normal, sustained load over a long period, often for 24 hours or more. This is designed to uncover those sneaky issues that only show up over time, like memory leaks or database connection pools getting exhausted.
Is It Safe to Use Production Traffic for Testing?
Yes, it’s completely safe—as long as you do it correctly. This is a perfectly valid concern, but modern tools are built with safety as a top priority.
Tools like GoReplay are designed to safely capture traffic from your live servers without impacting their performance one bit. The absolutely critical part is this: you must replay that captured traffic against an isolated test environment. Never, ever replay it against your live production servers.
For privacy and compliance with regulations like GDPR, you should also lean on features like data masking or parameter rewriting. This lets you anonymize sensitive user info like passwords or personal data during the replay, giving you perfectly realistic traffic patterns without the security risk.
Can We Stress Test Without a Dedicated Staging Environment?
Honestly, you really shouldn’t. It’s a massive risk. Testing directly on your live production environment can easily cause slowdowns or a full-blown outage for your actual users, turning your test into a real-world incident.
You need an isolated environment that mirrors your production setup as closely as possible. Yes, setting up and maintaining a staging environment takes time and resources. But the cost of an unexpected outage from an untested change is almost always far, far higher. A proper test environment is the bedrock of reliable stress testing.
Ready to transform your testing process with the power of real user traffic? GoReplay makes it simple and safe to capture and replay live traffic, giving you the most accurate stress tests possible. Eliminate guesswork and ensure your website is truly ready for any challenge. Start replaying with GoReplay today.