
Statistical Significance for Replay Tests

The most popular advice about statistical significance is also some of the most dangerous: wait for a p-value below 0.05, then ship. That rule may be easy to remember, but it collapses a complex engineering decision into a binary signal. In replay-based system experiments, where captured production traffic exposes latency distributions, retries, session behavior, and failure modes, that shortcut can turn harmless noise into a deployment decision.
A p-value answers a narrow question about how compatible observed data are with a null hypothesis and its assumptions. It doesn’t tell you whether a change matters to users, whether the measured effect is large enough to justify operational risk, or whether you’ve tested the traffic patterns that matter. A credible shadow test combines effect size, confidence intervals, power, metric quality, and production relevance before anyone treats the result as deployment evidence.
Why Your P-Value Is Lying to You
A p-value isn’t lying in the literal sense. The problem is that engineering teams often ask it to answer a question it was never designed to answer.
A result is typically called statistically significant when its p-value falls below a preset threshold such as 0.05. That means the observed data would be unlikely under the null hypothesis, not that the candidate system is valuable, safe, or better in production. The Penn State explanation of statistical significance makes the distinction clear: statistical significance concerns sampling variability, while effect size and confidence intervals are needed to understand practical importance.
In a high-traffic environment, a tiny latency difference can become statistically detectable because the experiment has collected a large amount of data. That doesn’t make the difference operationally meaningful. A small shift that users can’t perceive, that doesn’t affect an SLA, and that adds deployment complexity may be a poor trade even when the p-value crosses the chosen threshold.
Significance isn’t a release criterion
I treat a p-value as a diagnostic signal, not a green light. The release decision needs a separate question: does the measured change clear a predefined practical bar?
For a replay test, that bar might involve:
- Latency: Does the candidate improve the target percentile enough to matter under the service-level objective?
- Reliability: Does it avoid increasing failures, timeouts, retries, or malformed responses?
- Capacity: Does the change remain stable when request shape and concurrency resemble production?
- Operations: Is the improvement worth the added complexity, cost, or rollback risk?
A statistically significant result can fail every one of those checks. Conversely, a useful improvement can remain uncertain when traffic is sparse or latency is highly variable. The absence of statistical significance doesn’t prove that the candidate and control are equivalent.
Practical rule: Never merge “p < 0.05” directly into “deploy.” Put effect size, uncertainty, and guardrail results beside it.
The phrase “statistical significance” also encourages false precision. A result just below a threshold isn’t automatically more credible than one just above it. Recent guidance emphasizes that p-values should be treated as compatibility measures rather than proof, and that significance shouldn’t serve as a proxy for real-world impact, as discussed in the Institute of Education Sciences guidance on interpreting intervention effects.
Replay testing gives teams enough realism to ask better questions. It also gives them enough data to fool themselves more convincingly. The remedy isn’t abandoning inference. It’s refusing to let one threshold carry the entire decision.
The Core Metrics of System Experiments
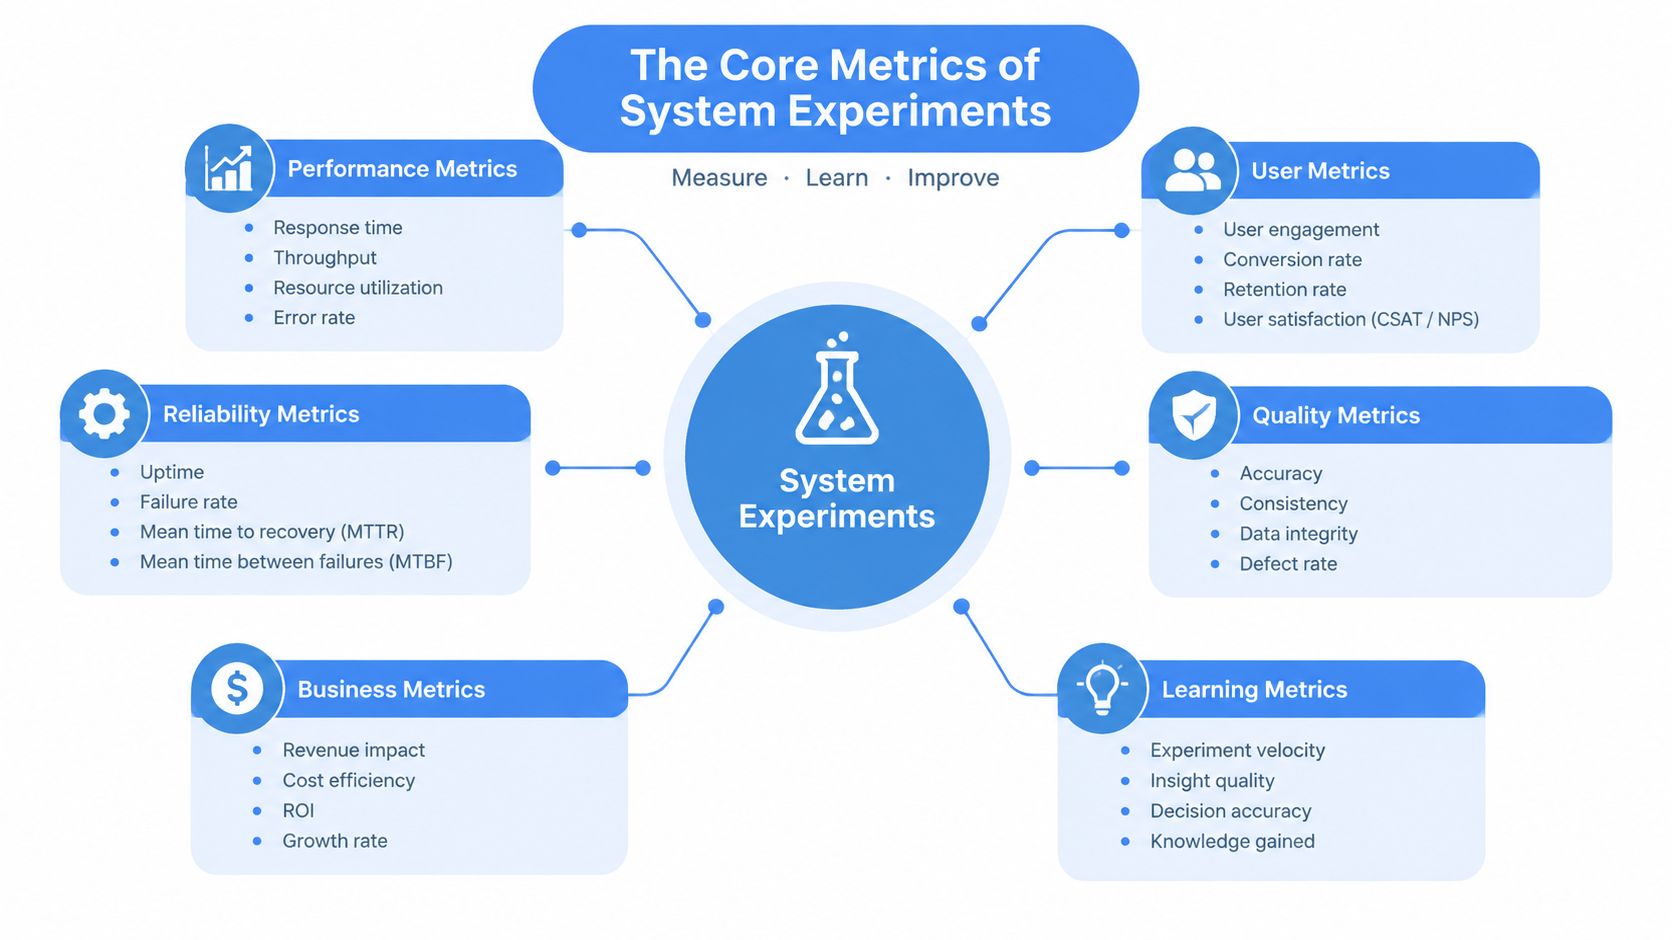
A replay experiment becomes easier to review when every statistical output has a defined engineering role. Four concepts matter most: p-value, confidence interval, effect size, and statistical power.
P-values describe compatibility
Think of the p-value as a question about a traffic replay under a chosen model. If the control and candidate were effectively indistinguishable under the null hypothesis, how surprising would the observed difference be?
That output doesn’t estimate the probability that your code is correct. It doesn’t measure the probability that the candidate will be worse. It only evaluates the observed data against the null hypothesis, given the test design and assumptions. A low value can justify further investigation, but it can’t replace an engineering judgment about impact.
Confidence intervals show the uncertainty
A confidence interval gives you a range of plausible values for the underlying effect under the method used to calculate it. For latency, the interval helps distinguish a stable improvement from a result that could plausibly include no change or a regression.
Suppose a candidate’s response-time estimate looks better than the control. The useful review question isn’t only whether a test rejected the null. Ask whether the interval is narrow enough to support the rollout decision and whether its entire practical range stays inside your acceptable boundary.
For a broader view of what to measure, use this performance testing metrics guide as a reference when defining latency, reliability, and capacity signals.
Effect size connects statistics to users
Effect size tells you how much the candidate changed the system. It might be expressed as a difference in latency, a change in error behavior, or another domain-specific measure. The unit matters because a technically detectable change can still be too small to influence user experience or operational outcomes.
A two-millisecond change, for example, shouldn’t be judged in isolation. Its value depends on the endpoint, the existing latency budget, the variance of the measurement, and whether it affects a meaningful user path. Statistical significance asks whether the data are distinguishable from the null. Effect size asks whether the difference is worth acting on.
Power concerns missed improvements
Statistical power is the ability of a test design to detect an effect of a specified size when that effect exists. In load testing terms, it’s the difference between generating enough representative traffic to expose a bottleneck and running a brief smoke test that happens to look clean.
Power depends on factors such as the effect you want to detect, outcome variability, sample size, and the decision threshold. A noisy p99 latency metric may require a stronger design than a more stable response measure. If the test has weak power, a nonsignificant result leaves you with uncertainty. It doesn’t establish that the systems perform the same.
The dashboard should therefore show the raw distribution, estimated effect, uncertainty interval, and test assumptions together. A single badge marked “significant” hides too much of the evidence that a deployment review needs.
Common Misinterpretations in A/B Testing
The most damaging dashboard mistake is reading a p-value of 0.05 as a probability statement about the code. It isn’t a 5% chance that the new implementation is worse, and it isn’t a 95% guarantee that the finding is real. The false-positive risk depends on prior odds, statistical power, selection practices, and the number of questions being tested.
One analysis found that, with prior odds of 1:10, a p-value threshold of 0.05 could correspond to a false-positive rate of at least 33%. Under the same assumptions, lowering the threshold to 0.005 reduced that rate to about 5%, as reported in this analysis of false-positive risk and statistical significance. Those figures apply to the stated assumptions, not every replay test, but they illustrate why a universal cutoff can be a poor substitute for test design.
The threshold trap
A p-value just above 0.05 isn’t a “trend” that deserves a special status. Calling it near significant encourages teams to keep checking until the number crosses the line. That behavior turns the stopping rule into an unplanned experiment parameter.
The reverse mistake is just as common. A p-value just below the cutoff is treated as a decisive finding, even when the effect is operationally trivial or the interval includes outcomes that would change the rollout decision. Recent synthesis challenges the idea that a universal cutoff can validate claims and warns against comparing significant and nonsignificant results as if they represented two distinct scientific states, as described in recent work on statistical significance reform.
Use a review checklist that forces the team to answer these questions:
- What was the primary hypothesis? Was it written before the replay began?
- What is the effect size? Is it expressed in units that an operator or product owner understands?
- What does the interval include? Could the candidate still violate an SLA or guardrail?
- How many metrics were inspected? Were secondary findings treated as exploratory?
- What were the prior odds? Was the change expected to help, or did the team search broadly for a favorable result?
- What happens if the result is uncertain? Is more representative traffic required, or is the candidate too risky to advance?
A practical conversion-rate team faces the same distinction between detectable movement and meaningful business impact. A resource such as NZ Apps’ optimise conversion rates guide is useful context because it reinforces the need to connect experimental measurements to outcomes rather than treating a dashboard threshold as the outcome itself.
Peer review should happen before the merge request, not after a surprising graph appears in the post-mortem. The reviewer’s job is to challenge the interpretation, especially when the test has many metrics, flexible stopping, or a result that is technically significant but practically irrelevant.
Planning Sample Size and Metric Selection
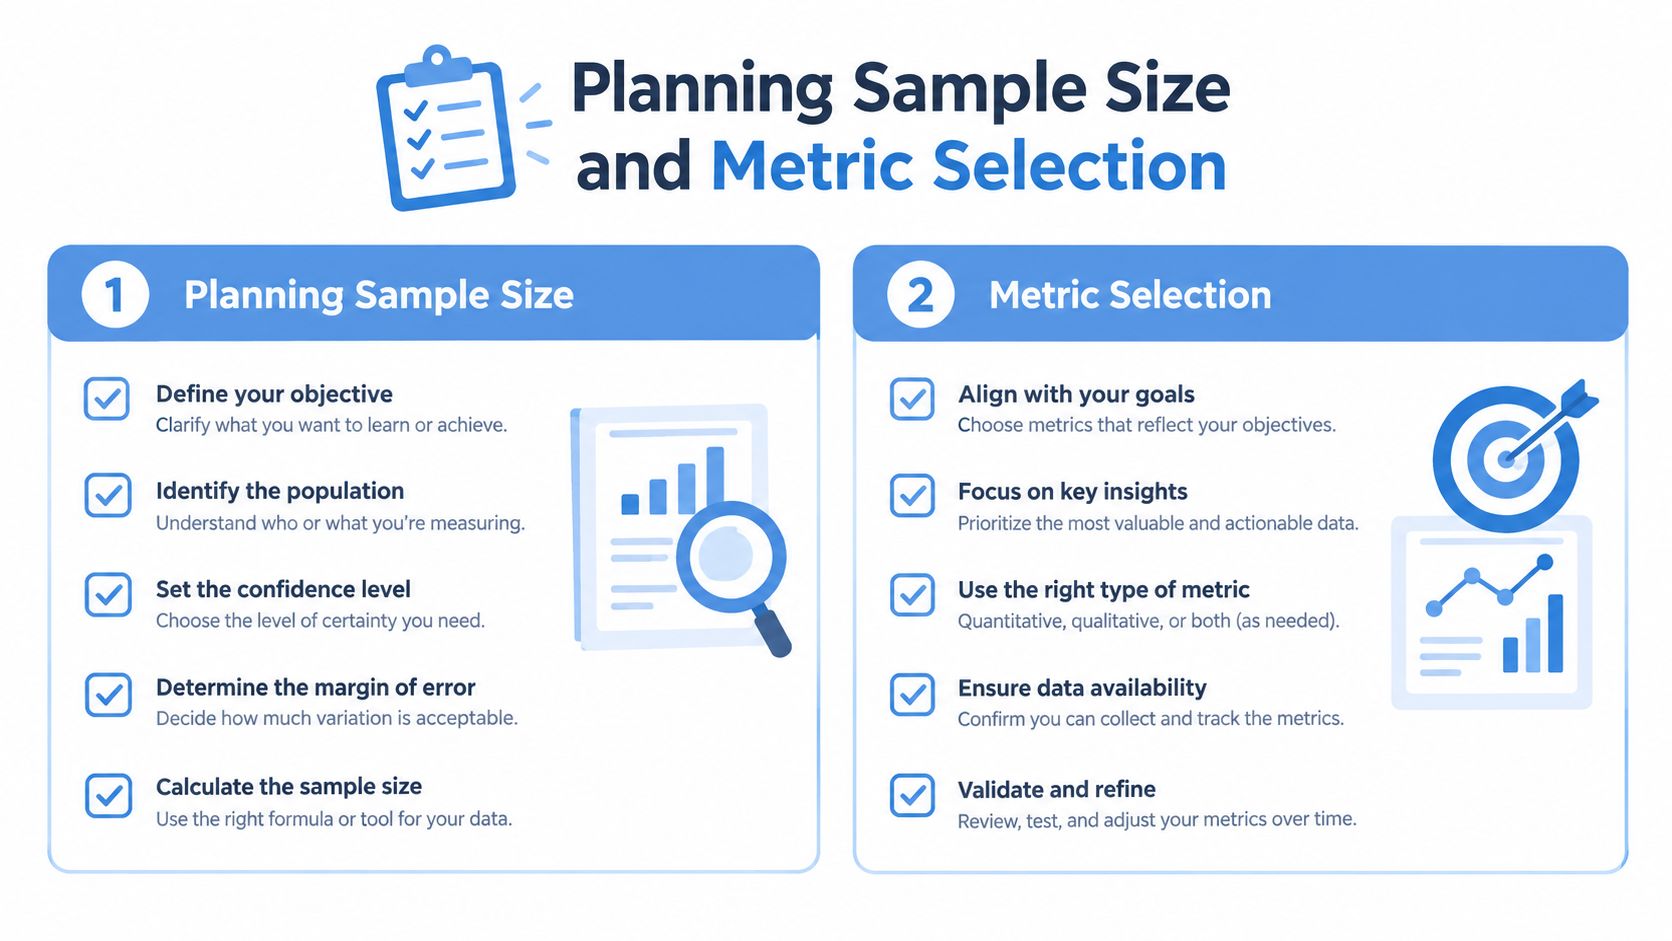
A replay test should have a written charter before anyone captures traffic. Without one, teams tend to choose metrics after seeing the data, stop after a favorable interval, or change the comparison once the first result looks inconvenient.
Start with the practical decision
Define the Minimum Detectable Effect, or MDE, from the service or business decision. Don’t begin with the effect that your current traffic happens to reveal. Begin with the smallest change that would justify the rollout, rollback, or further investigation.
For a latency experiment, the MDE might be tied to an agreed performance budget. For reliability, it could be a tolerable change in errors or timeouts. For a resource-heavy optimization, the practical threshold might include a minimum improvement that offsets implementation and operational cost.
Write the threshold in domain units. “The candidate must be faster” is too vague. “The candidate must improve the primary latency measure without breaching the error guardrail” is testable, even without pretending that every outcome needs a universal numerical cutoff.
Choose one primary metric
Pick the metric that represents the decision, then identify guardrails that can veto the rollout. A p99 latency measure may expose tail behavior that an average hides, while an error rate may be the more important primary outcome for a payment or authentication path.
Metrics should also match the replay’s scope. If the traffic capture excludes important request classes, a precise result on the remaining requests may not generalize. Record inclusion rules, endpoint weighting, session handling, and any traffic transformations in the charter.
A useful charter includes:
- Hypothesis: What change is expected, and why?
- Primary metric: Which single outcome decides the main comparison?
- MDE: What practical difference would change the decision?
- Guardrails: Which failures, latency tails, or resource signals block rollout?
- Analysis method: How will skew, repeated sessions, and missing responses be handled?
- Stopping rule: What evidence ends the test, and what evidence requires more traffic?
- Ownership: Who can approve a rollout when results conflict?
Plan for power, not volume
Sample-size planning connects the MDE, variability, desired power, and significance threshold. The common planning target of 80% statistical power should be treated as a design choice, not a guarantee or a universal law. The calculation is only useful when the replay sample resembles the population you care about and the observations are analyzed in a way that respects their dependence.
Traffic volume alone doesn’t create power. Replaying the same narrow request pattern repeatedly can produce a large dataset with weak coverage. Conversely, diverse traffic with strong variance can require careful modeling before the result becomes precise enough for a release decision.
Don’t peek continuously and stop the moment the p-value looks favorable. Define fixed review points or use a sequential method designed for repeated looks. Predefine whether exploratory findings will be held out for a later confirmation test. This discipline protects the experiment from p-hacking and keeps a long-running shadow test interpretable.
Executing Replay Tests with GoReplay
The practical value of replay testing comes from preserving the shape of real requests while keeping the candidate isolated from users. A typical shadow setup captures live HTTP traffic at the edge or service boundary, sends the original path to the control, and replays a controlled copy against the candidate environment.
The first task is traffic hygiene. Health checks, synthetic probes, bots, administrative endpoints, and malformed requests can dominate a capture without representing user behavior. Filtering them isn’t about making the candidate look better. It’s about defining the population that the experiment claims to represent.
Preserve request classes that influence system behavior. Authentication state, cookies, headers, payload size, cache status, and route selection can all alter latency and failure patterns. If the replay strips those details, the test may measure a synthetic workload rather than the production workload you intended to study.
Keep the comparison paired and safe
The control and candidate need comparable inputs. Ideally, each candidate request corresponds to the same captured request sent through the control path, with timestamps and identifiers that let you match outcomes without allowing the candidate to mutate production state.
Middleware becomes important when requests contain dynamic IDs, session tokens, timestamps, or downstream references. A replay tool should transform those values deliberately, not blindly copy credentials or send destructive operations into a test environment. Data masking belongs in the capture and replay design, especially when payloads contain personal or confidential information.
The GoReplay replay documentation provides the operational reference for configuring replay behavior. The statistical review still belongs to your team. A correctly configured replay can produce invalid evidence if the control and candidate see different request populations or if the candidate’s dependencies behave differently.
Capture raw observations
Don’t export only an aggregate dashboard. Store the raw or suitably summarized observations needed to inspect:
- request and response timestamps
- status codes and error classes
- timeout and retry outcomes
- route and request-shape labels
- payload or response-size metadata where relevant
- control-candidate pairing identifiers
- environment and build metadata
Averages can conceal tail regressions. Status-code totals can conceal endpoint-specific failures. Segment results by route, method, payload class, and other dimensions defined before the test, while treating unplanned slices as exploratory.
The most useful replay review often starts with the ugly records: timeouts, retries, mismatched sessions, and candidate-only errors. Those observations tell you whether the candidate failed under realistic conditions, not merely whether its median response looked favorable in a summary panel.
Advanced Techniques for Noisy Traffic
System latency rarely behaves like a clean bell curve. Queues, garbage collection, cache misses, network contention, downstream throttling, and retries create heavy tails. A standard t-test can be a poor fit when the metric is strongly skewed or when a small number of extreme requests dominate the mean.
Bootstrapping offers a practical alternative for estimating uncertainty. Resample the observed units, calculate the effect for each resample, and use the resulting distribution to construct an interval. For replay tests, the resampling unit matters. If requests from the same session share state or dependency behavior, resampling individual requests can make the interval look more certain than the experiment really is. Resample by session, trace, time block, or another unit that matches the dependency structure.
Reduce variance before adding traffic
More traffic isn’t always the fastest route to a clearer answer. Variance reduction uses predictable pre-experiment information to remove noise from the comparison. CUPED, short for Controlled-experiment Using Pre-Experiment Data, is one example. In a system experiment, relevant historical behavior can help account for stable differences between request groups or entities, provided the adjustment is defined correctly and doesn’t use post-treatment information.
The benefit is analytical, not magical. A variance-reduction method can make a real effect easier to detect, but a poorly chosen covariate can introduce bias or create false confidence. Document the covariates, transformation, exclusion rules, and validation checks before applying the adjustment.
Control the multiple-comparison problem
Replay programs often run several experiments at once. Teams compare multiple endpoints, builds, traffic segments, and metrics, then highlight the most favorable result. Every additional opportunity to find a low p-value increases the chance of a false alarm unless the analysis accounts for the search.
Use a hierarchy:
- Primary outcome: One predeclared metric answers the main question.
- Guardrails: Reliability and safety measures can block rollout.
- Secondary outcomes: These add context but shouldn’t become new primary metrics.
- Exploratory slices: Useful for generating hypotheses, not for claiming confirmation.
Concurrent tests also need isolation. If two candidate services share a database, queue, cache, or dependency, one experiment can change the conditions of another. A lucky result in one microservice may reflect a temporary state created elsewhere.
When the traffic is especially unstable, analyze time blocks rather than treating every request as independent. Compare behavior across warm-up, steady state, peak-like intervals, and dependency events. A candidate that wins only during a quiet window hasn’t demonstrated production readiness.
Building a Culture of Evidence-Based Deployments
Statistical significance becomes useful when engineering teams stop treating it as an approval stamp. The organization needs a repeatable path from hypothesis to replay, from raw observations to uncertainty, and from uncertainty to a controlled rollout.
Put the charter in version control. Require the pull request to name the primary metric, MDE, guardrails, traffic filters, stopping rule, and analysis method. Have CI validate that the test produced comparable control and candidate inputs, while a human reviews whether the result matters operationally.
Product managers and engineers should use the same vocabulary. Statistical significance describes evidence against a null model. Practical significance describes whether the effect is worth a decision. Confidence intervals describe uncertainty, and guardrails describe what the team refuses to trade away.
A mature deployment review asks:
- Does the candidate improve the intended outcome?
- Is the effect large enough to matter?
- Is the uncertainty narrow enough for the risk level?
- Did representative traffic exercise the system?
- Did any guardrail regress?
- Can the team roll back cleanly if live behavior differs?
That process doesn’t eliminate uncertainty. It makes uncertainty visible before users carry the cost. Replay tests are strongest when teams use them continuously, compare candidates against realistic request populations, and treat unexpected findings as prompts for investigation rather than invitations to hunt for a favorable p-value.
The goal isn’t to deploy only when a statistic looks impressive. The goal is to make each deployment more defensible than the last, using production-shaped evidence and explicit operational thresholds instead of gut feeling.
GoReplay lets teams capture live HTTP traffic, replay it safely against candidate services, and inspect the raw behavior behind performance and reliability comparisons. Use GoReplay to build replay tests around representative traffic, predefined metrics, and evidence strong enough to support a controlled deployment decision.