A Practical Guide to Software Testing Metrics

Software testing metrics are more than just numbers on a dashboard; they’re the quantifiable data points that tell you the real story behind your testing efforts. Think of them as a compass for your engineering team, translating complex testing activities into clear, actionable insights about product quality, process efficiency, and team performance. This data is what helps you make smart decisions, manage risk, and ultimately, ship better software.
Why Software Testing Metrics Are Your Compass for Quality
In modern software development, just knowing if a test passed or failed isn’t nearly enough. You need to move beyond simple results. I like to think of software testing metrics not as a report card, but as a sophisticated navigation system for your project.
A pilot wouldn’t fly through thick clouds without instruments, right? In the same way, engineering teams use metrics to steer their projects toward a successful release, helping them avoid the turbulence of last-minute bugs and unexpected delays.
This data-driven approach creates a common language that bridges the gap between technical work and business goals. Instead of a vague update like, “We think the new feature is stable,” you can deliver a precise status: “Defect density for this module is below our 1.5 threshold, and our test pass rates are holding steady at 97%.” That kind of clarity empowers everyone, from engineers to product managers, to make better, more informed decisions.
Guiding Your Strategy and Resources
Good metrics don’t just report the past; they light up the road ahead. They help answer the tough questions that guide how you spend your time and money.
- Process Efficiency: Are we finding bugs efficiently, or is our process too slow? Metrics like Mean Time to Detect (MTTD) can pinpoint bottlenecks you didn’t even know you had.
- Product Quality: How stable is the application, really? Key indicators like Defect Density and Test Pass Rate give you an objective pulse on product health.
- Team Performance: Is the team keeping pace with development? Metrics such as the Test Execution Rate help track progress against real-world project timelines.
By focusing on actionable data, teams shift from a reactive “bug hunting” mode to a proactive quality engineering mindset. The goal isn’t just to find defects but to prevent them by improving the processes that create them.
This focus on measurable improvement is why the global software testing market is projected to grow from roughly $54.7 billion to about $85 billion by 2029. This boom is driven by companies investing heavily in automation and tooling that generate the data needed for metrics like automation coverage and defect density. As companies embrace DevOps, these real-time quality indicators become essential for managing risk effectively. You can explore the full market analysis to see how this impacts testing strategies.
The infographic below shows how these different metrics fit together to give you a complete picture of your engineering health.
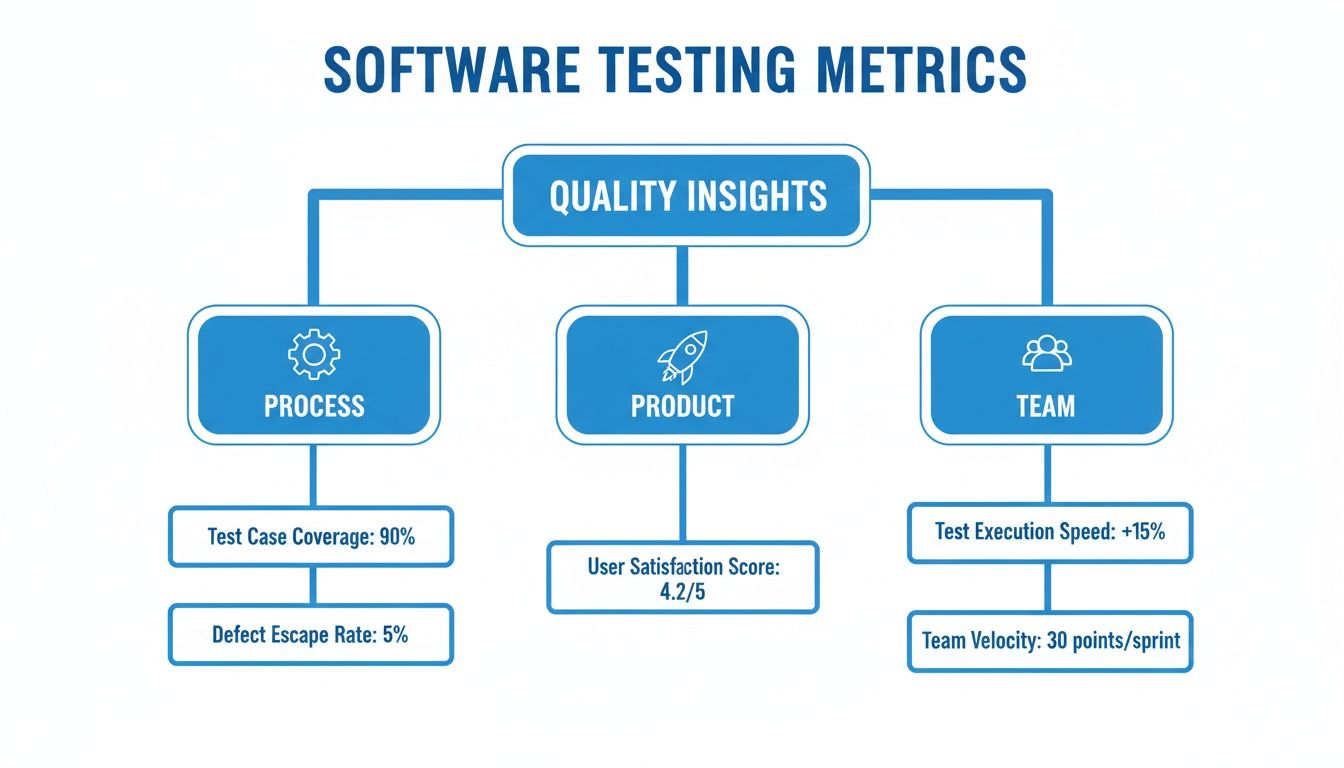
As you can see, the most powerful insights come from looking at how process, product, and team metrics all interact. That’s how you get the full story.
Key Software Testing Metrics at a Glance
To get started, it helps to have a quick reference for the most common metrics and what they’re used for. Here’s a table that breaks down the essentials.
| Metric Name | Primary Purpose | What It Measures |
|---|---|---|
| Test Coverage | Risk Assessment | The percentage of code or requirements covered by tests. |
| Test Pass Rate | Stability Check | The ratio of passed tests to the total number of tests run. |
| Defect Density | Code Quality | The number of confirmed defects per code unit (e.g., per 1,000 lines). |
| MTTD / MTTR | Responsiveness | The average time to detect and resolve a production bug. |
| Automation Rate | Efficiency | The percentage of your test suite that is automated. |
| Test Effectiveness | Process Health | The ability of the test suite to find defects before release. |
| Performance Metrics | User Experience | Application speed, responsiveness, and stability under load. |
This table is just a starting point. The real power comes from choosing the right combination of metrics that align with your team’s specific goals and challenges.
Right, let’s stop talking about testing as just a checklist and start treating it like a strategic advantage. To do that, you need to track the right data. The best software testing metrics give your team a shared language for talking about quality and efficiency, helping everyone zero in on what actually matters.
We’ll start with the metrics that give you a pulse on code quality and build stability, then move into the ones that show how agile and resilient your team really is.
Gauging Code Quality with Defect Density
Imagine you’re building a house. An inspector checks the framing and finds 20 issues in one small room but only two in the entire rest of the structure. Where are you going to focus your attention? That one room, of course.
Defect Density does the same thing for your code. It shows you the number of confirmed defects relative to the size of a feature or module, often measured per thousand lines of code (KLOC). This metric is fantastic for pinpointing high-risk areas in your application that might need more rigorous testing or even a complete refactor.
Formula: Defect Density = Total Number of Defects / Size of Code (e.g., KLOC)
If you see a consistently high defect density in one part of your system, it’s a massive red flag. It’s an early warning sign of underlying complexity or instability, letting you allocate your testing resources where they’ll have the biggest impact.
Checking Build Stability with Test Case Pass Rate
After Defect Density gives you a sense of code quality, the Test Case Pass Rate is your immediate vital sign for the application’s stability. Think of it as a quick health check after every single change.
If you run 100 tests and 98 pass, you’ve got a 98% pass rate. Great. The build is healthy and stable. But if that rate suddenly craters to 75%? That’s your signal to stop everything. It tells you that recent changes have likely introduced serious regressions, and the build is just too unstable to waste time on further testing.
Here’s the simple math:
- Formula: (Number of Passed Tests / Total Number of Executed Tests) x 100
Keeping an eye on this metric from build to build helps your team catch show-stopping issues immediately, preventing a ton of wasted time and effort on a broken foundation.
Measuring Process Effectiveness with Defect Removal Efficiency
Okay, so how good is your testing process at actually finding bugs? That’s where Defect Removal Efficiency (DRE) comes in, and it’s one of the most powerful metrics you can track.
Think of your entire testing process as a filter designed to catch impurities (defects) before they get to the final product (your users). DRE tells you exactly how effective that filter is. It measures the percentage of bugs your team finds before a release compared to all the bugs found, both before and after.
Formula: DRE (%) = (Bugs Found Before Release / (Bugs Found Before Release + Bugs Found After Release)) x 100
For example, if you caught 90 bugs during testing, but customers later reported 10 more in production, your DRE is 90%. That’s a strong signal that your testing process is doing its job well.
Quantifying Team Agility with MTTD and MTTR
Let’s be real: no matter how good your testing is, some bugs will always slip through to production. What truly matters is how your team responds. This is where Mean Time to Detect (MTTD) and Mean Time to Repair (MTTR) become critical.
- Mean Time to Detect (MTTD): How long does it take to find out a bug exists in production? This metric measures the average time from when a bug is introduced to when your team actually identifies it. A short MTTD means your monitoring and alerting are on point.
- Mean Time to Repair (MTTR): Once you know about a bug, how long does it take to fix it? MTTR tracks the average time from detection to a deployed solution. A low MTTR is a clear sign that your team can diagnose, fix, and ship solutions fast.
Enterprise QA leaders live and breathe these numbers because they directly tie testing efforts to production reliability. High-performing teams often push for DRE targets above 85-95% while relentlessly working to shrink MTTD and MTTR from days down to hours. By tracking these figures, you can show a clear reduction in customer-facing failures and even calculate the cost savings. You can discover more insights about these reliability metrics and see how top-tier teams put them to use.
Measuring Your Test Automation and Coverage
Automation is the engine of modern QA, but how do you know if it’s actually running well? Chasing a high coverage percentage is a classic trap. A smart automation suite is more like a strategic investment portfolio than a simple to-do list; the real goal is targeted growth, not just blindly accumulating assets.
Effective automation isn’t about automating everything in sight. It’s about focusing on what delivers the most value. To do that, you need the right software testing metrics to track your progress, spot weaknesses, and prove the return on your investment.

Understanding Test Automation Coverage
At its core, Test Automation Coverage is the percentage of your total test cases that are automated. But the number itself is almost meaningless without context. The real value comes from breaking it down by testing layers. A healthy automation strategy carefully balances different types of tests to build a resilient and efficient quality process.
Think of it like building the test automation pyramid:
- Unit Tests (The Foundation): These form the wide, solid base. They’re fast, cheap to run, and check tiny, isolated pieces of code. High automation coverage here—often 80% or more—is a no-brainer for catching bugs early.
- Integration Tests (The Middle Layer): These tests make sure different parts of your system play nicely together. They’re a bit slower and more complex than unit tests, so a moderate, practical level of automation is the sweet spot.
- End-to-End (E2E) Tests (The Peak): These simulate a full user journey from start to finish. While they provide incredible value, they are also the most brittle and expensive to maintain. A selective, risk-based approach to E2E automation is far smarter than aiming for high numbers.
The best teams don’t aim for 100% automation everywhere. They strategically automate based on risk, focusing on critical user paths and mind-numbingly repetitive regression tests where automation delivers the biggest payback.
Prioritizing Automation with a Risk-Based Framework
A strategic 80% automation rate focused on high-risk areas is infinitely more valuable than a blanket 100% that includes flaky, low-value tests. To get the biggest bang for your buck, you need to prioritize what to automate, and a risk-based framework helps you make those calls objectively.
Start by asking these questions to find the best candidates for automation:
- Business Impact: Which features are absolutely critical to our users and revenue? A failure in the checkout flow is a five-alarm fire; a typo on the “About Us” page is not.
- Frequency of Use: What parts of the application do users touch the most? High-traffic areas are prime candidates for rock-solid regression testing.
- Complexity and Risk: Which modules have a history of bugs or are technically complicated? Use your Defect Density metric to shine a light on these volatile spots.
This framework changes the conversation from “How much can we automate?” to “What should we automate to protect the business?”
Tracking Automation Progress and Stability
Beyond just coverage, you need metrics to keep an eye on the health and growth of your automation suite. Automation Progress tracks the increase in automated test cases over time, sprint by sprint. This is your proof that automation efforts are moving forward and staying aligned with project goals.
Just as important are your Test Execution Rate and Test Failure Rate. These metrics help you hunt down flaky tests—the ones that fail intermittently for no good reason. A high failure rate doesn’t always signal new bugs; it often points to an unstable test environment or poorly written scripts. Flaky tests destroy trust in your automation and need to be stamped out quickly.
The push for automation is huge, with industry surveys showing that 70-77% of companies are now on board. Mature teams often automate about half of their test cases, with many setting coverage targets between 50-80%. This adoption has fueled a global test-automation market projected to hit $68 billion by 2025, as it helps teams run larger test suites, cut down on escaped defects, and achieve more reliable release cycles. Read more on the latest test automation statistics to see how other teams are getting it done.
Using Production Traffic to Enhance Your Metrics
Traditional software testing metrics are solid, but they have a fundamental flaw: they often rely on synthetic data cooked up in a sterile lab environment. It’s a bit like crash-testing a car by rolling it gently down a small ramp instead of slamming it into a wall to simulate a real, chaotic highway collision.
What if you could test your application against the unpredictable, messy, and perfectly realistic behavior of your actual users?
This is the whole idea behind testing with production traffic. Instead of guessing how users behave, you capture and replay their exact actions. This approach doesn’t just refine your existing metrics; it gives them a level of accuracy and relevance that synthetic tests simply can’t touch. It turns abstract numbers into concrete proof of production readiness.
By doing this, you can move beyond measuring something like “defects per release” and start tracking more meaningful data, such as defects per 10,000 real user sessions. This grounds your quality assessment in actual user impact, making your metrics infinitely more powerful.
The Power of Real User Interactions
Testing with production traffic is a game-changer for performance and load testing. Forget about trying to simulate peak traffic—now you can replay your actual Black Friday rush or the exact moment a new feature went viral. This gives you unparalleled insight into key performance metrics.
- Real-World Response Times: Measure how your system performs under the exact API call sequences and data payloads that your users generate. No more hypotheticals.
- Accurate Error Rates: Discover how your application handles the weird, unexpected inputs and edge cases that only emerge from thousands of unique user journeys.
- True System Scalability: Pinpoint genuine bottlenecks that only appear when specific services are hit with a complex mix of real-world requests all at once.
By replaying real user sessions, you’re not just testing code; you’re testing the user experience. You gain the ability to validate that a new release can withstand the true pressures of a live environment before a single customer is affected.
A Practical Walkthrough with GoReplay
So how does this actually work? Let’s say your team is gearing up to deploy a critical update to your e-commerce platform. Instead of just running a standard regression suite, you can use a tool like GoReplay to capture a full day’s worth of live traffic from your production environment.
GoReplay acts like a network listener, silently recording all incoming HTTP requests and their responses without impacting your live system’s performance. Once captured, this traffic can be “replayed” against your staging environment, which is running the new release candidate.
The process is managed and monitored through a clear interface, giving teams full control over the traffic capture and replay activities.

This kind of dashboard provides the controls needed to accurately and safely simulate production loads in a pre-production environment.
During this replay, your team can monitor key metrics with extreme precision. You can directly compare the performance of the new release against the old one, using the exact same traffic. If the new version shows a 5% increase in error rates or a 150ms slowdown in average response time under a real-world load, you’ve found a critical issue that a synthetic test would have almost certainly missed.
This process, often called shadow testing, is a game-changer for validating stability. To dig deeper, you can learn more about using production data for testing and how to get started. This method transforms your metrics from educated guesses into undeniable facts about your application’s readiness for the real world.
Building Actionable QA Dashboards
Raw software testing metrics are like a pile of uncooked ingredients. On their own, they’re just data points. They only become useful when you combine them into a coherent dish—and that’s exactly what an actionable QA dashboard does. It’s the recipe that turns isolated numbers into a compelling story about quality, risk, and progress.
A great dashboard does more than just display numbers; it reveals trends and provides context. It should answer critical questions at a glance, allowing stakeholders to make quick, informed decisions without drowning in a sea of data. Think of it less like a dense spreadsheet and more like a clean, visual control panel for your entire quality process.
Tailoring Dashboards for Different Audiences
The secret to a truly effective dashboard is knowing who it’s for. A senior leader, a QA manager, and a developer all have wildly different priorities and care about different metrics. A one-size-fits-all approach is a recipe for information overload and complete disengagement.
The key is to create tailored views that deliver the right information to the right people.
-
For Leadership (The Strategic View): Executives need a high-level summary that ties quality directly to business outcomes. Their dashboard has to be clean, focusing on bottom-line impact.
- Key Metrics: Escaped Defect Rate, Defect Removal Efficiency (DRE), and overall Test Pass Rate for critical releases.
- The Story: This view answers, “How much risk are we carrying, and is our quality process protecting our customers and brand reputation?”
-
For QA Leads (The Tactical View): QA managers need to monitor the health of their processes and the efficiency of their teams. This dashboard is all about managing resources and spotting trends before they become major problems.
- Key Metrics: Automation Progress (sprint-over-sprint), Flaky Test Rate, and Mean Time to Detect (MTTD).
- The Story: This answers, “Is our automation strategy on track? Are there any bottlenecks in our testing process that need attention?”
-
For Engineers (The Operational View): Developers need immediate, granular feedback on their work. Their dashboard should focus on the here and now, helping them quickly find and fix issues.
- Key Metrics: Test Pass Rate per build, new defects found in their committed code, and specific test failure details.
- The Story: This view answers, “Did my latest change break anything? If so, what do I need to fix right now?”
An effective dashboard doesn’t just report what happened; it inspires action. Each chart and metric should lead to a specific conversation or decision, turning passive data consumption into an active driver of quality improvement.
Common Dashboard Traps to Avoid
Building a dashboard is easy. Building a good one is hard. Too many teams fall into common traps that render their dashboards useless before they even get off the ground.
The most common pitfall is information overload. This happens when a dashboard is crammed with so many charts and numbers that it’s impossible to find a clear signal in the noise. It becomes a wallpaper of data instead of a tool for decision-making.
Another major issue is a focus on vanity metrics. Sure, tracking the total number of test cases executed might look impressive, but it says nothing about whether those tests are actually effective. A good dashboard prioritizes metrics that measure outcomes, like Defect Removal Efficiency, over those that just measure activity.
Finally, make sure your dashboard tracks trends over time. A single data point is just a snapshot; a trend line tells a story. Is your escaped defect rate slowly creeping up? Has your test automation coverage flatlined? These are the critical insights that drive productive conversations and real quality improvements.
You can find more practical tips and sample layouts in our complete guide to building a software quality metrics dashboard that truly makes an impact.
Common Pitfalls and Best Practices for Testing Metrics
Setting up a metrics program is one thing. Making it a healthy, productive part of your culture is something else entirely. While software testing metrics can light up the path to higher quality, a few common pitfalls can turn these powerful tools into a source of friction and mistrust.
Knowing these traps is the first step to building a program that actually drives improvement instead of just creating charts.

One of the most damaging mistakes is using metrics to assign blame. The moment a developer’s personal defect count shows up in a performance review, people will start hiding problems instead of solving them. This creates a culture of fear, not a culture of quality.
Another classic error is chasing quantity over quality. Celebrating a high number of “test cases executed” means nothing if those tests are flimsy and ineffective. Focusing on outcomes, like a dip in your Defect Removal Efficiency (DRE), tells a much more valuable story than just tracking volume.
Navigating Toward Healthy Metrics
To sidestep these issues, you have to shift the entire focus from individual performance to process diagnosis. Your data should be a flashlight, not a hammer.
Here are a few best practices to keep your metrics program on the right track:
- Diagnose, Don’t Judge: Use metrics to find weak spots in the system. A high defect rate in a new module probably points to code complexity or a process gap, not one person’s failure.
- Context is Everything: A number without context is just noise. A 90% test pass rate sounds great, but is that for a brand-new feature or a stable, release-ready candidate? Always wrap your data in a story.
- Evolve Your Metrics: The metrics that help you today might be irrelevant next quarter. As your team, product, and goals change, your dashboard has to adapt right along with them.
The real goal of any metrics program is to spark productive conversations that lead to continuous improvement. If your data isn’t leading to action, it’s not working.
When you stop the blame game and start hunting for actionable insights, your testing metrics become a powerful compass—one that guides your whole team toward better quality and real efficiency.
Common Questions About Software Testing Metrics
Even with a great strategy, you’re bound to have questions when you start putting a testing metrics program into practice. Let’s tackle some of the most common ones that come up.
Think of this as your quick-reference guide for fine-tuning your approach.
What Are the Most Important Metrics for an Agile Team?
In an Agile world, everything is about fast, actionable feedback. You need to know if you’re building the right thing, and if you’re building it right, now. Speed and quality have to work together, so your metrics should support short sprints and continuous delivery.
For most Agile teams, a few metrics give you the biggest bang for your buck:
- Cycle Time: This is your “idea-to-delivery” clock. It measures the full time from when a developer starts coding a feature to when it’s live. It’s the clearest indicator of your team’s real-world velocity.
- Defect Escape Rate: How many bugs are slipping past your team and into production? This is a critical gut-check on how effective your in-sprint testing actually is.
- Test Pass Rate: A simple but powerful signal. Watching the pass rate for each new build gives you an immediate heads-up on its stability. Is it getting better or worse?
- Mean Time to Repair (MTTR): Bugs happen. When they do, this metric tells you how fast your team can jump on a fix and get it deployed.
These aren’t just numbers; they’re the pulse of your team, helping you stay fast without cutting corners on quality.
How Do I Choose the Right Metrics for My Project?
The easiest way to get this wrong is to track metrics just for the sake of it. The right way? Start with your project’s most critical goals and work backward. Every metric you track should help you make a specific, meaningful decision.
Ask yourself, “What critical question will this metric help us answer?” If you can’t come up with a clear, immediate answer, it’s probably not worth the effort. This one simple filter cuts through the noise and keeps you focused on what really matters.
If you’re launching a brand-new project, you’ll want to focus on foundational metrics like Defect Density and Test Coverage to build a solid quality baseline. But for a mature product that’s been around for a while, you might shift to more advanced metrics like Defect Removal Efficiency (DRE) to find ways to fine-tune your existing processes.
How Can We Measure the ROI of Our Testing Efforts?
Talking about the ROI of testing is really about connecting your QA work to real business value. It’s about comparing the cost of your testing—things like salaries and tools—against the money it saves the company.
The most direct way to do this is to estimate what it would have cost if those bugs had made it to production. Think about the developer hours for an emergency hotfix, the time your customer support team would spend handling tickets, and even the potential revenue lost if the site went down.
Metrics like a lower escaped defect rate or a faster MTTR aren’t just technical wins; they have a direct financial upside. They’re the proof that your testing program isn’t a cost center, but a value-driver.
Ready to get metrics that reflect reality? GoReplay helps you capture and replay real production traffic, so your tests and metrics are based on true user behavior. Stop guessing and start validating with confidence by visiting https://goreplay.org.