Mastering Software Test Reporting

Alright, let’s ditch the robotic, textbook definitions and talk about what software test reporting actually is. It’s far more than just a list of what passed and what failed.
Think of a good test report as the ship captain’s log on a long voyage. It’s not just a dry record of events; it’s the official story of your software’s journey to launch. This log charts the product’s health and stability, documenting every storm (a critical bug) and every patch of calm sea (a successful test run).
Without this log, the crew—your developers, project managers, and business leaders—are essentially sailing blind. They have no idea what risks lie just over the horizon.
What Is Software Test Reporting Really About?
A truly effective test report is a communication bridge. It translates complex, technical data into a language that everyone involved in the project can actually understand and use.
For a developer, that report might pinpoint the exact code commit that tanked performance. For a product manager, it might highlight which features are rock-solid and which ones need more work before you go big on marketing. It’s all about creating a single source of truth that helps the entire team make smarter, data-driven decisions instead of just guessing.
The Core Purpose of Test Reporting
At its heart, a good report answers the big, important questions that determine a project’s success. It cuts through the noise and provides clarity.
- For Stakeholders: Is this thing ready to ship? The report acts as a risk assessment, giving business leaders the hard data they need to make a confident go/no-go decision.
- For Development Teams: Where are the fires? It pinpoints recurring bugs, performance bottlenecks, and shaky modules that need immediate attention.
- For QA Teams: How are we actually doing? It gives you a real look at your test coverage, pass rates, and defect trends, which is exactly what you need to improve your own process.
This level of transparency is what makes a report a dynamic tool for progress, not just another document that gets filed away and forgotten.
A great test report doesn’t just present data; it tells a story about quality. It guides the team, highlights risks, and builds confidence in the product. It’s the difference between guessing and knowing.
Why It Matters in Modern Development
In today’s world of Agile and DevOps, test reporting is more critical than ever. Development cycles have shrunk from months to weeks—sometimes even days. No one has time to wait for a massive, end-of-cycle report anymore.
Teams need immediate, continuous feedback to keep moving forward without sacrificing quality. An effective reporting strategy provides that constant stream of information, flagging issues the moment they pop up. It allows you to spot a disaster before it happens, like a sudden spike in API failures or a slow, creeping decline in application performance.
By plugging reporting directly into the CI/CD pipeline, every single code change gets validated instantly. This ensures you’re always building on a stable foundation. It’s a proactive approach that’s fundamental to shipping great software, fast.
The Anatomy Of A High-Impact Test Report
Think of a software test report as a medical chart for your application. A bad one just lists symptoms and leaves everyone confused. A great report, on the other hand, delivers a clear diagnosis, prognosis, and recommended treatment. It turns a mountain of raw data into a powerful story about product quality.
To build a report that actually gets read and acted upon, you need the right components. It’s not about just ticking boxes; each piece has a specific job in telling the story of your software’s health. Skipping these elements is like a doctor ignoring a patient’s vitals—you simply can’t see the full picture.
This flow shows how raw testing data gets refined through reporting to become the bedrock of smart, strategic decisions.
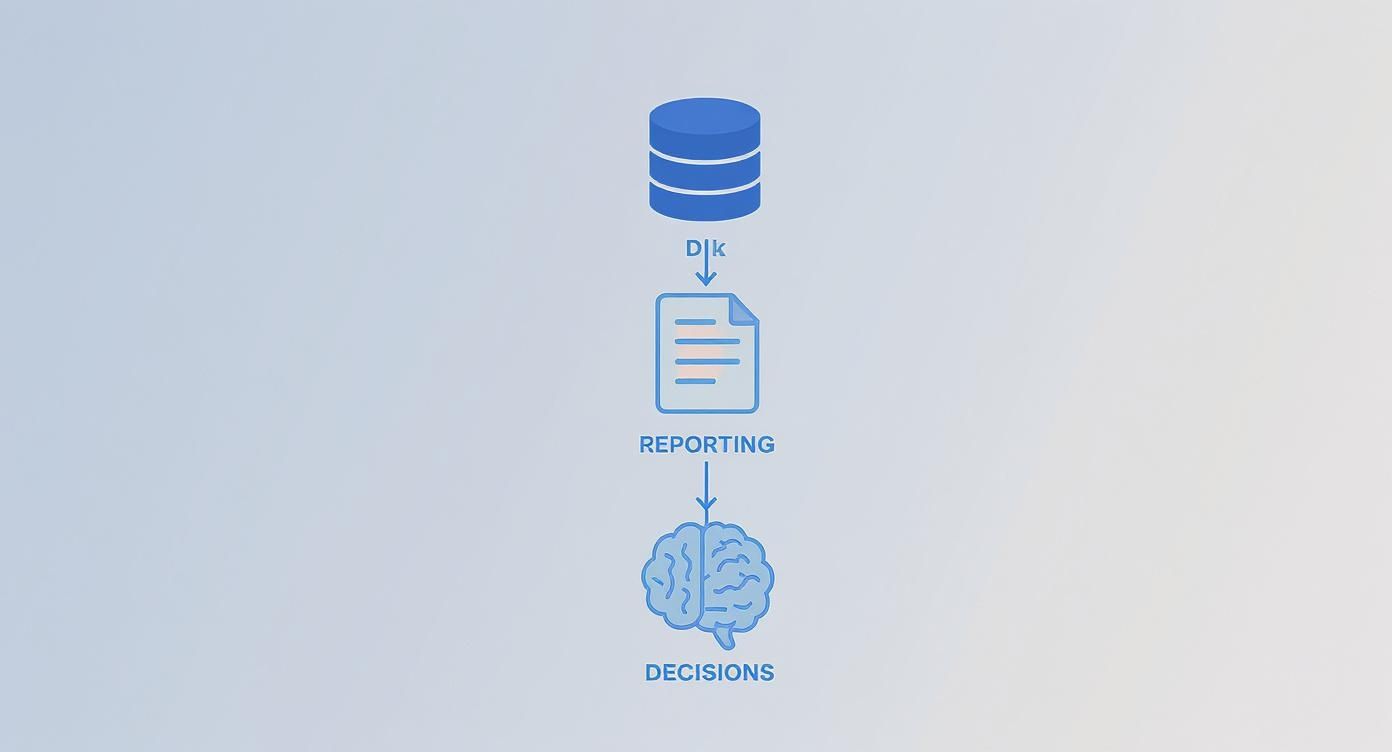
The key takeaway here? Effective reporting isn’t just an afterthought. It’s the critical link that transforms raw numbers into real business intelligence.
The Essential Building Blocks
Every solid test report is built on a foundation of clear, well-structured components. Each one is designed for a specific audience and answers different questions about the testing cycle.
Here’s what every comprehensive report needs to have:
- Executive Summary: This is your 30-second elevator pitch. It’s a high-level overview with the most important findings, major risks, and a clear “go” or “no-go” recommendation. It’s written for stakeholders who don’t have time to get lost in the technical weeds.
- Test Scope and Objectives: What did you test, and why? This section draws a line in the sand, outlining which features, modules, or user stories were included (and just as importantly, which were excluded).
- Test Execution Status: This is the raw progress report. It lays out the total number of test cases planned, executed, passed, failed, and blocked. Visuals like pie charts or progress bars are perfect here for at-a-glance understanding.
- Defect Analysis: Where are the real problems hiding? This section dives deep into the bugs you found, breaking them down by severity, priority, and status. Visual aids like defect burn-down charts are incredibly powerful, showing the rate at which bugs are being found versus fixed.
A report without a clear defect analysis is just a pass/fail list. The real value comes from spotting trends—like a sudden spike in critical bugs—that point to deeper problems in the development process itself.
Key Metrics for Comprehensive Test Reporting
To move beyond simple pass/fail counts, you need to track metrics that tell a complete story about quality, efficiency, and risk. Here’s a look at the metrics that form the backbone of any meaningful test report.
| Metric Category | Specific Metric | What It Measures | Why It’s Important |
|---|---|---|---|
| Test Execution | Pass/Fail Rate | The percentage of test cases that passed versus those that failed. | Provides a quick, high-level snapshot of the build’s stability. |
| Test Execution Progress | The number of tests executed compared to the total number planned. | Tracks whether the testing effort is on schedule. | |
| Blocked Test Cases | The number of tests that couldn’t be run due to external issues or dependencies. | Highlights environmental problems or show-stopping bugs that are impeding progress. | |
| Defect Management | Defect Density | The number of confirmed defects per unit of code size (e.g., per 1,000 lines). | Helps identify which components are the most error-prone and need more attention. |
| Defect Severity & Priority | The impact of a defect on the system (severity) and its urgency to be fixed (priority). | Guides the development team on which bugs to tackle first to minimize business impact. | |
| Defect Leakage | The percentage of defects missed in a testing phase and found by users in production. | A critical measure of the overall effectiveness of your QA process. | |
| Quality & Coverage | Code Coverage | The percentage of the codebase that is executed by automated tests. | Indicates how much of your application is actually being tested. |
| Requirements Coverage | The percentage of business requirements that have associated test cases. | Ensures that the software being built actually meets the specified business needs. | |
| Performance & Load | Response Time | The time it takes for the application to respond to a user request under load. | Directly measures user experience and system performance under real-world conditions. |
| Error Rate | The percentage of requests that result in an error during a load test. | Pinpoints the system’s breaking point and its ability to handle stress. |
Tracking these metrics gives you the data you need to not only assess the current state of the software but also to identify trends, predict future problems, and continuously improve your development and testing processes.
Visualizing Data For Instant Clarity
Here’s a fun fact: humans process visuals 60,000 times faster than text. This is why charts and graphs aren’t just fancy decorations in a report; they’re essential tools for making complex data easy to digest for everyone, from engineers to executives.
Good visualization can turn a dense document into an insightful dashboard. For instance, a simple pie chart can immediately show that 75% of tests passed, while a bar graph can highlight which module is generating the most defects. These visuals cut through the noise and get everyone focused on what matters.
This need for clarity is a huge driver in the software testing industry. The global market recently blew past $45 billion and is on track to hit $109.5 billion by 2027. This growth is all about the demand for better quality assurance, with automation testing alone projected to become a $68 billion market by 2025. You can dig into more software testing statistics to see how this trend is reshaping the industry.
Crafting A Persuasive Narrative
At the end of the day, a high-impact software test report does more than just present facts. It builds a compelling argument about product quality.
By blending a logical structure with clear visuals, you create a report that isn’t just informative—it’s influential. This approach elevates you from a simple bug finder to a trusted quality advocate. Your reports become the source of truth that guides teams, minimizes risk, and ultimately helps everyone build better, more reliable software.
Automating Test Reporting For Speed And Accuracy
Let’s be honest: manual test reporting is a soul-crushing time sink. Picture your QA engineers, hours after a test run, meticulously piecing together spreadsheets, grabbing screenshots, and writing summaries. It’s not just slow; it’s a process begging for human error. A single misplaced decimal or a copy-paste mishap can send a developer down a rabbit hole, chasing a ghost bug that doesn’t even exist.
In any fast-moving development cycle, this delay is more than an annoyance—it’s a critical information gap. By the time a manual report lands on someone’s desk, the dev team is already deep into the next feature. Context switching to fix old issues is inefficient, and the whole feedback loop grinds to a halt. The old way just can’t keep up.

Integrating Reporting Into The CI/CD Pipeline
The solution is to weave automated reporting directly into your Continuous Integration/Continuous Deployment (CI/CD) pipeline. Think of it as installing a real-time quality monitor right on your codebase. Every time a developer commits new code, the pipeline automatically triggers a suite of tests.
Moments after the tests finish, a detailed report is generated and instantly pushed to the team. This creates a powerful and immediate continuous feedback loop. No more waiting hours or days for an update. Developers get actionable insights on their changes in minutes, not days.
This integration transforms test reporting from a periodic, manual chore into an always-on, automated process that’s a core part of the development workflow.
The Power Of A Continuous Feedback Loop
This real-time feedback isn’t just about saving time; it fundamentally changes how your team thinks about quality. When developers get instant reports, they can jump on bugs while the code is still fresh in their minds. That alone slashes debugging time.
The benefits are immediate and tangible:
- Immediate Visibility: Everyone sees a clear, up-to-the-minute snapshot of the build’s health.
- Reduced Human Error: Automated systems don’t have bad days or make typos. Reports are consistent and reliable, every single time.
- Faster Fixes: Bugs get caught and flagged within minutes of being introduced, which drastically improves mean time to resolution (MTTR).
- Increased Developer Accountability: Immediate feedback fosters a culture where developers own the quality of their code from the very beginning.
The real goal of automated reporting isn’t just to generate documents faster. It’s to embed quality assurance into the DNA of your development process, making it a shared responsibility, not a separate phase at the end of the line.
This shift is happening across the industry. The global test automation market was valued at $15.87 billion in 2019 and is on track to hit nearly $49.9 billion by 2025. This explosion is fueled by the fact that 46% of teams are already replacing half or more of their manual testing with automation. Real-time, detailed reports are no longer a luxury; they’re essential.
Tools That Make It Happen
Modern test automation frameworks are built with reporting in mind. Tools like Selenium, Cypress, and Playwright either come with native reporting features or plug seamlessly into specialized reporting libraries. These tools automatically capture a treasure trove of information during every test run.
For instance, a typical Cypress report can give you:
- Test Timelines: A visual breakdown showing exactly how long each step took to run.
- Screenshots and Videos: Automatic captures of the application’s state at the moment of failure, so there’s no more guesswork for developers.
- Browser Console Logs: Direct access to logs and network requests, making it far easier to diagnose tricky front-end issues.
This level of detail turns your reports into a form of “living documentation” for your application. It’s always current, always accurate, and provides a rich historical record of your product’s quality over time. For a deeper look at building a mature automation strategy, check out our guide on automated testing best practices.
By automating your software test reporting, you free your QA team from tedious admin work. This lets them focus on what humans do best: high-value activities like exploratory testing and risk analysis—the creative, strategic work that truly pushes quality forward.
How AI Is Making Test Reporting Smarter
Traditional test reporting is like a rearview mirror—it only tells you what’s already happened. But what if your reports could act more like a GPS, predicting traffic jams and suggesting better routes before you get stuck? That’s exactly the shift AI is bringing to software test reporting. It’s turning reactive summaries into proactive, intelligent tools.
AI algorithms can dig through mountains of historical test data, bug reports, and code commits to spot patterns a human might never see. Instead of just listing what broke, AI starts answering more interesting questions, like which parts of your application are most likely to fail in the next release.
This isn’t just a futuristic idea; it’s happening now. Between 2023 and 2025, the adoption of AI and machine learning in testing shot up from 7% to 16%. Teams are using it to boost test automation efficiency (46%) and generate more realistic test data (35%). The result? A 27% drop in the reliance on manual testing, which frees up a ton of valuable engineering time. You can find more details in the 2025 State of Testing report.
Predictive Defect Analysis
Imagine your test reporting tool flagging a specific code module as a “high-risk zone” for the upcoming sprint. That’s the power of predictive defect analysis.
AI models look at things like code complexity, developer history, and past bug rates to forecast where new defects are most likely to pop up. This lets QA teams aim their limited resources where they’re needed most, catching critical issues much earlier. It’s all about working smarter, not harder.
Smarter Bug Triage And Root Cause Analysis
A failed test is just a symptom; the real work is finding the disease. AI is becoming a powerful diagnostic assistant for developers, speeding up both bug prioritization and the hunt for the root cause.
AI-powered systems can automatically:
- Prioritize Defects: By looking at user impact, severity, and frequency, AI can sort new bugs on its own, making sure developers fix the most critical ones first.
- Identify Duplicate Bugs: AI algorithms scan new bug reports and instantly flag duplicates of existing issues, keeping the backlog clean and focused.
- Suggest Root Causes: By connecting failed test logs with recent code commits, AI can often point to the exact change that caused the problem. This saves developers hours of frustrating detective work.
By automating the tedious parts of bug investigation, AI doesn’t just make reporting smarter—it tightens the feedback loop between finding a problem and fixing it. The whole development process gets faster.
Visual Validation And Anomaly Detection
Your old automated tests are great at checking if a button works, but they’re blind to how it looks. They can’t easily tell if a button is off by a few pixels, if a font is messed up, or if an image is overlapping text.
This is where AI-driven visual validation comes in. These tools use machine learning to “see” the UI just like a human would.
They can automatically spot subtle visual bugs and inconsistencies that scripted tests miss completely. By comparing screenshots of new builds against an established baseline, the AI flags even tiny deviations, ensuring a pixel-perfect user experience. This adds a crucial layer of quality control that used to require slow, manual checks, making your software test reporting more complete than ever before.
Uncovering Hidden Issues With Traffic Replay
Scripted tests are fantastic for checking things you already know about. But what about the things you don’t know about? Your application can pass every single handcrafted test with flying colors, only to fall apart when faced with the chaotic, unpredictable nature of real users. This is the biggest blind spot in traditional test reports—they can lull you into a false sense of security.
What if you could throw the genuine chaos of your production traffic at your application before you deploy? That’s the idea behind an advanced technique called traffic replay. It’s pretty straightforward: you capture actual user traffic from your live environment and then “replay” it against your staging or test servers.
This approach goes way beyond neat, orderly test scripts. It’s a true stress test that uncovers the tricky edge cases and performance bottlenecks that synthetic tests almost always miss.

The concept is simple but powerful: turn your live user data into your greatest testing asset to see how your system really performs.
Beyond Scripted Scenarios
Let’s be honest, most load tests rely on scripts that follow the “happy path.” While that’s a good start, it’s not reality. Real users are messy. They click erratically, abandon carts midway through, and submit all sorts of weird data, creating a mix of requests that’s nearly impossible to script by hand.
By replaying real traffic, you force your system to confront these authentic, complex scenarios. It’s the perfect way to smoke out nasty, hidden bugs like:
- Concurrency Bugs: Those frustrating problems that only pop up when specific, unrelated user actions collide at the exact same moment.
- Data-Dependent Failures: Errors that are only triggered by a unique combination of user inputs you’d never dream of testing for.
- Performance Degradation: The subtle slowdowns in API responses or database queries that only appear under a realistic, mixed load.
Making Reports a True Reflection of Reality
When you bring traffic replay into your testing workflow, your software test reporting gets a massive upgrade. Instead of a report that just says “all 500 tests passed,” you get something much more meaningful. Imagine a report that shows while all the standard functional tests passed, replaying last Tuesday’s peak-hour traffic caused a 30% spike in API latency.
This is the kind of insight that prevents production fires. It allows you to prove that your code changes don’t just work in a sterile lab—they hold up under the pressure of genuine, unpredictable user load.
Tools like GoReplay are built for exactly this. They capture live HTTP traffic without bogging down your production servers and let you replay it, giving you a crystal-clear picture of how your new code will behave. You can dive deeper into how traffic replay improves load testing accuracy to see how it helps build more resilient systems. Ultimately, it makes your test reports a true indicator of production readiness.
How Traffic Replay Elevates Your Reporting
With traffic replay, your reports transform from simple checklists into strategic risk-assessment tools. Suddenly, they’re filled with critical data points that were completely invisible before.
- Comparative Performance Metrics: You can show side-by-side comparisons of key metrics (like response time and error rates) between the old and new code versions, tested against the exact same real-world traffic.
- Bottleneck Identification: Pinpoint the specific API endpoints or database queries that start to buckle when hit with authentic traffic patterns.
- Validation of Caching Strategies: See if your caching layers are actually working as expected under a diverse request load, not just a repetitive, scripted one.
By adding this layer of real-world validation, your software test reporting becomes infinitely more credible. It gives stakeholders the confidence that the application isn’t just functional, but genuinely robust and ready for anything real users can throw at it.
Communicating Test Results That Drive Action
A brilliant, data-rich report is completely useless if it just sits unread in an inbox. The final—and most critical—step in test reporting is actually communicating your findings. This is the moment you turn passive information into a real catalyst for improvement, guiding your team to build better software.
This isn’t just about emailing a PDF. It’s about strategic communication. The goal is to stop being a tester who just finds bugs and become a quality advocate who inspires change. A well-communicated report builds trust, aligns teams, and ensures all your hard work leads to tangible results.
Tailor The Message To The Audience
Different stakeholders speak different languages. A one-size-fits-all report inevitably fails because it tries to say everything to everyone, and ends up saying nothing to anyone. To be effective, you have to tailor your message.
- For Executives and Leadership: They need the bottom line, and they need it fast. Give them a high-level executive summary focused on business impact, risk assessment, and a clear go/no-go recommendation. Visuals are your best friend here—show overall stability and progress against release goals at a glance.
- For Project and Product Managers: This group lives and breathes progress, timelines, and trends. They need to see detailed defect trends, test execution status, and insights into feature stability. A defect burn-down chart is perfect for showing them if the team is keeping up with new issues.
- For Developers and Engineers: They need the technical goods to actually fix the problem. Provide granular logs, screenshots or videos of failures, environment details, and clear, reproducible steps. The idea is to give them everything they need to diagnose and resolve the issue without a painful back-and-forth.
By segmenting your communication, you make sure everyone gets exactly what they need to act. It makes your report exponentially more effective.
Use Visuals To Tell A Compelling Story
Let’s face it, humans are visual creatures. A dense spreadsheet might hold all the data, but a well-designed chart tells a story instantly. Don’t just present data; frame it with a narrative.
For example, instead of just stating that there are 50 open defects, show a trend line that reveals this number has been climbing steadily over the past three sprints. That visual immediately communicates a much deeper problem with quality control that a simple number just can’t convey.
The most effective test reports don’t just list facts; they build a compelling argument for action. Use data and visuals to highlight successes, expose risks, and guide the team toward a specific, positive outcome.
Establish a Consistent Reporting Rhythm
Finally, consistency builds trust and manages expectations. Set up a predictable “reporting rhythm” that aligns with your development cycles. This could be a daily dashboard update, a weekly summary email, or a detailed report at the end of each sprint.
When stakeholders know when to expect updates and what they’ll contain, your reports become a natural part of the project workflow instead of a random interruption. This regular cadence creates a continuous conversation about quality, making sure it stays a top priority for the entire team, sprint after sprint.
Got questions about test reporting? You’re not alone. Even the most buttoned-up testing strategies run into practical, on-the-ground challenges. Let’s tackle some of the most common ones that teams face when trying to turn raw test data into something genuinely useful.
Think of this as your quick-reference guide for the day-to-day realities of creating reports that actually move the needle. No fluff, just straight answers.
How Often Should We Generate Test Reports?
There’s no magic number here. The right reporting cadence depends entirely on your development speed and how quickly you need feedback. The goal is to align your reports with your team’s natural rhythm.
- For CI/CD Pipelines: You need immediate, real-time feedback. Reports should be generated automatically after every single build, telling developers right now if their latest change broke something.
- For Agile Sprints: A detailed summary at the end of each sprint is non-negotiable for planning the next cycle. Daily dashboard updates are also great for keeping everyone on the same page.
- For Major Releases: This calls for a comprehensive, formal report. Stakeholders need a final risk assessment to make a confident go/no-go decision.
What Should We Do With Inconclusive Test Results?
Ah, the dreaded “flaky” test—passes one minute, fails the next, with zero code changes. It’s a massive headache. Ignoring them is the worst thing you can do, because they slowly poison your team’s trust in the entire test suite.
Instead of just hitting “re-run” and hoping for the best, take these steps:
- Quarantine them immediately. Get them out of the main pipeline so they stop blocking builds.
- Dig for the root cause. Flakiness isn’t random; it’s a symptom of a deeper problem. Look for timing issues, unstable test environments, or test data dependencies.
- Prioritize fixing them. Treat flaky tests like any other form of technical debt. A stable test suite is a reliable one, and reliability is everything.
An inconclusive test isn’t just an annoyance. It’s a signal flare, telling you that something in your test environment or the app itself is unpredictable. Chasing down that instability is critical for a trustworthy QA process.
How Can We Measure The ROI Of Our Reporting Efforts?
Proving the return on investment (ROI) of your software test reporting is how you justify the time and resources you’re pouring into it. The trick is to tie your reporting directly to tangible business outcomes.
Start tracking metrics that tell a story of value, like:
- Fewer Production Bugs: Show a clear, measurable drop in critical defects hitting production after you rolled out better reporting.
- Faster Fix Times (MTTR): Measure how much quicker your developers can squash bugs when reports give them the exact, actionable details they need.
- Increased Team Velocity: Connect the dots between better reporting, faster bug fixes, and an overall increase in features shipped per sprint.
When you track these KPIs, you build a rock-solid case that your reports aren’t just administrative busywork—they’re a core driver of quality and speed.
Ready to create reports that reflect what’s really happening in production? With GoReplay, you can capture and replay real user traffic, uncovering hidden issues before they ever see the light of day. Stop guessing and start validating with real-world data. Explore GoReplay today.