Reduce Downtime With This GoReplay Guide
Want to know the most effective way to reduce downtime? It’s simpler than you might think: test your application changes with real user traffic before they ever see the light of day. This is the single best way I’ve found to catch those critical, elusive bugs that traditional testing always seems to miss, preventing painful outages before they ever affect a single customer.
Why Downtime Keeps Happening and How to Finally Stop It
Downtime is more than just a technical hiccup. It’s a direct hit to your revenue, your customer’s trust, and your brand’s reputation. Every single minute your application is offline, you’re not just losing potential sales; you’re actively pushing frustrated users toward your competitors.
So, what’s the root cause of most of these failures? It almost always comes down to deploying changes that hide subtle bugs or performance-killing bottlenecks.
Your standard QA and staging environments, as important as they are, share a fundamental flaw. They just can’t replicate the messy, unpredictable, and often chaotic nature of real-world user traffic. Your team might be great at testing for all the expected use cases, but production traffic is a whole different beast. It’s full of weird API calls, unexpected load spikes, and user behaviors you never dreamed of. This gap between your clean test environment and messy reality is exactly where failures are born.
The Staggering Cost of Application Failures
The financial fallout from downtime is not just significant—it’s staggering, and it’s getting worse every year. For Fortune Global 500 companies, these costs have ballooned to an average of $129 million per facility each year, a shocking 65% increase since 2019. With equipment failure being a primary culprit, the typical manufacturing site now battles 800 hours of unplanned maintenance annually.
This graphic really drives home where the real damage comes from, breaking down the costs and frequency of planned versus unplanned downtime.
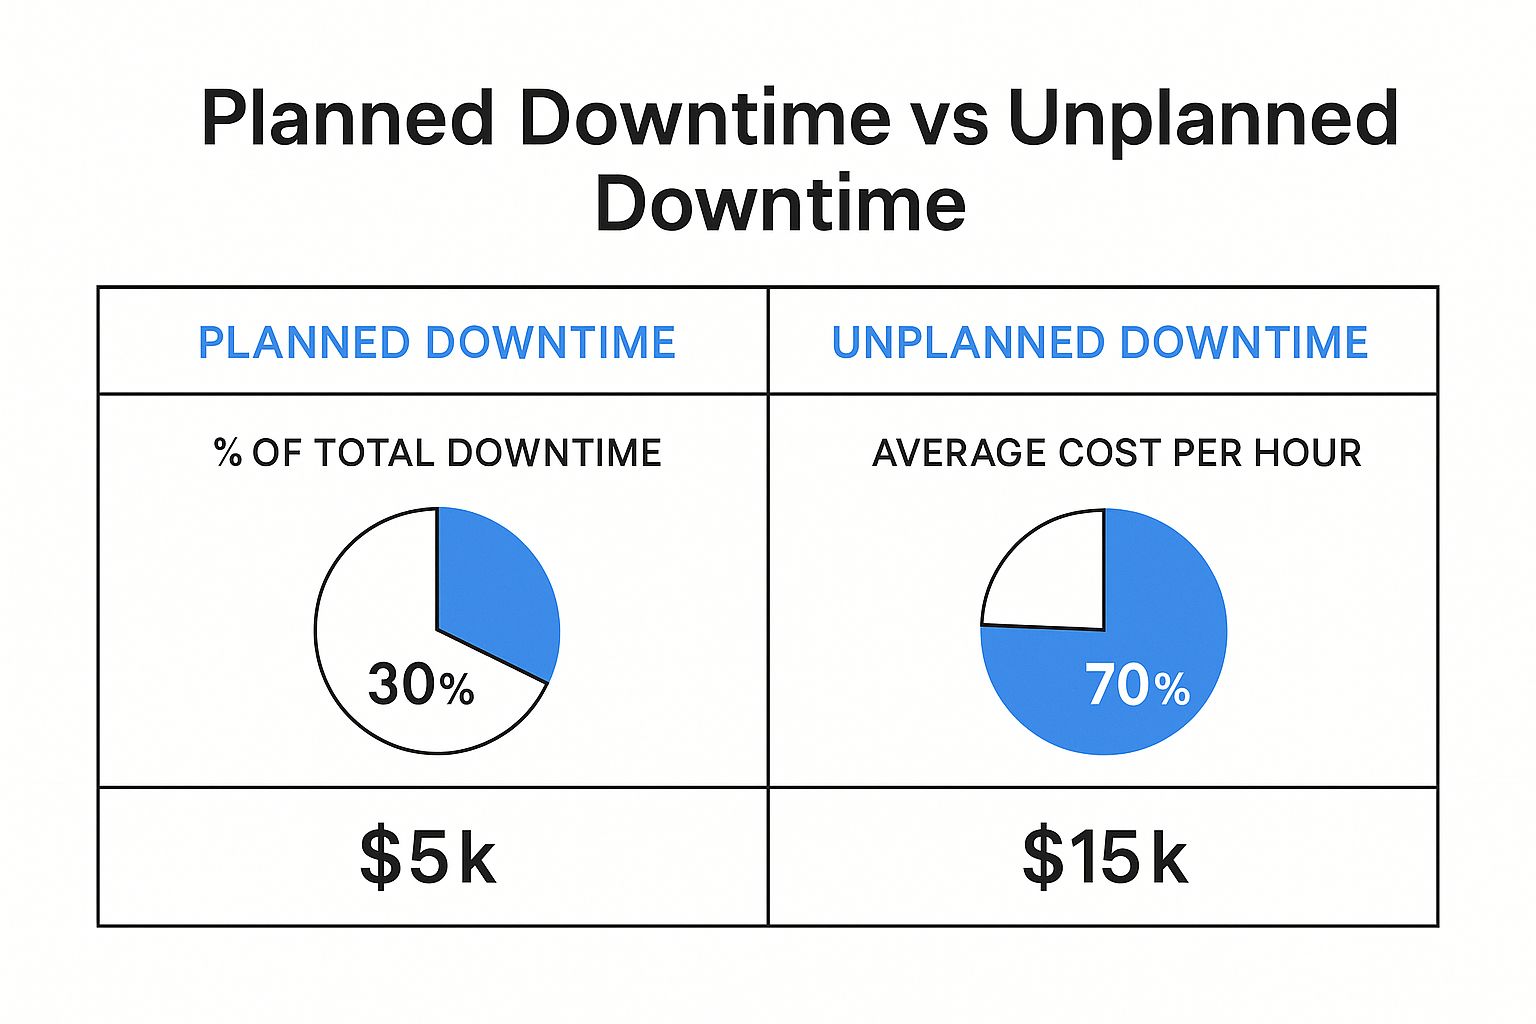
As you can see, unplanned downtime isn’t just more common; it’s astronomically more expensive per hour. This data alone makes a powerful case for finding better ways to prevent these incidents in the first place.
A Modern Strategy to Reduce Downtime
The most powerful strategy I’ve seen for closing that gap between testing and production is to use your production traffic as the ultimate test suite. This is precisely where traffic replay, especially with a tool like GoReplay, becomes a game-changer. Instead of just guessing how users will hammer your application, you can capture their actual, real-world behavior and replay it against a new code version in a completely safe environment.
By simulating real user interactions, you can validate changes against the true complexity of your production workload. This approach turns your live traffic into a powerful, continuous quality assurance asset.
This method lets you do things that were previously impossible:
- Find Hidden Bugs: You’ll uncover those bizarre edge cases and unexpected behaviors that synthetic, scripted tests would never in a million years find.
- Validate Performance: See exactly how your new code holds up under a realistic load before it goes live. No more crossing your fingers and hoping for the best.
- Deploy with Confidence: Dramatically reduce the risk that comes with every single release, whether it’s a tiny patch or a massive new feature.
Let’s be clear about what this means in practice. Traditional testing methods have served us well, but they have inherent limitations in the face of modern, complex systems.
Traditional Testing vs Traffic Replay
| Aspect | Traditional Staging/QA | Traffic Replay with GoReplay |
|---|---|---|
| Test Data | Synthetic, predictable data | Real, unpredictable user traffic |
| Scenario Coverage | Limited to known use cases | Covers all real-world edge cases |
| Load Simulation | Artificial, often uniform load | Authentic, spiky, and chaotic load |
| Bug Discovery | Finds expected, functional bugs | Uncovers hidden performance and logic bugs |
| Confidence Level | Moderate; “It works on my machine” | High; validated against production reality |
The comparison makes it obvious. While staging environments are good for basic functional checks, they leave a massive blind spot when it comes to real-world reliability.
By integrating traffic replay into your development lifecycle, you make a fundamental shift from being reactive to proactive. This is a critical step for boosting application performance with more accurate load testing. You stop waiting for problems to explode in production and start preventing them back in development, which is how you truly reduce downtime.
Your First Step: Capturing Production Traffic

Before you can use real traffic to hunt down bugs and reduce downtime, you have to get your hands on that traffic in the first place. This is where GoReplay’s listener shines. It’s built to be a lightweight, passive observer on your production server, silently copying traffic without getting in the way of your application’s performance.
Of course, there are a couple of practical things to sort out first. You’ll need sudo or root access on your production server to install GoReplay and let it listen in on network activity. While the tool is incredibly light, make sure you have a little disk space ready to store the captured traffic files.
Installing GoReplay
Getting GoReplay onto your server is a breeze. For most Linux distributions, you can grab the latest pre-compiled binary and be on your way in minutes.
If you’re on a server running Ubuntu or Debian, for example, the whole process is just a few quick shell commands to download the package and get it ready.
Download the latest GoReplay binary
wget https://github.com/buger/goreplay/releases/latest/download/gor_stable_x64.tar.gz
Unpack the archive
tar -xvzf gor_stable_x64.tar.gz
Make the binary executable
chmod +x gor
Once that’s done, the gor command is ready to go. The next move is to start capturing live traffic. You’ll do this with the gor capture command, which listens to a network port you specify and saves all incoming HTTP requests to a file.
Mastering the Capture Command
The real magic of GoReplay is in its command-line flags. They give you fine-grained control over exactly how the capture process works. Let’s walk through the most important ones you’ll need for your first capture.
--input-raw: This flag is how you tell GoReplay which network port to watch. For a typical web application, you’ll be looking at port:80for HTTP or:443for HTTPS.--output-file: This specifies the destination for your captured traffic. I’ve found it’s a good practice to name files with a timestamp, liketraffic-%Y%m%d.gor, to keep things organized.
Here’s what a real command looks like in action. To capture all HTTP traffic on port 80 and save it to a file named production-traffic.gor, you’d run this on your production server:
sudo ./gor capture —input-raw :80 —output-file production-traffic.gor This command will run right there in your terminal, showing you live stats as it captures requests. But for a real production environment, you need it running continuously in the background.
A pro tip from the trenches: Use a process manager like
nohuporscreento run GoReplay as a persistent background process. This is a simple but crucial step to make sure it keeps capturing traffic even after you log out of the server.
For instance, just adding nohup to the beginning of your command is all it takes. This one small change transforms a one-off capture into a continuous data collection pipeline, building the foundation for a truly powerful automated testing setup.
Safely Validate Changes with Shadow Testing

Alright, you’ve captured your production traffic. What’s next? This is where the real magic happens: using that traffic to safely vet new code before it ever sees the light of day. The image above shows the core idea behind GoReplay—capturing real user traffic and replaying it against a staging environment to hunt down bugs before they impact a single customer.
This whole process is called shadow testing. It’s easily one of the most effective ways I’ve seen to validate changes against real-world chaos, but without any of the real-world risk.
Understanding the Shadow Testing Workflow
So, what is shadow testing, really? It’s a powerful technique where you essentially mirror your live production traffic to a non-production environment, like a staging server or a canary instance. This “shadow” environment is running your new code, and since it gets an identical stream of requests as your live system, you can compare its behavior directly against your production baseline.
This side-by-side comparison lets you catch regressions, performance hits, or weird errors before anyone notices. It’s the ultimate dress rehearsal for your deployment, giving you concrete proof that your changes are rock-solid.
This kind of proactive validation is critical, no matter your industry. Unplanned downtime is still a massive headache for everyone. For some sectors, the challenge is intense. Automotive manufacturers, for example, can face downtime as often as 20 to 25 times a month—the highest of any sector. These numbers really drive home why strategies like real-time monitoring and predictive testing are no longer optional. If you’re curious, you can dig into more data on how digital transformation helps mitigate costly manufacturing shutdowns.
Implementing Shadow Testing with GoReplay
Now, let’s put that traffic file you captured to work. You’ll use the gor replay command to aim those requests at your staging server. The command itself is simple, but its impact is huge.
You’ll just need two main flags: --input-file to tell GoReplay which captured traffic to use, and --output-http to define the destination—your staging environment’s address.
Imagine you’re testing a major API refactor that’s been pushed to a staging environment. Here’s how you’d tackle it:
- Deploy the New Code: First thing’s first, get your new code version pushed to a dedicated staging or canary server.
- Start the Replay: From another machine (or even your local one), run the
gor replaycommand. You’ll point it to your captured traffic file and your staging server’s URL.
Let’s say your staging server is at http://staging.yourapp.com. The command would look something like this:
./gor replay --input-file "production-traffic.gor" --output-http "http://staging.yourapp.com"
GoReplay will then read every request from production-traffic.gor and fire it off to your staging server, perfectly mimicking the timing and sequence of the original user traffic.
By replaying real-world scenarios, you move from “I think this will work” to “I know this works.” You can watch your staging server logs for errors, check performance metrics, and even diff the responses to guarantee functional correctness. This is a massive leap toward building a zero-downtime deployment culture.
This process gives you priceless, real-world data on how your new code actually holds up under pressure. It’s the most reliable way I know to find those hidden bugs and reduce downtime from unexpected regressions, making your releases a lot smoother and far less stressful.
Automating Your Test and Compare Workflow
Moving beyond manual checks is the key to building a real safety net for your application and starting to reduce downtime in a meaningful way. The next evolution in your testing strategy is to automate the entire replay-and-compare workflow, creating a system that catches regressions before they can ever do any damage.
This is where GoReplay really shines. You can set it up to replay captured traffic against two application versions simultaneously—think your current production build versus a new release candidate. It then automatically compares, or “diffs,” the responses from both. This process instantly pinpoints any discrepancies in behavior, performance, or even subtle error rate changes.
Handling Dynamic Values with Middlewares
One of the first hurdles you’ll likely run into when comparing responses is all the dynamic data. Timestamps, session IDs, authentication tokens, and CSRF tokens are supposed to be different between two separate responses, even if the underlying logic is perfectly fine. This can create a lot of noise and a ton of false positives.
This is exactly what GoReplay’s middleware was built for. A middleware is just a small script that sits between GoReplay and your application, letting you tweak requests or responses as they fly by. You can write a simple one to:
- Normalize Timestamps: Strip or standardize timestamp fields from responses before they get compared.
- Ignore Dynamic Headers: Get rid of headers like
DateorSet-Cookiethat will always be unique. - Rewrite Authentication Tokens: Swap out unique auth tokens with a generic placeholder.
By filtering out this expected “noise,” you can focus the comparison engine squarely on meaningful changes in your application’s logic or data structure. It makes your automated checks far more reliable and, frankly, usable. For a deeper dive, check out our guide on how traffic replay improves load testing accuracy, which touches on some related concepts.
Integrating into Your CI/CD Pipeline
The ultimate goal here is to bake this automated comparison directly into your Continuous Integration/Continuous Deployment (CI/CD) pipeline. Picture this: every time a developer commits new code, a workflow automatically kicks off.
- The latest code gets deployed to a temporary staging environment.
- GoReplay replays a recent slice of production traffic against both the staging and production environments.
- The responses are compared, with your middleware intelligently ignoring any dynamic values.
- If any significant differences pop up—new 500 errors, a spike in latency, or altered JSON payloads—the build fails on the spot.
This creates a powerful, automated quality gate. It stops developers from merging code that introduces regressions, effectively killing outages before they’re even conceived.
This setup transforms your CI/CD pipeline from a simple build-and-deploy tool into a proactive defense mechanism. It delivers immediate, data-driven feedback on the real-world impact of every single code change. This level of automation is how modern engineering teams build resilient systems and release updates with confidence, without that constant fear of causing an incident. It’s a fundamental shift toward a zero-downtime culture.
When you move past the basics of capturing and replaying traffic, you quickly realize that real-world testing demands a lot more nuance. To really get the most out of traffic replay and meaningfully reduce downtime, you have to dig into the advanced features that give you surgical control over your testing. This is where you can start tackling those truly complex scenarios with confidence.
It’s not just about replaying more traffic; it’s about replaying the right traffic in the right way. This is how you isolate specific parts of your system for targeted validation, making sure your tests are both effective and, just as importantly, safe for your infrastructure.
Isolate Traffic with Filtering
Let’s be honest, your production traffic is a chaotic mix of everything. You’ve got API calls, static asset requests, health checks from your load balancer, and actual user interactions all jumbled together. Just blasting this entire firehose at your staging environment isn’t always the smartest way to test a specific change. This is where GoReplay’s filtering capabilities become incredibly useful, letting you isolate only the requests that matter.
You can get surprisingly granular with your filtering:
- HTTP Methods: Need to test a new data submission endpoint? Just focus on
POSTrequests and ignore everything else. - URL Paths: If you’ve just updated a critical microservice, you can isolate all traffic hitting
/api/v3/usersto validate it. - Request Headers: Want to see how a change affects your mobile app users? It’s as simple as filtering on the
User-Agentheader.
This kind of focused approach lets you run faster, more targeted tests. Instead of boiling the ocean, you can zero in on the exact piece of the application you’ve touched, which makes spotting regressions a whole lot easier.
Safely Manage Replay Speed
Replaying traffic at its original speed is perfect for validating behavior, but what if your staging environment isn’t a perfect clone of production? Maybe it’s not as beefy. If you’re not careful, you could easily overwhelm it and cause the test itself to fail.
This is where rate limiting becomes your best friend.
GoReplay lets you dial the replay speed up or down, either by a percentage or by an absolute number of requests per second. For instance, you could replay traffic at just 25% of its original speed to safely test on smaller hardware.
This granular control ensures your tests are realistic but not destructive. It’s a critical safety mechanism that prevents your pre-production environment from becoming another source of downtime.
On the flip side, you can also crank up the speed to deliberately stress-test your system. It’s a great way to find its breaking point before your users do.
Adapt Traffic with Request Rewriting
Here’s a common headache: traffic captured from production often won’t work out-of-the-box in another environment. Hostnames are different, API endpoints have moved, or authentication tokens are invalid. Request rewriting lets you modify these requests on the fly as they are being replayed, adapting the traffic to fit different configurations.
This capability is essential because the cost of failure is just too high. Across the UK and Europe, manufacturers are projected to lose over £80 billion in 2025 from downtime alone. These aren’t just abstract numbers; they highlight the immense financial pressure to prevent outages, which is what pushes industries toward more robust, data-driven testing methods. You can learn more about these staggering manufacturing downtime costs and their wide-ranging impact.
By being able to adapt your tests to fit any environment, you’re building a far more resilient and reliable validation process.
Of course! Here is the rewritten section, crafted to sound like an experienced human expert, following the specific style and formatting requirements you provided.
Answering Your Top GoReplay Questions
As you start working with traffic replay, you’re bound to run into some practical questions. That’s a good thing—it means you’re thinking about how to get the most out of the tool. Let’s walk through some of the most common things developers and QA engineers ask when they’re getting started.
Will This Slow Down My Production App?
This is usually the first question on everyone’s mind. And for good reason—nobody wants to introduce a tool that hurts performance. The short answer is: it’s almost always a non-issue.
GoReplay was built from the ground up to be incredibly lightweight. It operates by passively listening to network packets at the kernel level, a highly efficient process that barely tickles the CPU. For the vast majority of applications, you simply won’t notice it’s there.
Now, if you’re running a massive system with millions of requests per minute, it’s always smart to keep an eye on CPU and memory when you first deploy the gor listener. It’s just good practice.
A Pro Tip From the Trenches: For high-volume systems where even a tiny bit of overhead is a concern, you can completely isolate the capture process. Run GoReplay on a dedicated network tap or a separate proxy instance. This gives you total peace of mind and guarantees zero impact on your app servers.
How Do You Handle Sensitive Data Like Passwords or PII?
Protecting user data isn’t just a feature; it’s a requirement. This is where GoReplay’s middleware really shines. It’s a powerful feature that lets you modify requests and responses on the fly, either as they’re being captured or replayed.
This is absolutely critical for security and compliance. You can write a quick script to sanitize the traffic before it ever gets saved to a file or forwarded to your staging environment.
For example, your middleware could easily:
- Find an
Authorizationheader and replace its value with a static, dummy token. - Hash or completely nullify a
passwordfield in a JSON payload. - Anonymize personally identifiable information (PII) like email addresses, names, or phone numbers.
This way, you get to test with traffic that mirrors the complexity of real-world patterns without ever touching or exposing confidential user data.
Can I Actually Use This for Performance and Load Testing?
Absolutely. While GoReplay is brilliant for regression and shadow testing, it’s a beast for realistic load testing. In my experience, replaying actual production traffic gives you a far more accurate picture of user behavior than any synthetic load generator ever could.
With the --speed flag, you can easily amplify your traffic to see where the cracks in your application start to show. Replaying traffic at 2x or even 10x the original speed is a fantastic way to find performance bottlenecks and see how your system holds up under pressure. It helps you prepare for those unexpected traffic spikes before they turn into a real-world outage.
Ready to stop worrying about deployments and start releasing with confidence? GoReplay gives you the power to test changes against real production traffic. Download the open-source version or explore our enterprise features today!