Master Record Replay Testing with GoReplay
Record-replay testing is a pretty straightforward, yet powerful, technique. You capture real user traffic from your production environment and then “replay” it against a staging or development server. It’s the difference between testing with a neatly written script and testing with a real, unpredictable crowd.
This approach gives you an incredibly realistic way to validate code changes, run load tests, and find those frustrating bugs that neatly simulated data would never even touch.
Why Record Replay Testing Beats Simulated Data
So, let’s get practical. Why are so many top engineering teams moving to record-replay testing? It’s simple: it closes the gap between sterile test environments and the chaotic, unpredictable nature of real-world user behavior.
Scripted or synthetic tests definitely have their place. But they usually follow the “happy path” and completely miss the weird, unexpected ways actual users interact with your application. By capturing and replaying what’s really happening in production, you get insights that manufactured data can never give you.
It’s especially good for:
- Uncovering Elusive Bugs: It brings those weird, edge-case bugs to the surface—the ones caused by specific, rare user actions or malformed requests you’d never dream of writing a test case for.
- Validating Changes Under Realistic Load: See how a new feature or refactor actually holds up against the true volume and variety of your production traffic, not just an educated guess.
- Reducing Manual Test Creation: Forget spending hours writing meticulous test scripts. You can use real traffic as your ultimate, ever-evolving test suite, saving a ton of development time.
From Personal Experience
I once worked on a critical e-commerce checkout feature where our synthetic tests were all green. Of course, as soon as we deployed, we started seeing intermittent failures that were impossible to reproduce. It was a nightmare.
We used a record-replay tool to capture production traffic, and within hours, we found the culprit: a bug triggered only by a specific sequence of API calls from an outdated mobile app version. Digging through logs would have taken days. With record-replay testing, we found and fixed it in a couple of hours.
This is a big reason why the Recording and Session Replay Tools Market, valued at around USD 1.2 billion, is expected to hit USD 3.5 billion by 2033. If you’re curious, you can dig into the rise of session replay technologies on verifiedmarketreports.com.
This approach fundamentally changes your perspective. You stop asking, “Did my tests pass?” and start asking, “Can my application handle reality?”
Traditional Testing vs Record Replay Testing
To really see the difference, let’s put them side-by-side. Traditional methods have served us well, but they operate on assumptions. Record-replay operates on reality.
| Aspect | Traditional Testing | Record Replay Testing |
|---|---|---|
| Test Approach | Uses pre-written scripts and synthetic data (“happy paths”). | Captures and replays real, live user traffic. |
| Data Realism | Low. Often misses edge cases and real-world complexity. | High. Represents actual user behavior and unexpected inputs. |
| Bug Detection | Good for known issues and regressions. | Excellent for finding elusive, intermittent, and load-related bugs. |
| Effort | High manual effort to write and maintain test scripts. | Low initial setup; traffic becomes the self-maintaining test suite. |
| Load Testing | Simulates load based on estimates and assumptions. | Tests against the true volume and variety of production load. |
The table makes it clear: when you need to be sure your application can handle the chaos of the real world, replaying actual traffic is the way to go.
Throughout this guide, we’ll be using GoReplay. It’s a powerful, open-source tool that lets us capture and replay HTTP traffic with precision, making it a perfect choice for putting this strategy into practice.
Your First Steps Capturing Live Traffic
Diving into record-replay testing with GoReplay is refreshingly practical. The initial setup isn’t some complex, week-long project; you can actually start capturing real traffic streams within minutes. This capture process is the foundation of your entire testing strategy—it gives you the raw, real-world data you need to validate your application.
First things first, you need to get the tool installed. On macOS, a quick Homebrew command does the trick. For Linux, it’s just a matter of downloading the latest binary. Once GoReplay is on your machine, you’re ready to start listening.
The real work happens on the command line. GoReplay’s power comes from its simple yet potent flags that tell it exactly how to listen for and save traffic. For your first capture, two flags are absolutely essential.
--input-raw: This flag tells GoReplay to listen for traffic on a specific network port. You’ll point this directly at the port your application is running on.--output-file: This specifies where to save the captured traffic. GoReplay creates a file containing every single request it sees.
A Practical Capture Scenario
Let’s walk through a common situation. Imagine you have a staging API server running on port 8080. You’re planning a major refactor and want to capture all incoming HTTP requests to build a solid test suite. Your goal is to record a few hours of typical usage to get a realistic dataset.
To make this happen, you’d run GoReplay on the same server (or use port forwarding to access the traffic). The command is clean and direct.
gor --input-raw :8080 --output-file requests.gor
That’s it. This one command instructs GoReplay to start listening on port 8080 and save all the traffic it captures into a file named requests.gor. The tool will keep running and appending requests to this file until you tell it to stop. It’s that straightforward.
This simple workflow—capturing real interactions, replaying them in a test environment, and analyzing the results—is the core of record-replay testing.
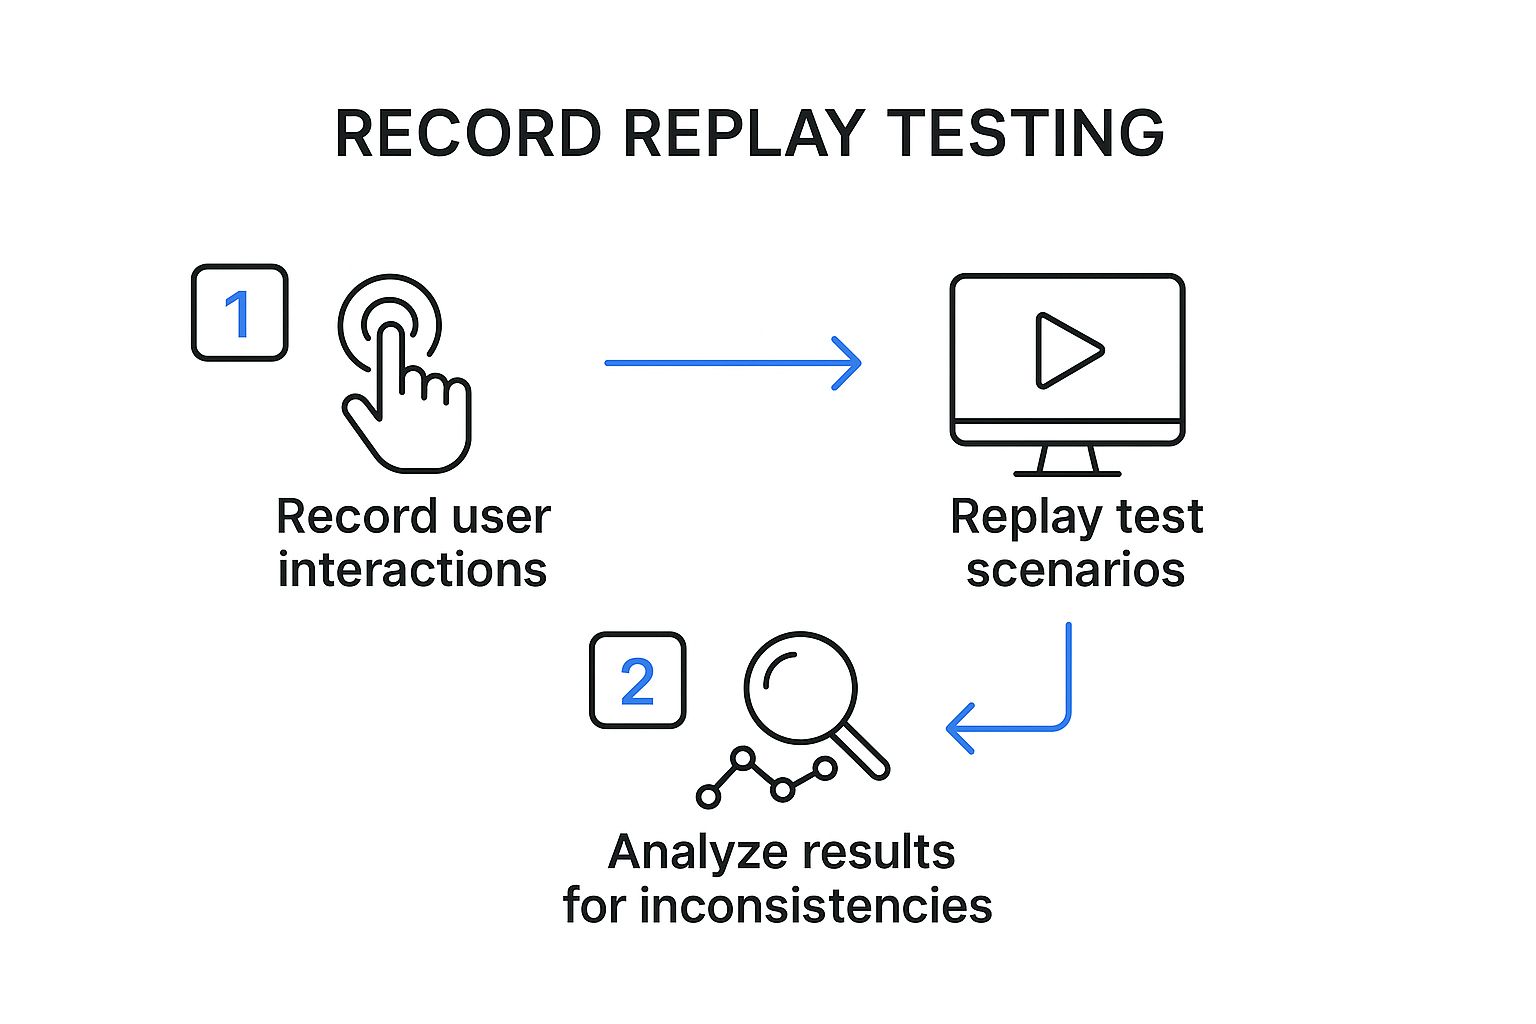
As you can see, the process breaks down into three core actions: recording, replaying, and analyzing. It’s a powerful loop for validating changes with confidence.
Choosing Your Installation Method
Depending on your OS, the installation path will differ slightly. Both are designed to be fast, so you can get to the important part: capturing traffic.
For macOS users with Homebrew:
brew install goreplay
This is hands-down the easiest method for Mac developers. It handles dependencies and path configurations for you automatically.
For Linux users:
- Download the latest release binary from the GoReplay website.
- Unpack the archive.
- Move the
gorexecutable to your system’s path, like/usr/local/bin.
Once it’s installed, a quick gor --version will confirm everything is working. This tells you the gor executable is in your system’s PATH and ready for action.
With these first steps done, you’ve successfully captured a slice of real-world user behavior. This is the most critical asset for effective record-replay testing, and you’re now ready to use this data for some powerful and realistic testing.
Replaying Traffic Against Your Test Environment

Okay, so you’ve captured a file brimming with real user requests. This is where the magic of record replay testing really begins—by unleashing that authentic traffic stream against a safe, isolated test environment. This is the moment of truth for your application.
We’ll be using the goreplay command again, but this time, we’re flipping the script. Instead of listening for traffic, we’ll be the ones sending it. The command structure is pretty intuitive; you’re essentially just telling GoReplay to read from your file and fire the requests at a specific HTTP endpoint.
Configuring Your First Replay
To get started, you really only need two flags: --input-file and --output-http. These simply tell GoReplay where to find the recorded traffic and where it should go.
Let’s say you have a development server running locally. You can point your saved requests.gor file at it with one simple command.
gor --input-file requests.gor --output-http "http://localhost:3000"
This command works through your saved file, replaying each request against your local server. It’s a direct and powerful way to see how your latest code changes stand up to real-world user behavior in a completely controlled setting.
Here’s a critical piece of advice from years of experience: never, ever replay traffic directly against a live production environment. The potential for disaster—from corrupting data to accidentally triggering payments or sending a flood of emails—is just too high. Always aim your replay traffic at a staging, UAT, or local development server that’s safely sandboxed.
Controlling the Flow of Traffic
Sometimes, replaying traffic at its original speed can absolutely hammer a test environment that doesn’t have the same muscle as your production cluster. Thankfully, GoReplay has a built-in solution for this: rate limiting.
This feature gives you granular control over the replay speed, which is incredibly useful for a few reasons:
- Gradual Load Testing: You can start slow and ramp up the request rate to pinpoint your application’s breaking point.
- Resource Management: It stops you from overwhelming a test server with fewer resources than its production counterpart.
- Simulating Different Conditions: You can easily model everything from a slow trickle of users to a sudden, massive traffic spike.
For example, to cap the replay at 10 requests per second, you just add the --output-http-rate-limit flag:
gor --input-file requests.gor --output-http "http://localhost:3000" --output-http-rate-limit 10
This level of control transforms a basic replay into a flexible and realistic load test. It helps you build a much deeper understanding of your application’s performance. For a more in-depth look, check out our guide on how to replay production traffic for realistic load testing.
This kind of methodical testing is part of a much bigger industry shift. The Continuous Testing Market, which was valued at USD 2.44 billion in 2025, is on track to hit USD 3 billion by 2030, all driven by the demand for more rigorous quality assurance. By integrating record-replay into your workflow, you’re not just fixing bugs—you’re aligning with the future of software development.
Once you’ve got the hang of a basic capture and replay, it’s time to dig into the features that really make GoReplay powerful. Moving beyond the basics is what elevates a simple smoke test into a serious, automated quality assurance process. This is where you gain the fine-grained control needed to tackle complex testing scenarios, maintain security compliance, and integrate seamlessly with your CI/CD pipeline.
The real magic of record-replay testing isn’t just about mirroring traffic—it’s about shaping it to fit exactly what you need to test. Instead of just blasting an entire capture file at your staging environment, you can filter it down to isolate only the requests that matter. This is a game-changer when you’re working on a single new feature or trying to hunt down a bug in a specific API endpoint.
Fine-Tuning Your Replay with Traffic Filtering
Let’s say you’re in the middle of refactoring the /api/v2/users endpoint. Do you really need to replay thousands of unrelated requests hitting other parts of your application? Of course not. It’s just noise. GoReplay lets you cut right through it with surgical precision.
You can use the --http-allow-url flag to tell GoReplay to only replay requests that match a specific URL pattern.
gor --input-file requests.gor --output-http "http://localhost:3000" --http-allow-url /api/v2/users
With this one command, you’re filtering your entire requests.gor file and sending only the requests containing /api/v2/users to your test server. It’s a simple tweak that makes your tests incredibly focused and efficient, giving you a clear signal on the health of the component you actually care about.
On the flip side, you might want to exclude certain endpoints. Maybe you want to avoid replaying logout requests that would kill user sessions during a long test run. The --http-disallow-url flag has you covered.
Prioritizing Security and Privacy
A huge concern when working with production traffic is handling sensitive data. You have to be absolutely certain that private user information, like authorization tokens or personal details, never leaks into your test environments or logs. This isn’t just a “nice-to-have”—it’s a critical security requirement.
GoReplay provides powerful flags to strip this data out before it ever gets replayed. The --http-disallow-header flag is perfect for this.
For example, you can strip the Authorization header from every single replayed request:
gor --input-file requests.gor --output-http "http://localhost:3000" --http-disallow-header "Authorization"
This simple addition ensures no authentication tokens are ever sent to your staging environment, closing a major security hole. You can use this flag multiple times to scrub other headers too, like Cookie or custom session tokens, making your record-replay testing both effective and responsible.
Key Takeaway: Filtering and modifying traffic isn’t an advanced trick; it’s a core practice for efficient and secure testing. It lets you protect user privacy while isolating the exact interactions you need to validate.
On-the-Fly Traffic Modification with Middleware
Sometimes, just filtering traffic isn’t enough. You might need to actively rewrite requests or responses as they fly by. This is super useful for A/B testing, migrating between API versions, or redirecting traffic as part of a larger service architecture change. This is where GoReplay’s middleware capabilities truly shine.
Middleware lets you run a script or a small program against each request that GoReplay processes. This script can inspect the request, change its headers or body on the fly, and then pass it along.
Imagine you need to test a new /api/v2 with traffic from the old /api/v1. You could write a simple middleware script to rewrite the URL for every request, giving you a perfect, real-world test load for your new API version. This technique offers almost limitless flexibility for complex scenarios. The use of such tools for deep analysis is growing, and you can learn more about the expanding session replay tools market on openpr.com.
How to Analyze Replay Results for Actionable Insights

Running a record replay testing cycle is only half the battle. The real value comes from digging into the results and turning that raw output into concrete improvements.
Once the replay finishes, your job shifts to that of a detective. You need to piece together clues from different sources to truly understand how your application behaves under realistic stress. This analysis is what separates a risky deployment from a confident one.
Your first stop should always be the application logs. During a replay, these logs become a goldmine. Look for any unusual spikes in error messages, warnings, or stack traces that line up with the timing of your test. A sudden flood of exceptions that wasn’t there before a code change is a massive red flag.
Monitoring Key Performance Metrics
Beyond the logs, you have to watch your server’s vital signs. Monitoring key metrics during the replay gives you a clear, objective picture of your system’s health. Without this data, you’re flying blind, completely unable to spot resource-related regressions that could easily bring down your production environment.
I always keep a close eye on these core indicators:
- CPU Utilization: Did CPU usage suddenly jump and stay high compared to your baseline test? This could point to an inefficient new algorithm or, worse, an infinite loop.
- Memory Consumption: Watch out for memory leaks. If memory usage just keeps climbing throughout the entire replay and never drops back down, you likely have a problem that needs immediate attention.
- Response Times: Are your API endpoints getting sluggish? You need to track both the average and 99th percentile response times to catch performance degradations before they frustrate your users.
By establishing a performance baseline from your very first replay, you make it incredibly easy to spot any negative changes in later tests. This methodical approach is a cornerstone of effective record replay testing, helping you squash performance bugs before they ever see the light of day.
A critical insight comes from comparing HTTP status codes. If you see a jump in 5xx server errors or 4xx client errors during a replay, it’s a direct signal that your recent changes have introduced instability.
Using Diffs to Pinpoint Regressions
One of GoReplay’s most powerful features is its ability to “diff” the responses between two different application versions. This is where the magic happens.
You can replay the exact same traffic against your old, stable version and your new, unreleased version, then compare the output. GoReplay will highlight any differences in response bodies or headers. This is incredibly effective for finding those sneaky bugs where the application still returns a 200 OK status, but the data it sends back is completely wrong.
This kind of deep analysis does more than just help you hunt bugs; it fundamentally boosts your overall testing accuracy. For a closer look at this concept, you can learn more about how traffic replay improves load testing accuracy in our detailed guide. By consistently turning test results into actionable insights, you build a robust safety net for every single release.
When you start digging into record-replay testing, a few practical questions almost always surface. It’s one thing to talk about the theory, but moving to a real-world implementation brings up important things to think about, like data privacy, system performance, and where this all fits in your current dev cycle.
Let’s tackle these common hurdles head-on.
One of the first things I hear is, “What about the performance overhead of capturing live traffic?” It’s a fair question. You’re running a listener on a live server, and of course, that will use some resources.
But tools like GoReplay are built to be incredibly lightweight. From what I’ve seen, the impact is usually less than 1-2% in CPU and memory load. Honestly, it’s a tiny price to pay for capturing priceless, real-world test data that you just can’t fake.
How Do I Handle Sensitive User Data?
This is the big one. You absolutely cannot have sensitive info like passwords, API keys, or personal user data getting stored or replayed. A solid record-replay testing workflow isn’t just about finding bugs; it has to be secure from the ground up.
The best way to handle this is to scrub the data right at the source. Before traffic even gets written to a file, you should use features like GoReplay’s --http-disallow-header or custom middleware to strip out or anonymize anything sensitive.
- Filter
Authorizationheaders: This is non-negotiable. It prevents auth tokens from ever being leaked. - Remove
Cookieheaders: Keep session data out of your captures. - Rewrite request bodies: You can anonymize user information like names, emails, and addresses on the fly.
The golden rule here is simple: treat your captured traffic with the same level of security as your production database. If you wouldn’t log it, don’t record it without sanitizing it first.
Where Does This Fit in My CI/CD Pipeline?
This is where record-replay testing truly shines. By plugging it into your CI/CD pipeline, you turn it from a one-off manual task into a powerful, automated quality gate that protects every single code change.
A typical workflow might look something like this:
- A developer pushes a change, which triggers a new build.
- Your CI pipeline automatically deploys that build to a dedicated staging or testing environment.
- A script then kicks off GoReplay, which replays a pre-sanitized capture file against the new deployment.
- The script watches the results, looking for any new 5xx errors or a sudden drop in performance.
- If the tests pass, the build gets the green light. If they fail, the pipeline halts, stopping a bad deployment in its tracks.
This kind of automated feedback loop gives your team incredible confidence. You know that every release has been battle-tested against real-world conditions before it ever gets near a customer.
Ready to stop guessing and start testing with real-world traffic? Get the confidence you need for every deployment with GoReplay. Discover how our open-source tool can transform your testing process at https://goreplay.org.