The Power of Real Time Analytics Dashboards
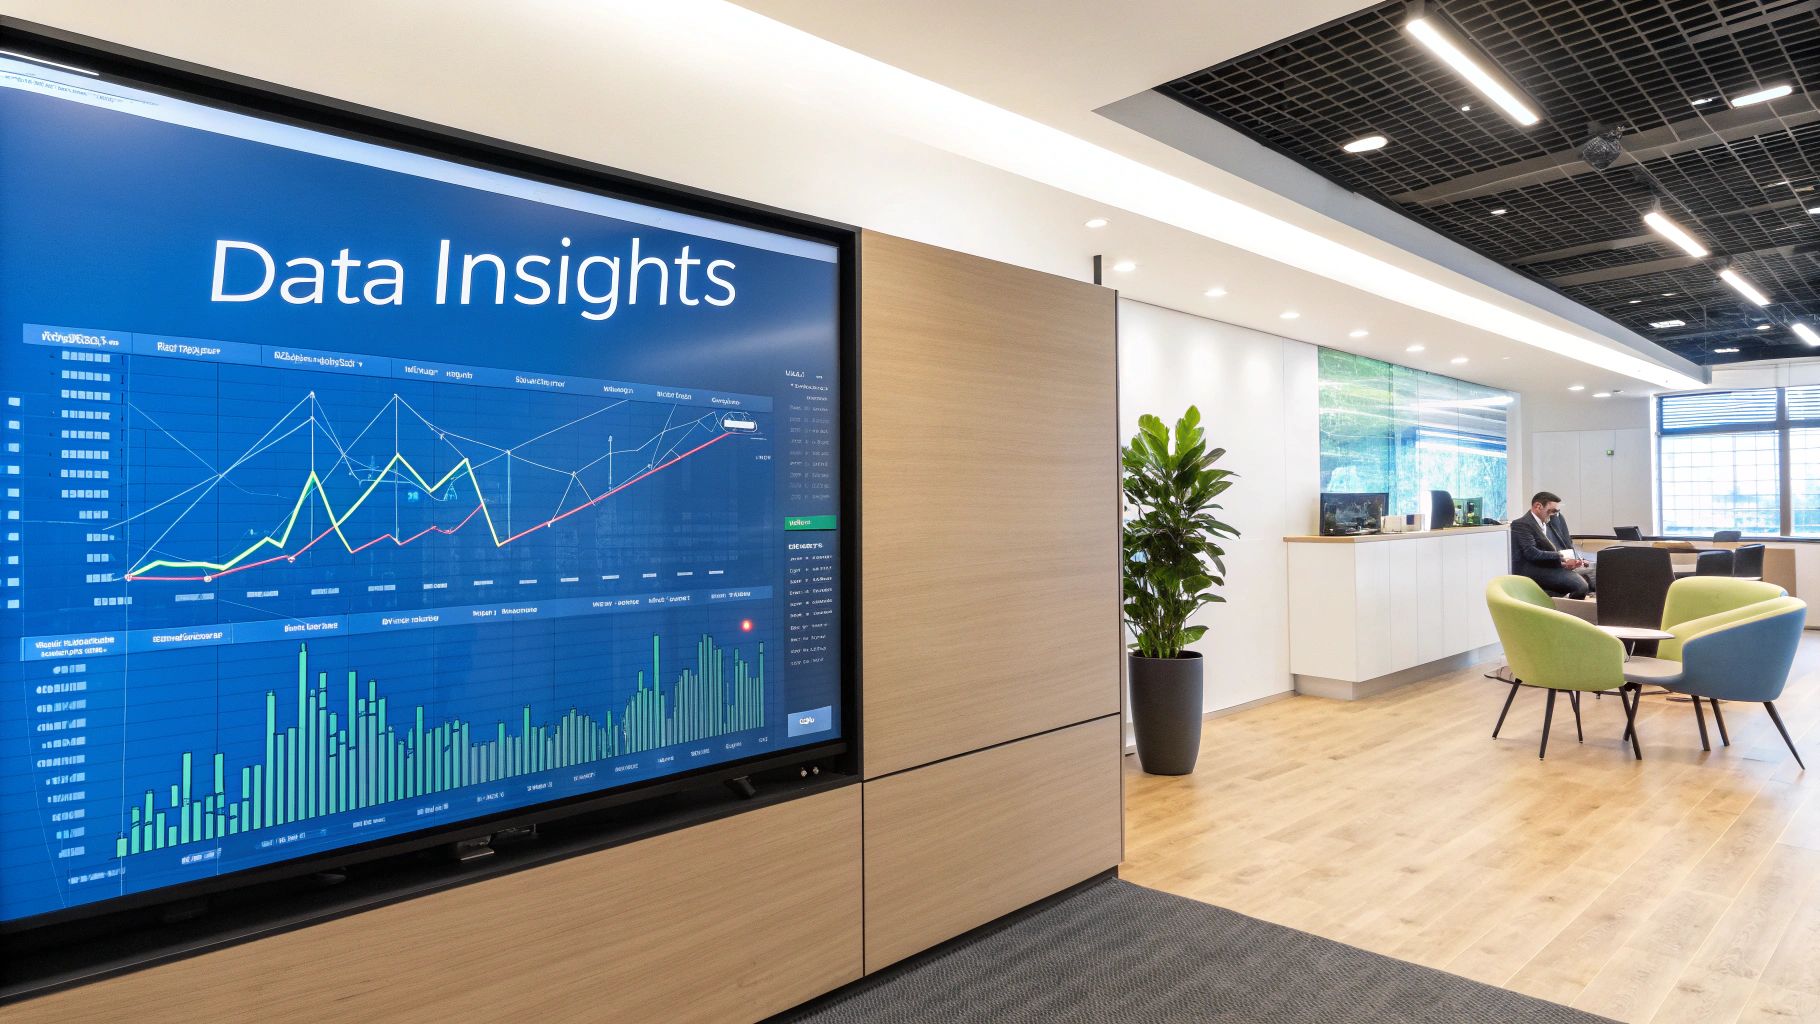
Real-time analytics dashboards help business leaders make smart decisions faster by turning data into clear insights instantly. These tools display key metrics and trends as they happen, giving companies an edge that basic reports can’t match.
Why Real-Time Matters
Monthly or weekly reports often arrive too late to be useful. By the time decision-makers see the data, the opportunity has passed. A real-time dashboard solves this by showing what’s happening right now. For example, when running a flash sale, retailers can watch purchases happen live and quickly adjust prices or stock levels based on customer behavior.
From Insight to Action
The real power comes from seeing data clearly and acting on it immediately. Visual displays make it easy to spot important patterns and unusual events at a glance. In customer service settings, managers can see spikes in support tickets and move staff to handle high-volume channels right away. Learn more about using real-time analytics in customer support from Zendesk’s detailed guide.
Real-World Applications
Many industries rely on real-time dashboards for daily operations. Factory managers track production lines to fix bottlenecks quickly and keep efficiency high. Stock traders monitor market changes to make split-second buying decisions. The flexibility of these tools lets each business customize views for their specific goals.
Key Benefits of Real-Time Dashboards
- Better Decisions: See what’s happening now to choose the best action
- Smoother Operations: Fix problems as soon as they appear
- Higher Sales: Spot and act on sales opportunities quickly
- Happier Customers: Respond to customer needs in the moment
- Market Leadership: Stay ahead by moving faster than competitors
Real-time dashboards do more than just show numbers - they help businesses take action right away. Teams can solve problems faster, grab opportunities sooner, and stay ahead of changes in their market. Quick access to current data has become essential for success in most industries.
Building Your Real Time Analytics Engine
Creating an effective real-time analytics dashboard requires careful planning and selection of technologies that can process data instantly. Let’s explore the key components and considerations for building a system that delivers immediate insights.
Let’s first compare the architectural differences between real-time and traditional analytics systems:
| Component | Real-Time Analytics | Traditional Analytics |
|---|---|---|
| Data Processing | Continuous streaming | Batch processing |
| Latency | Milliseconds to seconds | Hours to days |
| Storage | In-memory + disk | Primarily disk-based |
| Query Speed | Sub-second | Minutes to hours |
| Data Freshness | Live data | Historical data |
| Scalability | Horizontal auto-scaling | Manual scaling |
Core System Components
A real-time analytics system needs these essential elements working together:
- Data Ingestion Layer: Collects incoming data from websites, apps, sensors, and transactions
- Stream Processing Engine: Cleans and transforms data using tools like Apache Kafka and Apache Flink
- Real-Time Database: Optimized for rapid reads/writes of streaming data
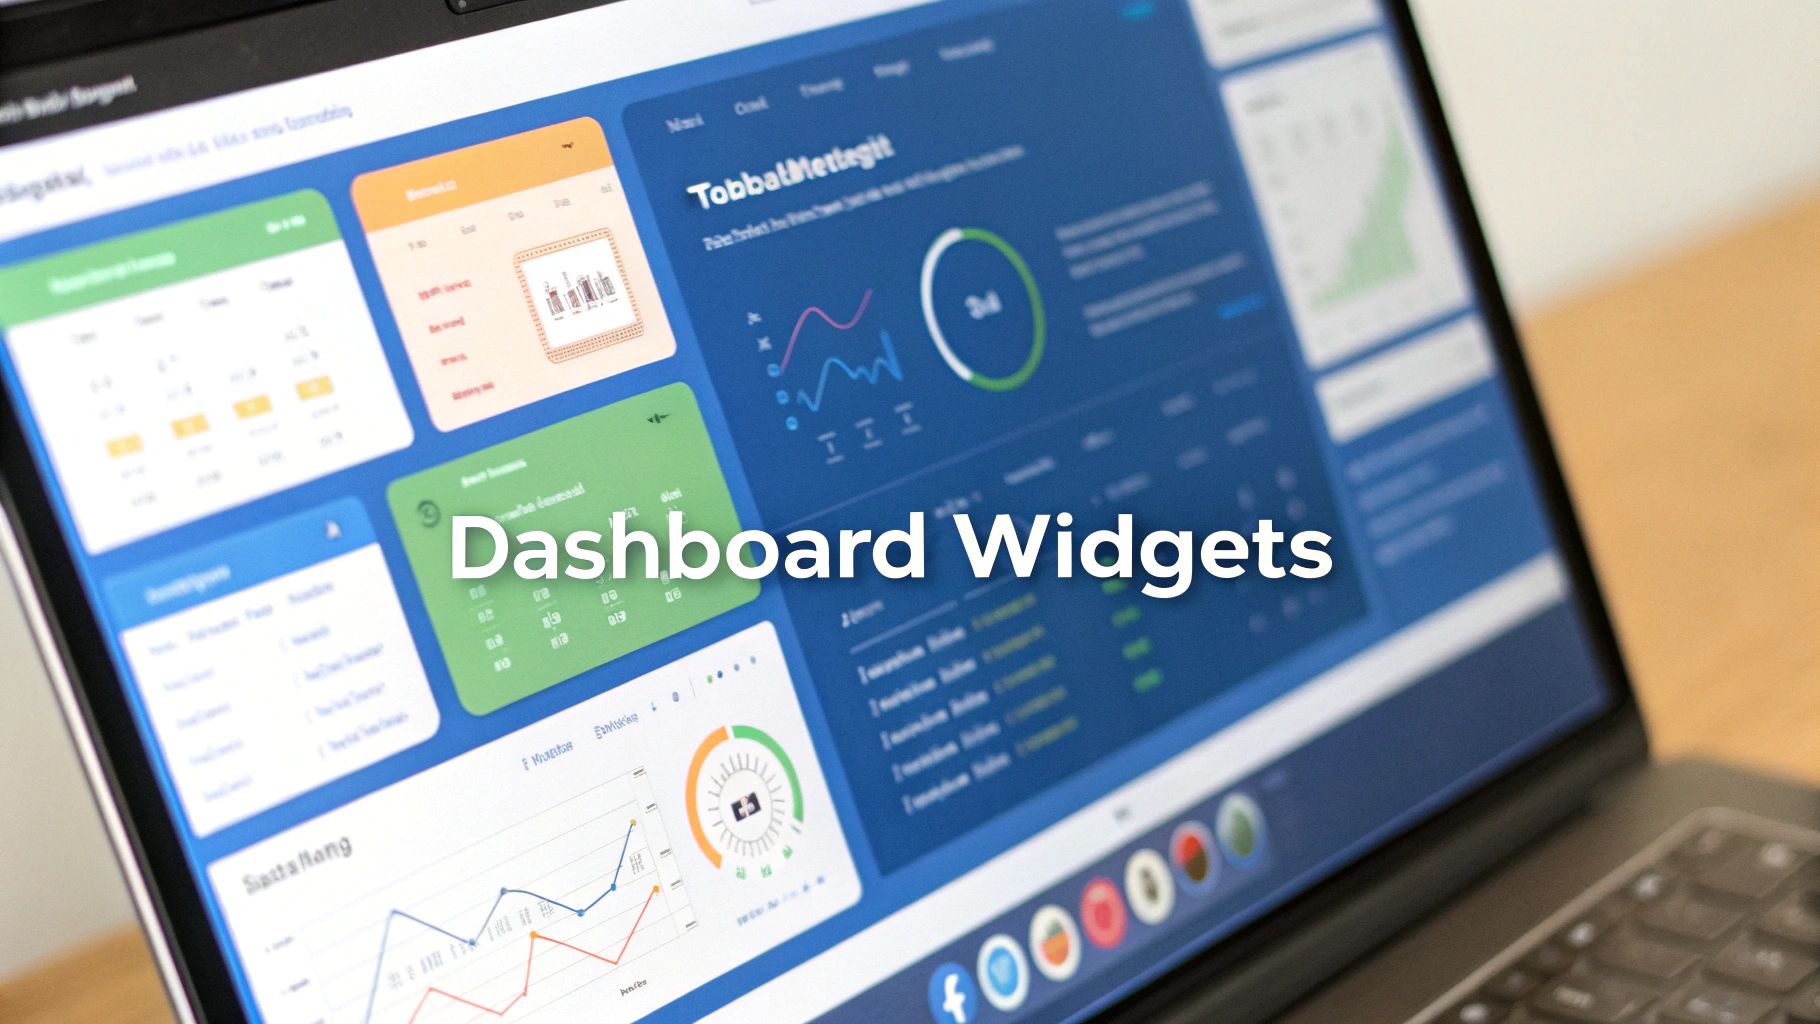
- Visualization Dashboard: Presents analyzed data in clear, actionable formats
For high-performance analytics, many teams use specialized databases like Apache Druid that excel at processing large data streams. Learn more about real-time analytics architecture here. You may also find this guide helpful: How to master load testing your APIs.
Managing Large Data Volumes
To handle massive real-time data streams effectively:
- Use Smart Sampling: Analyze representative data subsets to reduce processing needs
- Balance Server Loads: Spread work across multiple servers to prevent bottlenecks
- Aggregate Strategically: Summarize data at different levels while keeping detail access
Selecting Technologies
When choosing tools for your analytics engine, evaluate:
- Growth Capacity: Will it scale as your data and users increase?
- Speed Requirements: Does it meet your latency needs?
- System Compatibility: How well does it work with your current stack?
- Budget Impact: What are the full costs versus expected benefits?
Building with these factors in mind helps create an analytics system that delivers quick, actionable insights. This enables faster, data-backed decisions that improve operations and market position.
Success Stories That Drive Results
Real-time analytics dashboards are helping businesses get better results by providing instant visibility into their operations. Let’s look at some specific examples that show how organizations used real-time data to achieve measurable improvements.
Enhanced Customer Experiences
An online retailer used their analytics dashboard to closely monitor a major sales event. By tracking metrics like page load speeds, sales conversions, and cart abandonment in real-time, they quickly fixed performance issues as they arose. This quick response helped them avoid lost sales and keep customers happy, resulting in a 20% boost in revenue during the event.
Optimizing Operational Efficiency
A manufacturing company put real-time monitoring in place for their production lines. Their dashboard tracked key metrics like output, downtime periods, and defect rates. This allowed supervisors to immediately spot and fix problems, leading to 15% less downtime and 10% higher productivity. The Kaltura dashboard offers another great example - it shows live video streaming stats like active users, engagement, and technical performance metrics.
Driving Data-Informed Decisions
A logistics company used their real-time dashboard to watch shipment status, delivery timing, and transport costs. This helped them make routes more efficient, spot potential delays early, and adjust their resources as needed. The result? They cut transportation costs by 12% and improved on-time deliveries by 5%. Want to see more examples? Check out these detailed case studies.
Building a Culture of Data-Driven Action
Getting value from a real-time dashboard isn’t just about the technology - it’s about helping people use data effectively in their daily work. Successful companies make sure employees:
- Have easy access to the dashboard
- Get regular training on using the data
- Work together across teams to act on insights
This approach helps the whole organization respond quickly to changes and hit their goals.
Measuring the ROI of Real-Time Analytics
To show the value of real-time analytics, companies track specific metrics that matter to their business:
- Revenue growth
- Cost reductions
- Customer satisfaction scores
- Operational efficiency gains
By measuring these concrete results, they can prove the impact of their analytics investment and make the case for further improvements. These success stories show that real-time analytics has become essential for staying competitive and growing the business.
Elevating Customer Experience With Live Data
Real-time analytics dashboards do much more than just support internal teams - they’re essential tools for creating outstanding customer experiences. By surfacing insights immediately, companies can craft personalized interactions, spot potential issues early, and exceed customer expectations. The results? Better satisfaction scores, stronger loyalty, and real business growth.
Creating Personal Customer Journeys
Live data helps businesses understand exactly what customers are doing right now. This immediate insight allows companies to suggest relevant products, make timely offers, and deliver content that matches each person’s interests. For instance, when someone browses an online store, they receive suggestions based on their current shopping activity - making their experience feel more natural and engaging.
Spotting Customer Needs Early
By combining real-time monitoring with smart prediction tools, businesses can identify what customers need before they ask. Looking at past behavior patterns alongside current activity reveals likely future actions, letting companies step in with helpful solutions at just the right time. A phone company might notice usage changes that suggest a customer might leave, then reach out with a better plan option. Want to learn more about making dashboards work harder? Check out this analysis on real-time dashboard effectiveness.
Quick Problem Solving
Real-time dashboards help catch and fix problems fast. By watching key metrics like website performance, app stability, and support team activity, companies spot issues before they affect many customers. If website traffic suddenly drops, the dashboard alerts IT teams immediately so they can investigate and resolve the problem, keeping disruption minimal.
Tracking Customer Happiness
Direct customer feedback tools like chat features and quick surveys provide clear signals about how people feel. This immediate input helps improve products and services continuously. Real-time tracking of satisfaction scores shows exactly how changes affect customer happiness, making it easier to adjust course when needed.
Building Customer Trust Through Data
Giving customers access to their own data through personal dashboards builds confidence and strengthens relationships. Take fitness apps - they show users their daily activity, progress toward goals, and personalized tips. This kind of direct engagement keeps people connected to the product and encourages long-term use. When companies use real-time insights well, they create experiences that keep customers coming back.
Mastering Historical and Real Time Integration
Combining real-time analytics with historical data helps teams make well-informed decisions based on both immediate signals and long-term patterns. When integrated thoughtfully, these two data types give teams a complete view of both current operations and broader market context.
Balancing Immediate and Long-Term Insights
To make this integration work, teams need to carefully weigh real-time alerts against historical context. While real-time data helps spot immediate issues like traffic spikes that could indicate successful campaigns or server problems, historical data reveals if these patterns are normal or noteworthy. As explained in this guide to real-time and historical data analysis, businesses use both types - real-time for quick responses and historical for planning.
Maintaining Data Consistency Across Time
Data consistency is crucial when combining different data streams. Teams need clear rules around data formats, collection methods, and storage to avoid discrepancies that could make analysis unreliable. Good data governance includes standard formats, validation checks, and quality controls that apply equally to both real-time and historical information.
Implementing Effective Data Retention Policies
Smart data retention balances storage costs against analytical needs. While keeping too much historical data gets expensive and unwieldy, keeping too little limits trend analysis. The best retention policies consider:
- Regulatory requirements
- Business needs
- Data’s long-term analytical value
- Storage tier optimization
Examples of Integrated Dashboards in Action
Well-designed dashboards blend historical trends with live updates seamlessly. For example, a retail dashboard might show today’s sales next to previous years’ numbers, helping managers quickly gauge performance. Similarly, a manufacturing dashboard could combine current machine metrics with maintenance history to predict and prevent breakdowns.
Key Metrics Tracking Framework
The table below outlines essential metrics to track across both timeframes:
| Metric Category | Real-Time Tracking | Historical Analysis |
|---|---|---|
| Website Traffic | Page views, bounce rate, conversion rate | Traffic sources, user demographics, seasonal trends |
| Sales Performance | Transactions, revenue, average order value | Sales growth, product performance, customer segments |
| Marketing Effectiveness | Click-through rates, social media engagement | Campaign ROI, customer acquisition cost |
| Operational Efficiency | Production output, error rates, downtime | Bottleneck identification, process optimization |
By thoughtfully combining historical and real-time data analysis, teams can spot emerging opportunities while maintaining strategic focus. This balanced approach leads to both better daily decisions and long-term planning.
The Future of Real Time Analytics

The world of real-time analytics dashboards continues to grow, powered by Artificial Intelligence (AI) and Machine Learning (ML). These technologies deliver real improvements in data processing and visualization, helping companies make faster, better decisions. Most importantly, they enable businesses to spot emerging trends and quickly adapt their strategies.
AI-Powered Predictive Analytics
Modern AI systems can process huge amounts of data to spot patterns and forecast outcomes. This means real-time dashboards now show both current data and likely future scenarios. Take a retail store - it can now predict exactly what inventory it needs by combining live sales data with past trends and outside factors like upcoming weather conditions.
Enhanced Data Visualization Through Machine Learning
ML algorithms make it easier to spot key insights by automatically highlighting important data points and creating clear visualizations. Users no longer need complex manual setup - they can quickly understand data relationships at a glance. The system even customizes dashboard views based on each person’s role and needs.
The Rise of Automated Anomaly Detection
AI-powered anomaly detection helps companies instantly spot unusual patterns in their data streams. This adds essential protection against fraud and security issues while ensuring smooth operations. For example, banks can immediately flag suspicious transactions to prevent losses. This extra layer of monitoring helps companies manage risks more effectively.
Adapting to the Evolving Landscape of Real-Time Analytics
To stay ahead, companies should focus on:
- Picking the right tools: Choose technologies that fit your specific needs and existing systems
- Building team skills: Help your staff learn to work effectively with AI and ML tools
- Maintaining data quality: Ensure your data stays accurate, reliable and secure
- Making it user-friendly: Create simple, clear dashboards that lead to action
Building a Future-Ready Analytics Strategy
A strong real-time analytics approach helps companies spot opportunities early, run smoother operations, and keep customers happy. The key is moving beyond just reacting to events - successful companies now use data to shape what comes next. By focusing on quality data, skilled teams, and the right tools, businesses can turn real-time insights into real advantages.
Ready to enhance your testing and development process with real-time insights from actual user traffic? Explore GoReplay, the open-source tool that captures and replays live HTTP traffic for effective testing. Learn more about GoReplay and its powerful features.