
10 Performance Testing Tools for ReactJS
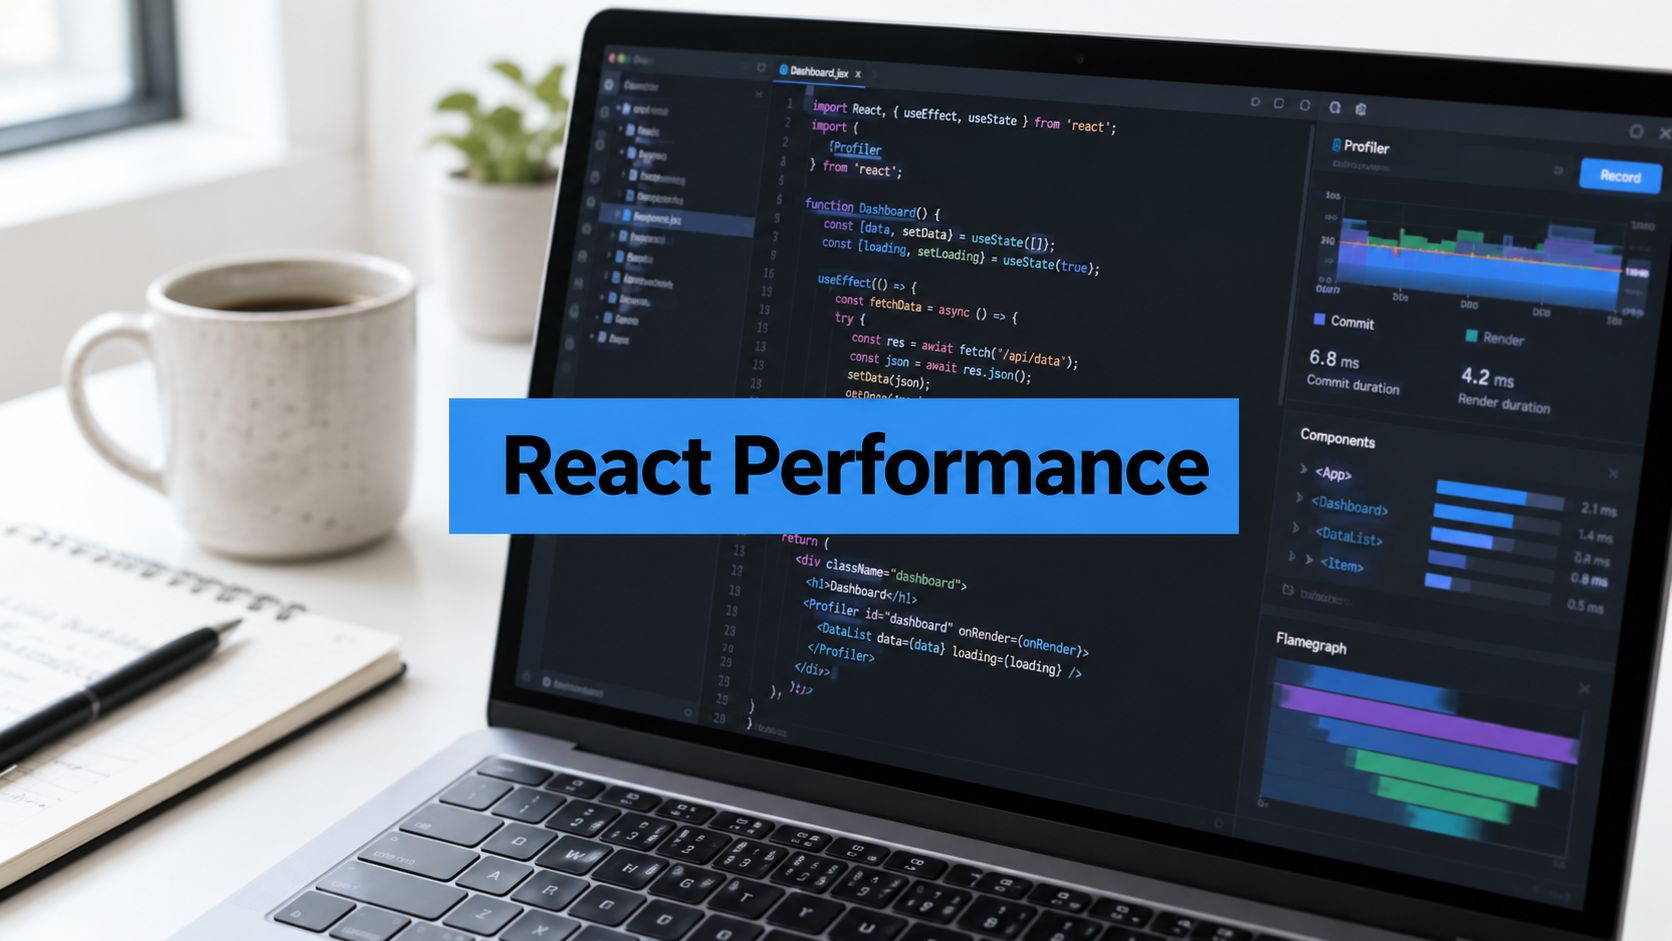
A slow React app rarely has a single cause, so it won’t have a single useful score. A Lighthouse result can show that a route loads slowly in a controlled lab, but it won’t explain which component blocks the main thread. A browser trace can expose a wasted re-render, but it can’t tell you whether your API tier will survive a traffic spike. Real-user monitoring adds field evidence, while API load tests, browser load tests, and production-traffic replay answer different capacity and realism questions.
The practical choice is to define the question first. Are you diagnosing browser work, comparing route transitions under repeatable conditions, measuring backend capacity, observing real users, or replaying the request diversity your application already receives? The tools below are compared by diagnostic depth, realism, repeatability, CI fit, operational effort, and cost considerations.
This layered approach matters because React performance sits across client rendering, network behavior, API waterfalls, long tasks, route changes, and infrastructure capacity. The modern ecosystem also has broad adoption of component testing, with npm telemetry reporting 43.7 million downloads for @testing-library/react and a 173% change over 12 months in the cited ecosystem overview (React testing and performance tooling context). Component correctness is valuable, but it doesn’t replace performance evidence.
For teams evaluating broader web app development tools in 2026, the same principle applies: choose the evidence before choosing the product. When synthetic scripts can’t represent production request diversity, GoReplay is the option in this list built around captured HTTP traffic and controlled replay.
1. GoReplay
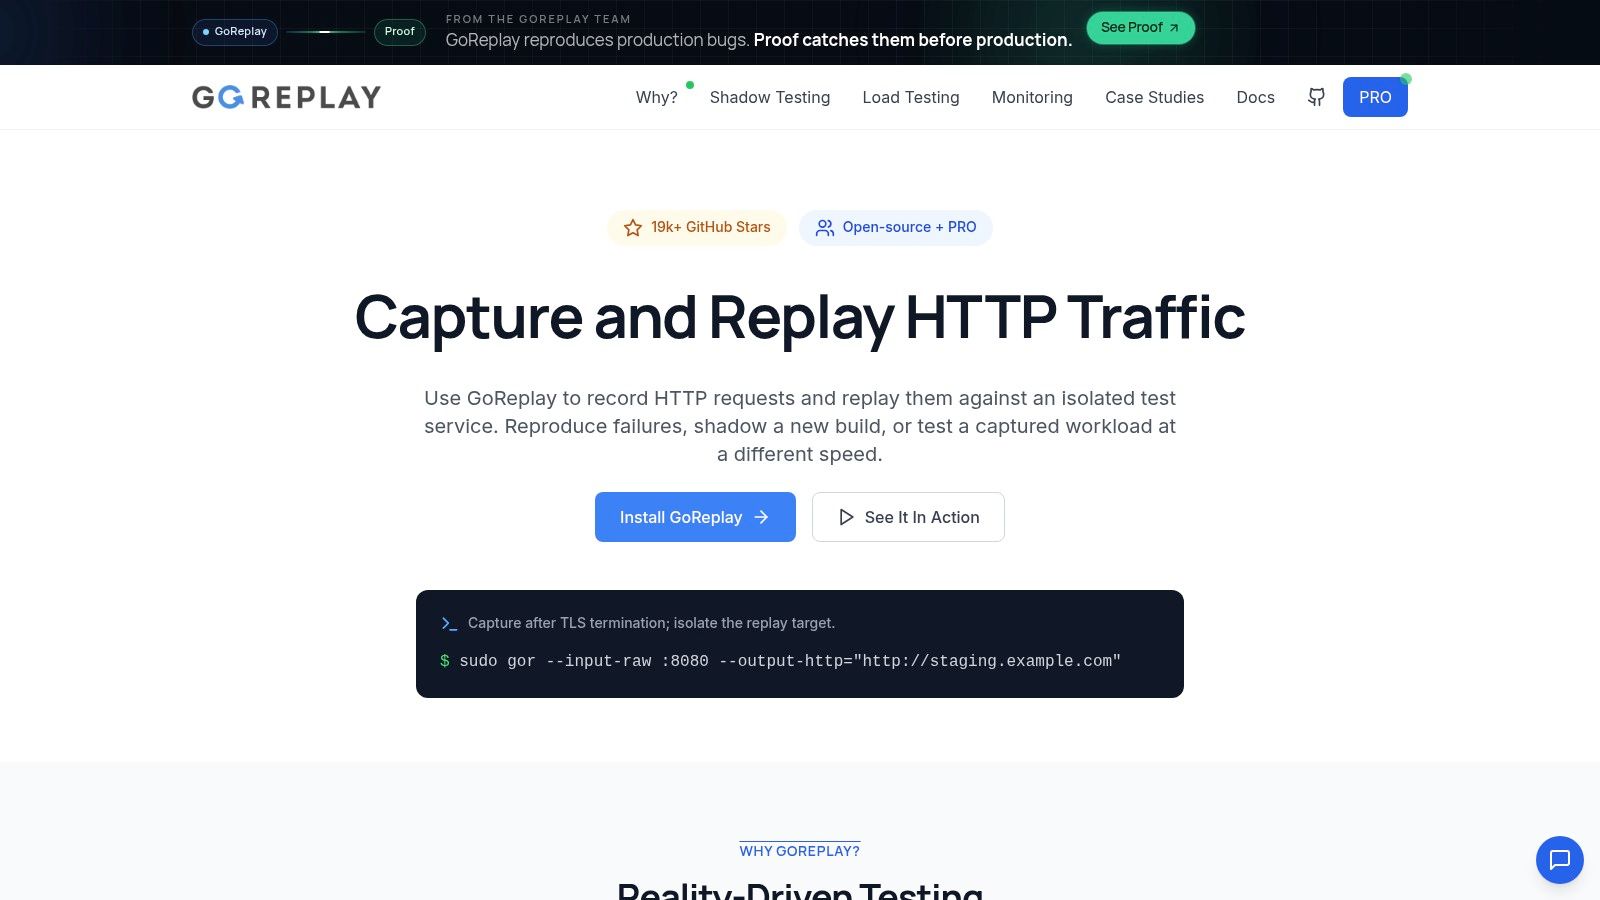
GoReplay answers a question synthetic testing often can’t: what happens when this React-backed system receives traffic shaped like real users and real clients? It captures HTTP traffic and replays it against an isolated environment, letting engineering teams test a new build without sending users into an unproven release.
That makes it particularly useful for React applications with varied route behavior, authenticated API calls, search requests, personalized responses, and background activity. A synthetic browser script might exercise a carefully chosen checkout or dashboard path. GoReplay can expose the less obvious request mix around that path, including endpoints that a test author didn’t know were important.
The open-source edition provides a practical starting point for HTTP capture, filtering, replay, and command-line workflows. The commercial PRO edition adds capabilities such as S3-backed traffic storage, session-aware TCP recognition, TLS-aware capture workflows, data masking, and dedicated support. Teams should confirm current licensing and feature availability on the GoReplay website, because product details can change.
Where replay beats synthetic load
GoReplay supports shadow testing, controlled-speed workload replay, debugging with filtered or rewritten requests, and validation of responses and application state. Those modes help separate questions that teams often mix together:
- Reproduce a production issue: Filter the relevant requests and replay them against the suspected build.
- Test migration risk: Mirror or replay traffic against a replacement service before changing the live route.
- Exercise backend capacity: Increase replay speed in a controlled environment and observe latency, errors, saturation, and resource limits.
- Protect sensitive data: Apply masking and establish a capture point after TLS termination, with compliance controls around stored traffic.
The operational trade-off is substantial. Capture needs to happen where traffic is available in plaintext, often after TLS termination, and production data requires deliberate masking and access controls. Session-aware replay and advanced storage can also require the paid edition. Teams evaluating the method should read how traffic replay improves load-testing accuracy before treating replay as a drop-in replacement for browser testing.
Practical rule: Use GoReplay when request diversity and production realism matter more than a perfectly controlled script. Use synthetic tests when you need stable, repeatable journeys or when the production traffic pattern doesn’t exist yet.
2. Google Lighthouse
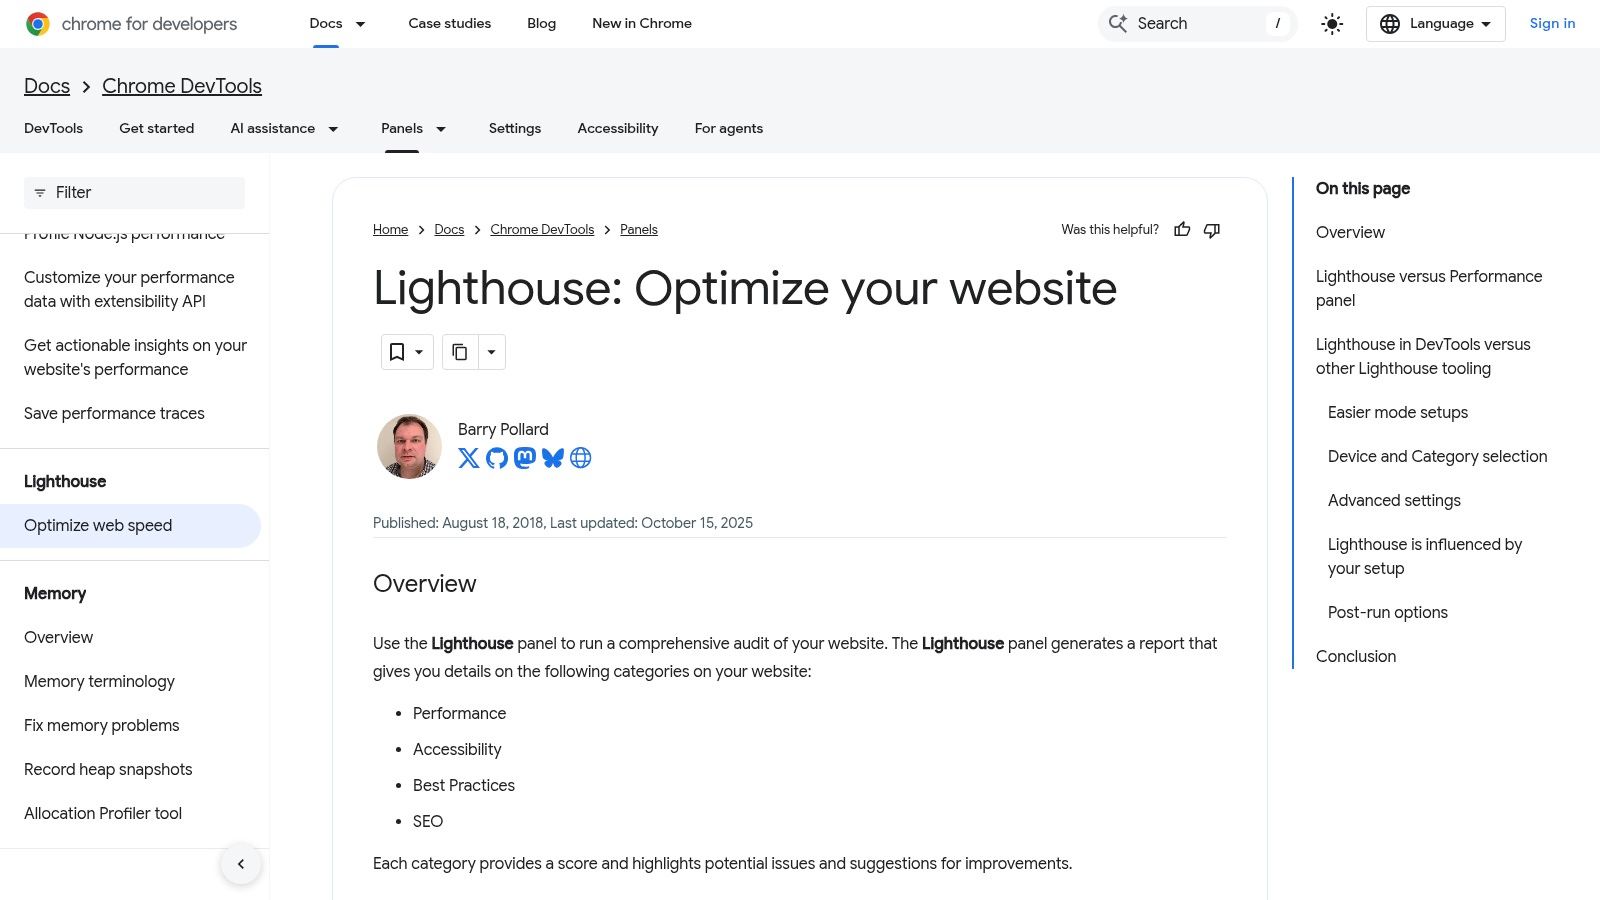
Google Lighthouse answers the route-level lab question: does this React page or deployment show a repeatable loading problem under a defined browser simulation? It runs in Chrome DevTools, from the command line, in CI, and through PageSpeed Insights, which makes it easy to place near a deployment workflow. The Lighthouse documentation covers its audit and trace output.
For React teams, the strongest use is not the headline score. Run Lighthouse against important routes, inspect the trace, and turn meaningful opportunities into release checks. A landing page, authenticated dashboard, search route, and detail view can each have different JavaScript, data-fetching, and rendering costs.
Lighthouse audits performance alongside accessibility, SEO, and best practices. Its performance guidance is closely associated with Core Web Vitals, and its screenshots and trace data help show the order in which resources and visible content arrive.
What it reveals and what it misses
Lighthouse is excellent for repeatability and fast feedback. A CI check can flag a regression after a bundle change, route refactor, or third-party script addition. Developers can act on concrete diagnostics rather than waiting for field complaints.
It isn’t a substitute for production monitoring. Lab conditions don’t represent every device, network, geography, cache state, or interaction pattern. A composite score can also move between runs, so treating the score as the product objective encourages teams to optimize the audit rather than the user experience.
Use Lighthouse to establish a controlled baseline and catch obvious route regressions. Pair it with Chrome DevTools when the audit says a route is slow but doesn’t identify which React render, script, layout operation, or network dependency caused the delay.
3. Chrome DevTools Performance Panel
The Chrome DevTools Performance panel answers the most important debugging question: why is this React view or interaction slow? Its recording shows CPU activity, JavaScript execution, network activity, rendering, layout, screenshots, and timing tracks. The Performance panel documentation explains the interface and recording workflow.
Here, a team can move from “the dashboard feels sluggish” to a defensible diagnosis. Record the initial route load, a filter interaction, a table sort, or a client-side navigation. Then inspect long tasks, scripting clusters, layout work, paint activity, and the points where the main thread stops responding.
For React, the panel is especially useful alongside React DevTools Profiler. The browser trace shows what the browser is doing, while the React profiler helps connect expensive work to component rendering. That combination can expose a large list rendered after every keystroke, a context update that invalidates too much of the tree, or a third-party script competing with an interaction.
The trade-off is expertise
DevTools provides much deeper evidence than a single synthetic score, but it demands interpretation. A flame chart isn’t a diagnosis by itself. Developers still need to connect a long task to a component update, request waterfall, layout dependency, or third-party script.
Local recordings can also hide production-only conditions. Your development machine may have a fast CPU, warm caches, a nearby API, and none of the CDN or third-party variability seen by users. Use throttling and representative builds, then verify the suspected bottleneck with route-level synthetic tests and field monitoring.
A trace tells you where time went. It doesn’t automatically tell you which change will improve the user journey.
Chrome DevTools is therefore the best first tool after a regression is visible. It isn’t the right tool for estimating backend capacity or understanding how thousands of distinct request sequences behave under concurrency.
4. WebPageTest
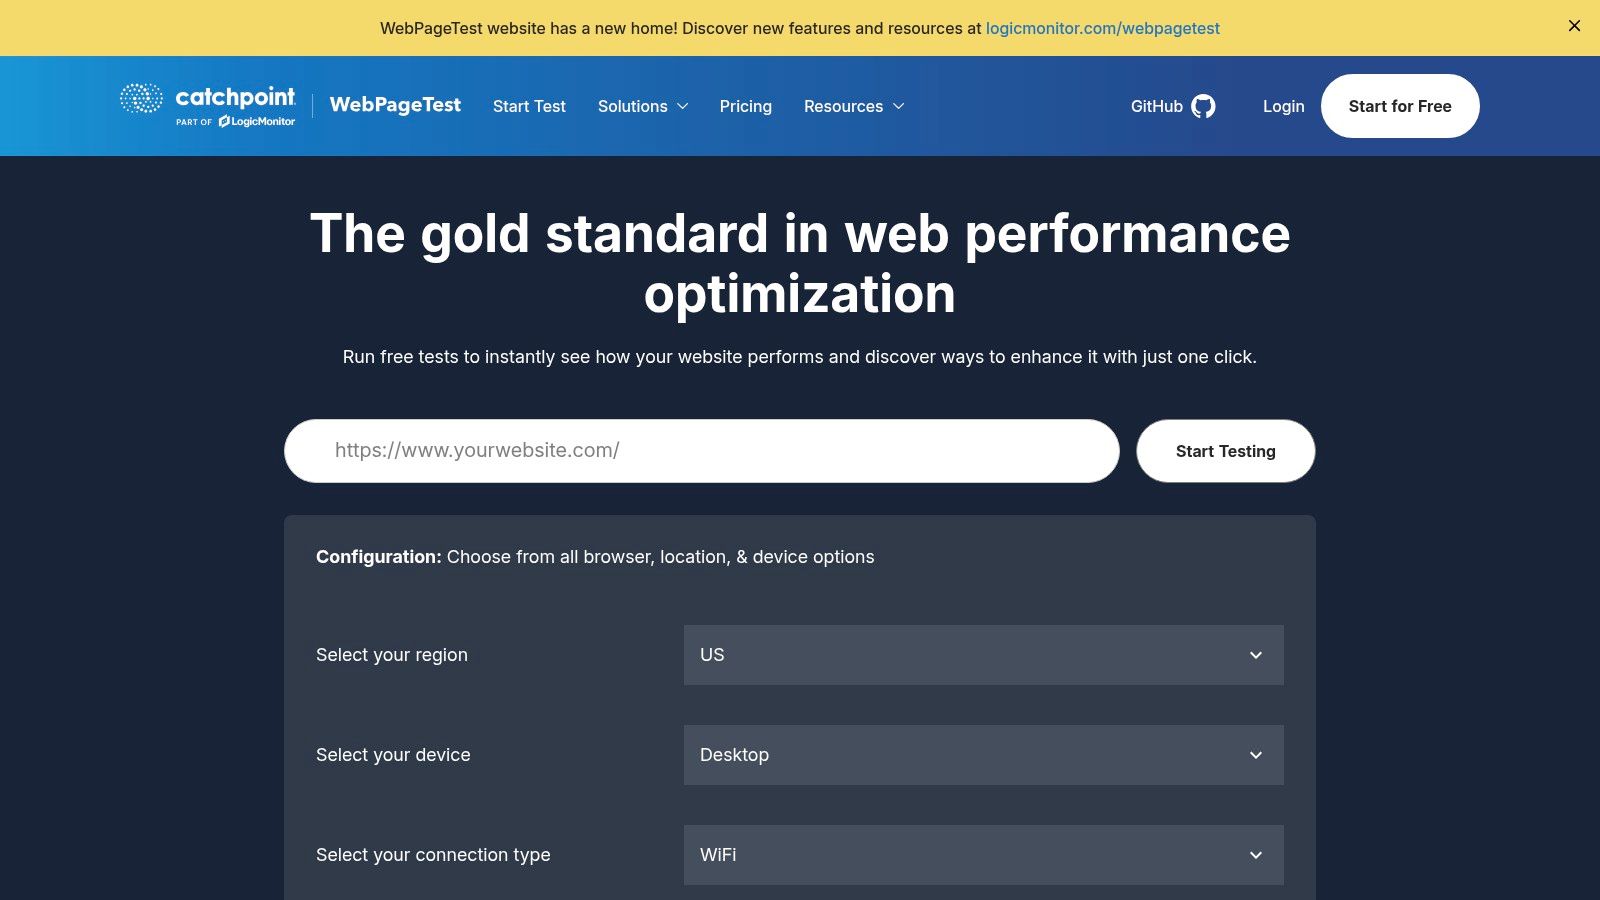
WebPageTest answers a more realistic synthetic question: how does this React route behave from different locations, devices, and network conditions? It provides waterfalls, filmstrips, connection details, and configurable test environments through the WebPageTest platform.
This matters for client-heavy React applications because the same route can have different weaknesses depending on the environment. A desktop test may hide a script-heavy render, while a slower mobile profile exposes long main-thread work. A nearby test location may make an API waterfall look acceptable even though distant users wait for multiple sequential requests.
WebPageTest is particularly strong when the route requires more than a simple page load. Its scripting support can handle authentication, navigation, and SPA transitions, so teams can test the interaction that users perform instead of measuring only the initial document.
Use it to validate a change
The Experiments workflow is useful for comparing a proposed optimization. Test the current route, apply a change such as removing a blocking dependency or altering resource delivery, and compare the resulting request sequence and visual progress. That makes WebPageTest more informative than a pass or fail score.
The trade-off is complexity. The platform has a higher learning curve than one-click audits, and its advanced capabilities may require a paid plan or self-hosted agent. Teams also need disciplined scripts. If a login flow or route transition is flaky, the resulting performance comparison isn’t trustworthy.
Choose WebPageTest when location, device, connection behavior, and request-level detail matter. Use Lighthouse for quick CI feedback, then use WebPageTest to investigate whether the improvement survives more realistic lab conditions.
5. SpeedCurve
SpeedCurve answers the monitoring question: do lab and real-user measurements agree, and are they changing after releases? It combines synthetic monitoring with Real User Monitoring and Core Web Vitals dashboards. Its performance monitoring platform is designed to connect repeatable checks with field behavior over time.
That combination suits React teams that need more than an occasional audit. Synthetic tests can run against selected routes and environments, while RUM shows how users experience those routes across their actual devices and connections. Deployment tracking, budgets, and alerts help teams connect a regression to a release rather than discovering it during a quarterly review.
React route transitions deserve specific attention. An SPA can keep the document loaded while the user changes views, fetches data, and waits for a new component tree to become interactive. A page-load audit alone won’t describe every important navigation, so teams should instrument the journeys that represent real product use.
Where the product earns its place
SpeedCurve is strongest when performance has become a shared operational concern. Engineers can investigate the underlying metrics, while product and delivery teams can follow budgets, alerts, and release trends without reading every browser trace.
The trade-off is SaaS cost and implementation effort. RUM needs instrumentation, and high traffic or dense synthetic schedules can affect spend. Sampling decisions also matter. More coverage improves visibility, but teams should define which routes, cohorts, and interactions need detailed data.
Use SpeedCurve when you want synthetic checks and field evidence in one performance practice. It won’t replace DevTools for component-level diagnosis or GoReplay for production-shaped request replay, but it can show whether a lab improvement reaches real users.
6. Calibre
Calibre is aimed at teams that want synthetic testing, RUM, and CrUX context in a relatively straightforward workflow. Its web performance platform brings scheduled page-speed checks, filmstrips, Real User Monitoring, and Google Chrome UX Report data into one interface.
For a React application, that makes it useful for comparing a controlled route test with broader field behavior. A team can track a public route synthetically, inspect the filmstrip when the visual sequence changes, and compare the result with field data that includes real browser and network variation.
Calibre also provides APIs and CLI workflows for CI and reporting. That matters when performance needs to appear in the same delivery process as build checks, deployment metadata, and route ownership. The product’s developer-facing presentation can reduce the friction of getting a basic monitoring loop running.
A practical fit for smaller performance programs
Calibre is a sensible choice when a team doesn’t want to assemble separate products for synthetic testing, field monitoring, and field-data comparison. Its configurable sampling and retention options also give teams control over how much RUM data they keep.
The limitation is scope. Complex organizations may need additional observability, tracing, load generation, or traffic-replay systems around it. Calibre also offers a free trial rather than a free-forever full product tier, so buyers should check current plan limits and included capabilities before standardizing on it.
Choose Calibre when simplicity and a unified performance view matter most. If the main problem is identifying a specific React re-render, use DevTools. If the main problem is backend saturation under realistic concurrency, use k6 or GoReplay.
7. sitespeed.io
sitespeed.io answers the self-hosted regression question: can we run repeatable browser performance tests in our own CI and keep the results over time? It is an open-source toolkit built around Browsertime, PageXray, Lighthouse integrations, and time-series reporting. The sitespeed.io documentation describes its Docker, browser, scripting, and dashboard workflows.
This is a strong option for infrastructure and DevOps teams that want control over test execution. Docker images support repeatable browser runs, and the toolkit can work with Chrome, Firefox, and Edge. Teams can test React routes repeatedly, collect filmstrips and timing data, and send historical metrics to systems such as Graphite or InfluxDB.
The self-hosted model also helps organizations with private environments, restricted applications, or air-gapped delivery systems. You aren’t required to send every test artifact to a commercial SaaS platform.
Flexibility comes with ownership
sitespeed.io gives teams considerable control over browsers, devices, scripts, storage, and reporting. That flexibility is valuable when generic SaaS checks don’t match your deployment or compliance needs.
It also creates work. Teams must maintain runners, browser versions, storage, dashboards, alerting, and test stability. The interface isn’t as polished out of the box as many SaaS products, and useful results require someone who understands browser performance rather than just collecting scores.
Choose sitespeed.io when repeatable, private, scriptable testing is more important than minimal setup. It pairs well with Lighthouse for audit signals and Playwright for application-specific journeys, while leaving production observation to a RUM product.
8. Grafana k6
Grafana k6 answers the capacity question: how do the APIs and critical browser journeys behave as concurrency increases? Its JavaScript-based scripts can exercise the HTTP layer, while k6 Browser and Synthetics support browser flows. The Grafana k6 product page covers the testing and observability integrations.
For React systems, start with the backend contract. A browser may render a dashboard, but the server still has to handle authentication, data queries, search, mutations, and supporting services. API-focused k6 tests let teams isolate that capacity question before adding the cost and variability of full browser virtual users.
Browser checks are valuable for a smaller set of critical journeys. Use them to verify that a login, search, checkout, or navigation flow remains usable while the supporting system is under test. Video and browser metrics can help connect a failing journey to visible behavior.
Don’t confuse browser checks with a traffic model
k6 is scriptable, which makes it a good fit for controlled scenarios and CI or scheduled testing. Grafana integrations also help teams connect test results with dashboards and alerts.
The trade-off is authoring effort and plan sizing. End-to-end scripts need careful data setup, cleanup, correlation, and failure handling. Browser virtual users also consume more resources than protocol-level requests, so teams should reserve them for journeys where browser behavior is part of the question.
Use k6 when you need a deliberate workload model, measurable thresholds, and a clear separation between API capacity and browser experience. Use GoReplay when the workload needs to reflect captured production request diversity instead of a scenario the team designed in advance.
9. Playwright
Playwright answers the CI regression question: did a specific React journey become slower or less diagnosable after a code change? It isn’t a dedicated load-testing platform, but its cross-browser automation, tracing, screenshots, network timing, and HAR support make it a strong instrumented journey tool. The Playwright documentation details its testing and trace capabilities.
A Playwright test can move through a React application, wait for route content, capture a trace, and preserve the artifacts needed to understand a failure. Trace Viewer shows the timeline, DOM snapshots, network activity, console output, and screenshots. That evidence is often more useful to a developer than a raw timing threshold.
Playwright also works well for route transitions that conventional page-load checks miss. Instrument the click or navigation, mark the start and end of the meaningful state change, and capture the network requests that support it. Teams can then investigate whether a slower journey comes from API latency, client scripting, rendering, or an unstable test condition.
Its boundary is important
Playwright’s parallelization is useful for test throughput, but parallel test workers aren’t a substitute for a capacity model. The framework doesn’t tell you how a production service behaves under a realistic load profile, and teams need custom instrumentation to extract and compare Web Vitals consistently.
Use it close to the code. Store traces for meaningful failures, establish thresholds around important user journeys, and avoid pretending that an end-to-end functional suite is a performance benchmark. For a broader view of automated testing and traffic-based validation, see the discussion of testing from Playwright to chaos engineering.
10. Sentry
Sentry answers the field diagnosis question: which users, routes, releases, and backend spans experienced a slow or broken React interaction? Its frontend performance monitoring, tracing, error correlation, and session context are available through the Sentry frontend platform.
That context is what lab tools lack. A developer can connect a slow route transition to a release, inspect its API spans, group related JavaScript errors, and identify whether the problem affects a particular browser or user cohort. For a React SPA, this is important because users can spend a long session moving through routes that a page-load audit never visits.
Sentry also supports Core Web Vitals measurement, release comparisons, dashboards, and ad hoc queries. Teams can use those capabilities to distinguish a regression in a new bundle from a backend incident or a problem limited to a particular route.
Field evidence needs sampling discipline
Sentry’s developer workflow is a major advantage when performance and stability overlap. A slow request that also causes an error should reach the same owner, with enough trace and release context to reduce investigation time.
Usage-based billing is the main operational constraint. Events and spans need sampling rules that preserve important routes and failures without collecting every possible detail. Self-hosting can also require significant operational effort, so teams should compare deployment and governance requirements before choosing it.
Use Sentry when production users are already finding the problem or when route-level observability must connect directly to code ownership. It doesn’t replace synthetic baselines, browser profiling, or load testing. It tells you what happened in the field, then points the team toward the evidence needed to fix it.
Top 10 ReactJS Performance Testing Tools Comparison
| Tool | Core features | Unique / USPs ✨ | Quality ★ | Target 👥 | Price / Value 💰 |
|---|---|---|---|---|---|
| GoReplay 🏆 | Capture & replay real HTTP traffic; session & TLS-aware; replay speed control | Session-aware replay, S3-backed storage, data masking, enterprise analytics ✨ | ★★★★☆ (production-proven, 19k+ stars) | 👥 Devs, QA, DevOps, Enterprise | 💰 Free OSS; PRO from $2,950/yr |
| Google Lighthouse | Lab audits: performance, accessibility, SEO, CWV guidance | Clear opportunities & CWV-focused recommendations ✨ | ★★★☆☆ (lab-only diagnostics) | 👥 Devs, CI pipelines | 💰 Free |
| Chrome DevTools Performance panel | Frame-by-frame profiling, flame charts, traces | Ground-truth runtime debugging & trace inspection ✨ | ★★★★☆ (deep local analysis) | 👥 Developers, perf engineers | 💰 Free (built-in) |
| WebPageTest | Multi-region/device synthetic tests, waterfalls, filmstrips | Advanced scripting, private agents & filmstrip/waterfall depth ✨ | ★★★★☆ (gold-standard diagnostics) | 👥 Web perf teams, QA | 💰 Free basic; Pro/self-host for full features |
| SpeedCurve | Synthetic + RUM, CWV dashboards, budgets & alerts | Correlates lab vs. field, deployment tracking & SLO alignment ✨ | ★★★★☆ (enterprise monitoring) | 👥 Product & performance teams | 💰 Paid SaaS (usage-based) |
| Calibre | Scheduled synthetic tests, RUM, CrUX integration, CI APIs | Developer-friendly UI, clear plans & CrUX comparison ✨ | ★★★☆☆ (easy & pragmatic) | 👥 Dev teams, SMBs | 💰 Paid (trial available) |
| sitespeed.io | Dockerized synthetic toolkit (Browsertime, Lighthouse) | Self-hosting, CI-friendly, Graphite/Influx integrations ✨ | ★★★☆☆ (flexible & scriptable) | 👥 Infra, DevOps, CI teams | 💰 Free (open-source) |
| Grafana k6 | Scriptable JS load tests, browser journeys, Grafana dashboards | Combines backend load testing + browser journey checks ✨ | ★★★★☆ (scalable & integrated) | 👥 SREs, performance engineers | 💰 Free tier; usage-based pricing |
| Playwright | Cross-browser E2E, tracing, HAR capture, screenshots | Rich trace viewer & test artifacts for root-cause analysis ✨ | ★★★★☆ (great DX for debugging) | 👥 Developers, QA | 💰 Free (open-source) |
| Sentry | RUM, distributed tracing, Web Vitals & release comparisons | Correlates errors, traces & user sessions for impact analysis ✨ | ★★★★☆ (production observability) | 👥 Dev & reliability teams | 💰 Usage-based; paid tiers available |
Build a Layered React Performance Workflow
The right setup assigns each performance question to the evidence that can answer it. Chrome DevTools is for root-cause profiling. It shows the browser timeline, long tasks, scripting, layout, rendering, and network activity that explain why a component or interaction is slow. Use it after a regression appears, not as a replacement for continuous monitoring.
Lighthouse and WebPageTest serve repeatable route and deployment checks. Lighthouse is the faster CI guardrail for common lab regressions. WebPageTest is better when the team needs configurable locations, devices, network profiles, filmstrips, waterfalls, scripted logins, or SPA navigation. Neither should be treated as a direct proxy for every user’s experience.
For self-hosted regression tracking, sitespeed.io provides the control and flexibility to run browser tests in private infrastructure and trend results over time. Playwright is the better fit for instrumented application journeys close to the code, especially when trace artifacts can help developers diagnose a regression. Both tools can exercise routes, but neither is automatically a realistic production workload.
Use Grafana k6 when the question involves API capacity, concurrency, scripted browser journeys, or thresholds that belong in a deliberate load model. Start at the HTTP layer when backend throughput is the concern, then add browser checks for a limited set of flows where client behavior matters. A browser script that runs in parallel isn’t the same thing as a carefully designed capacity test.
For field monitoring, choose Sentry when developers need route, release, error, span, and session context in one workflow. Choose SpeedCurve when you want synthetic and RUM measurements connected through budgets, alerts, dashboards, and deployment tracking. Calibre is a useful simpler combined view when a team wants synthetic checks, RUM, and CrUX data without assembling as many separate systems.
GoReplay becomes preferable when synthetic load doesn’t represent the workload you need to test. Replay captured HTTP traffic when the production request mix, branching behavior, authenticated patterns, migration path, or request diversity matters. Its controlled replay speed lets teams apply a captured workload to an isolated environment and observe latency, errors, capacity, and resource limits. Plan the capture point, masking, retention, and access controls before storing production-derived traffic.
Synthetic testing remains the better choice when you need a controlled and repeatable scenario, when production traffic doesn’t exist yet, or when you need to compare a narrowly defined change without unrelated request noise. The two approaches complement each other. Synthetic tests provide clean regression signals, while replay provides realism that scripted scenarios may miss.
A practical sequence looks like this:
- Define the scenario: Choose the route, transition, API operation, or traffic pattern that matters.
- Establish a baseline: Record the relevant lab, browser, API, or field measurements before changing code.
- Isolate the bottleneck: Use DevTools, Playwright traces, request waterfalls, or production spans to identify the responsible layer.
- Test the fix under the right workload: Use Lighthouse or WebPageTest for repeatable route checks, k6 for designed load, sitespeed.io for self-hosted trends, or GoReplay for captured traffic.
- Verify field impact: Check Sentry, SpeedCurve, or Calibre after release so the lab improvement is confirmed against real users.
This workflow prevents a common mistake in React performance work: optimizing the visible browser symptom while ignoring the API waterfall, route transition, third-party script, or backend constraint that caused it. Measure the layer that owns the question, keep the test repeatable where repeatability matters, and add production realism where synthetic assumptions stop being credible.
GoReplay captures live HTTP traffic and replays it against isolated environments, giving React teams a practical way to test realistic request mixes, migrations, and backend capacity before release. Visit GoReplay to evaluate traffic replay alongside your browser, route, load, and production monitoring tools.