Performance Testing JMeter: A Practical Guide to performance testing jmeter

If you’ve spent any time in performance engineering, you’ve heard of Apache JMeter. It’s a pure Java, open-source workhorse designed for one thing: putting your web apps, APIs, and network services through their paces.
Think of it as a tool for sending a virtual army to storm your application. You get to see exactly how it holds up under pressure, letting you find and fix bottlenecks long before your users ever see them.
Why JMeter Is a Go-To for Performance Testing
In the world of software quality, JMeter has earned its place. It’s not just another option on a long list of tools; for many engineering teams, it’s the standard for understanding how an application behaves under real-world load.
Its biggest advantage? It’s completely open-source. That means it’s free, incredibly extensible, and backed by a huge community that’s constantly building plugins and offering support. This flexibility allows you to test just about anything, from standard web traffic (HTTP/HTTPS) and databases (JDBC) to more specialized protocols like messaging queues (JMS) and email (POP3/IMAP/SMTP).
Whether you’re testing a simple REST API or a massive, complex e-commerce platform, JMeter has the building blocks you need.
Core Capabilities and Market Presence
At its core, JMeter is built for three primary jobs:
- Load Testing: This is the bread and butter. You simulate an expected number of concurrent users to see if your system can handle the traffic you anticipate on a busy day.
- Stress Testing: Here, the goal is to break things. You push the application way past its expected limits to find the exact point where it fails, which tells you a lot about its resilience and recovery.
- API Testing: You can also use JMeter to hammer individual API endpoints, checking not just for performance but for functional correctness. Does it respond quickly and with the right data?
Its wide adoption speaks for itself. Apache JMeter holds about 11.67% of the market share among software testing tools, with over 28,000 companies relying on it globally. It’s not just for massive corporations, either. Its user base is a healthy mix: 49% are medium-sized organizations, 26% are small businesses, and 24% are large enterprises. You can dig into more of the data on JMeter’s market position here.
The real beauty of JMeter is how it balances raw power with accessibility. You can spin up a simple test plan in just a few minutes, but the tool is deep enough to handle incredibly complex, enterprise-grade performance testing scenarios.
A First Look at the JMeter UI
Before we get into the nitty-gritty of building test plans, let’s get our bearings with the user interface. When you first fire up the application, you’re greeted by a clean, tree-based structure. This is where every test begins.
This visual editor is where you’ll do most of your work—designing, debugging, and tweaking your tests before you run them.
Everything in a JMeter test, from virtual user threads to HTTP requests and result listeners, is organized hierarchically under a single “Test Plan.” This structure makes it incredibly intuitive to see the flow of your test and manage even the most complicated scripts. Getting comfortable with this tree view is the first real step to mastering performance testing with JMeter.
Right, let’s move from theory to actually building something. This is where the real fun starts. A Test Plan is the heart of any performance test in JMeter; it’s the main container where all your test components live and work together. Think of it as the blueprint for the entire simulation you’re about to run.
Before you start adding components, you need to get JMeter up and running. It’s a simple, three-step dance.
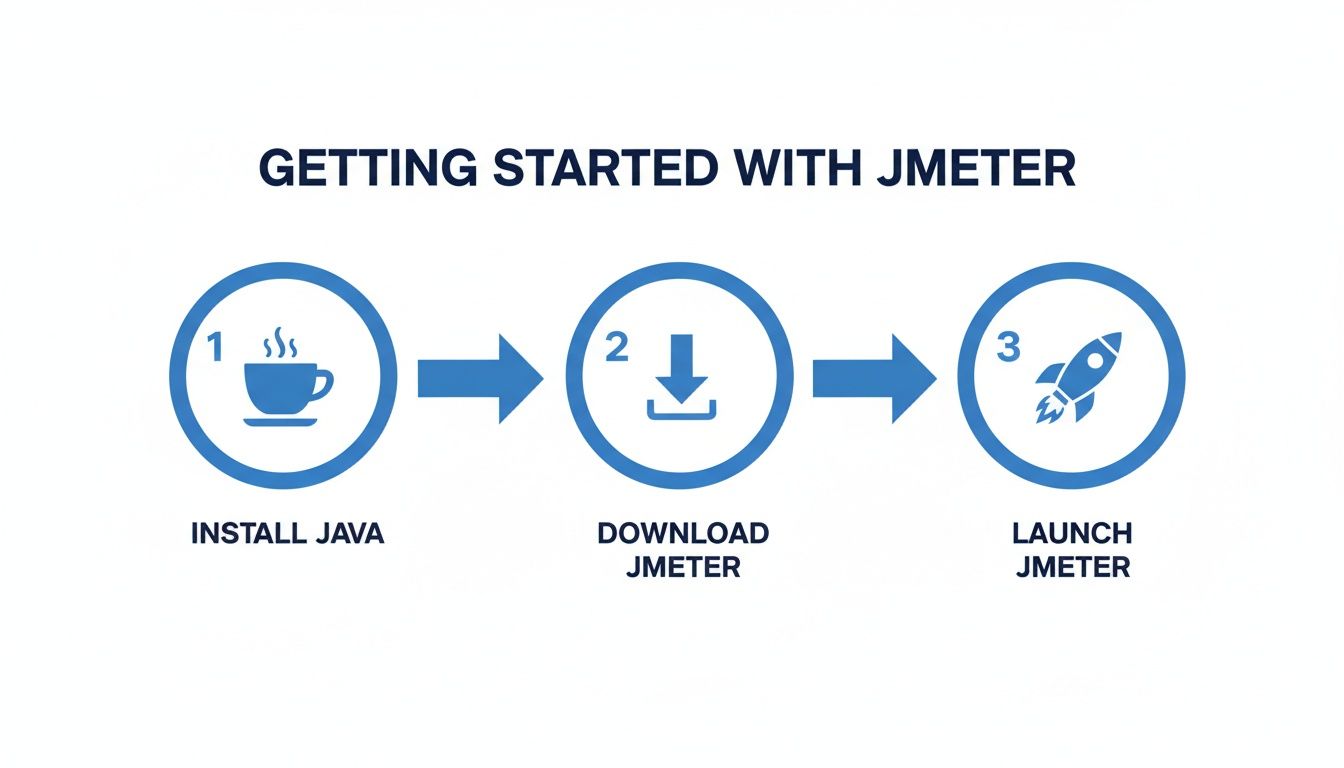
First, you need a Java Development Kit (JDK) installed. Then, you grab the latest JMeter binary from the official Apache website and launch the application. Get those three things done, and you’re ready to start building.
Defining Your Virtual Users with a Thread Group
Everything starts with users. In JMeter, a Thread Group is how you define your virtual user load. It tells JMeter how many users to simulate, how quickly to bring them online, and how many times each one should repeat the test flow.
To add one, right-click on your Test Plan, then navigate to Add -> Threads (Users) -> Thread Group. You’ll see a few critical settings:
- Number of Threads (users): This one’s easy—it’s the total number of virtual users you want hitting your application at the same time.
- Ramp-up Period (in seconds): This is a crucial setting that prevents all your users from slamming the server at the exact same millisecond. A ramp-up of 10 seconds for 100 threads means JMeter will add 10 new users every second, which is a much more realistic scenario.
- Loop Count: This determines how many times each user will run through your test script. You can also check “Infinite” and control the test duration manually or by time.
When I’m just starting a script, I like to use a small, manageable load to make sure everything works. A good starting point is 10 threads, a 5-second ramp-up, and a loop count of 1. This is perfect for verifying your script before you crank up the numbers.
Simulating User Actions with Samplers
Now that you have virtual users, they need something to do. Samplers are the components that actually send requests to your server, simulating user actions like clicking a link or submitting a form. For web applications, the HTTP Request sampler is your bread and butter.
Think about a user logging into an e-commerce site. That single action might involve two separate requests: a GET request to load the login page, followed by a POST request to submit their credentials. Each of those would be its own HTTP Request sampler inside your Thread Group.
You can add one by right-clicking your Thread Group and selecting Add -> Sampler -> HTTP Request. This is where you’ll configure the server name, protocol (http/https), the request method (GET, POST, etc.), and the specific URL path.
A classic rookie mistake is hardcoding the server domain in every single sampler. Don’t do it. A much smarter approach is to use an HTTP Request Defaults Config Element. It lets you define the server domain once, and all your samplers will inherit it. This makes switching between staging and production environments an absolute breeze.
Creating Realistic Pacing with Timers
Real people don’t fire off requests as fast as a machine can. They pause, read things, and think before clicking the next button. Timers are absolutely essential for mimicking this natural “think time” and making your load tests believable.
Without timers, your test would just bombard the server with back-to-back requests, creating an artificial load that doesn’t reflect how people actually use your site. The Constant Throughput Timer is a good option, but I often find myself reaching for the Uniform Random Timer.
The Uniform Random Timer is great because it adds variability. You can specify a random delay with a lower and upper bound—say, a pause between 500 and 1500 milliseconds. This prevents all your virtual users from pausing for the exact same duration, creating a much more staggered and authentic load pattern.
Validating Responses with Assertions
So, how do you know if your test is actually working? A “200 OK” response code is a good start, but it doesn’t tell you if the right content loaded. Assertions are your safety net. They validate that the server’s response contains what you expect it to.
For example, after a login request, I’d add a Response Assertion to check for the text “Welcome, [Username]!” on the next page. If that text is missing, JMeter flags the request as a failure—even if the status code was 200. This is how you catch those subtle bugs that only pop up under load.
Visualizing Results with Listeners
Finally, you need to see what happened. Listeners are what aggregate and display the results from your samplers. While JMeter has a ton of them, there are two you’ll use constantly during script development:
- View Results Tree: This shows you the details of every single request and response. It’s an invaluable tool for debugging. Just remember to always disable it during an actual load test, as it eats up a ton of memory and can skew your results.
- Summary Report: This gives you a clean, aggregated table with all the key metrics: average response time, throughput (requests per second), and error percentage. It’s perfect for getting a high-level overview.
By combining these core elements, you can build a robust and realistic test plan. This structure forms the foundation for pretty much any performance testing you’ll do in JMeter.
Key JMeter Test Plan Elements Explained
To wrap it up, let’s quickly summarize the core building blocks of a JMeter test plan. Getting a firm grip on what each element does is the key to designing effective and realistic performance tests. Think of these as the fundamental tools in your JMeter toolbox.
| Element | Purpose | Example Use Case |
|---|---|---|
| Thread Group | Defines the number of virtual users, ramp-up period, and test iterations. | Simulating 100 concurrent users who arrive over a 30-second period. |
| Sampler | Sends a specific type of request to a server. | An HTTP Request sampler to fetch the homepage of a website. |
| Timer | Pauses test execution to simulate user “think time” between actions. | A Uniform Random Timer to create a random delay between 1,000 and 3,000 ms. |
| Assertion | Validates the response received from the server to check for correctness. | A Response Assertion to verify that the text “Login Successful” appears on the page. |
| Listener | Aggregates and displays test results in various formats. | A Summary Report to view overall metrics like throughput and error rate. |
Mastering how these five elements interact is the first major step toward building powerful load tests. Once you’re comfortable with them, you can start exploring more advanced controllers, processors, and configurations to handle even more complex scenarios.
Getting Closer to Reality: Advanced User Simulation

Generic load tests where every virtual user follows the exact same script can give you a false sense of security. Real users are messy and unpredictable. If you want results that actually mean something, your JMeter tests have to mirror that chaos.
This means ditching static scripts for dynamic, data-driven tests. The real goal is to make every virtual user unique, which is key to preventing server-side caching from giving you artificially fast response times. You need to create a load pattern that genuinely reflects what you see in production.
Make Each User Unique with Parameterization
One of the best ways to inject realism is through parameterization. Instead of hardcoding a single username and password, you can use JMeter’s CSV Data Set Config element to pull unique data from an external file for each virtual user.
Think about testing an e-commerce login. If every single virtual user logs in with the same account, the application server will likely cache the response right after the first login. Every subsequent request hits that cache, giving you response times that look amazing but are completely disconnected from reality.
By setting up a simple CSV file, you can create a list of hundreds or even thousands of unique user accounts. JMeter will then grab a new line from that file for each user on every test run, making sure every login attempt is different.
Here’s how you’d set it up:
- Create a text file named
users.csvwithusername,passwordas the header. - Populate it with some data, like
testuser1,pass123andtestuser2,pass456. - In your JMeter Test Plan, right-click the Thread Group and navigate to Add -> Config Element -> CSV Data Set Config.
- Point it to your
users.csvfile and enter the variable names you used in the header:username,password.
Now, you can go into your login HTTP Request and replace the static credentials with ${username} and ${password}. JMeter handles the rest, instantly turning a repetitive test into a much more dynamic simulation.
This technique isn’t just for logins. You can parameterize product IDs, search queries, addresses—anything that would vary from user to user. It’s fundamental to creating a load that truly stresses your application’s backend and database.
Handle Dynamic Server Data with Correlation
Modern web apps aren’t static; they’re stateful. When a user logs in, the server generates a unique session ID and sends it back. The browser has to include that ID in all future requests to prove it’s still the same authenticated user. If your script fails to do this, every request after the login will fail.
The trick to solving this is correlation—the process of extracting dynamic data from a server response and plugging it into subsequent requests. This is probably one of the most critical skills you’ll learn in performance testing.
For instance, a session ID might show up in a response header or get embedded in a JSON body. To grab it, you use JMeter’s Post-Processors. The two you’ll use most often are:
- Regular Expression Extractor: Your go-to for pulling data from HTML or plain text responses.
- JSON Extractor: The perfect tool for parsing API responses that use JSON.
You simply add the extractor as a child of the request that returns the dynamic data (like the login request). Configure it to find the value you need, store it in a variable (e.g., sessionID), and then use ${sessionID} in the headers or bodies of all the requests that follow. Without correlation, testing any authenticated user flow is pretty much impossible.
Capture Complex Journeys with the Script Recorder
Building out a complex user journey with dozens of requests by hand is a recipe for mistakes and wasted time. This is where JMeter’s HTTP(S) Test Script Recorder saves the day. It works as a local proxy, capturing all the browser traffic you generate as you click through your application.
This method gives you a highly accurate script that includes all the right API calls, headers, and parameters your application depends on. But be warned: the raw script it produces is just a starting point. You’ll always need to go back in to add timers for pacing, parameterize the user-specific data, and handle any necessary correlation for dynamic values.
The need for robust testing has never been greater. Modern software practices mean that over 75% of organizations are pushing updates multiple times a week. At the same time, mobile performance has become a huge focus, now accounting for 48% of all performance tests as mobile devices drive over 59% of global web traffic.
For teams who want the highest degree of realism, the best strategy is often to capture and replay actual traffic from your production environment. You can learn more about how to replay production traffic for realistic load testing in our detailed guide. This approach provides a test model that’s as close to real user behavior as you can possibly get.
Alright, you’ve built your test plan. Now for the fun part: running the test and hunting down the performance bottlenecks that could cripple your app in production. A perfect test script is useless until you turn the data it generates into clear, actionable insights.
Before we go any further, let’s get one thing straight. This is the single most important rule in performance testing with JMeter: never, ever run a real load test from the GUI.
The user interface is fantastic for building and debugging your scripts. It’s perfect for a quick one-user validation run. But the moment you start adding load, the GUI itself becomes a massive resource hog, eating up CPU and memory. Running a serious test from the GUI means you’re testing JMeter’s performance, not your application’s, which completely invalidates your results.
For accurate, reliable metrics, you absolutely have to run your tests in non-GUI (command-line) mode. This slashes JMeter’s resource footprint and lets you generate a much higher, more stable load.
Your First Non-GUI Test Run
Running a JMeter test from your terminal is surprisingly simple. Just navigate to the bin directory of your JMeter installation and use this command structure:
jmeter -n -t /path/to/your/TestPlan.jmx -l /path/to/results/results.jtl -e -o /path/to/report/dashboard
This command tells JMeter to run in non-GUI mode (-n), points to your test plan file (-t), and specifies where to save the raw results (-l) and generate that beautiful HTML dashboard report (-e -o).
Once the test finishes, just open the index.html file inside your specified dashboard directory in any web browser. This interactive report is where you’ll spend most of your time digging for gold.
Scaling Up with Distributed Testing
So, what happens when you need to simulate tens of thousands of users? A single machine, no matter how beefy, will eventually tap out. That’s where distributed testing comes in. It lets you harness the power of multiple machines (we call them load generators or agents) to create a massive amount of traffic, all controlled from a single master machine.
The setup is a classic primary-secondary architecture:
- Primary: This is your command center. It orchestrates the test and gathers the results from all the agents.
- Secondary (Agents): These are the workhorses. They do the heavy lifting, executing the test plan and pumping out the load.
To get this working, you’ll install JMeter on all the machines. You start the jmeter-server process on each secondary agent. Then, back on your primary machine, you just need to edit the remote_hosts property in your jmeter.properties file and add the IP addresses of your agents. When you kick off the test, JMeter handles the rest, automatically distributing the work across all the agents you’ve configured.
Decoding the HTML Report to Pinpoint Bottlenecks
The HTML report JMeter generates is your treasure map. Don’t just glance at the average response time and call it a day. You have to dig deeper to get the real story.
Here’s what I always focus on first:
- Throughput: This is how many requests your application handled per second. If you see the throughput curve go flat while the load is still increasing, you’ve likely hit a server-side bottleneck. The system simply can’t process requests any faster.
- Response Times (90th, 95th, 99th Percentiles): Averages can hide ugly truths. The 95th percentile, for instance, tells you the response time that 95% of your users experienced. If this number is high, even with a decent average, it means a significant chunk of your users are having a slow, frustrating experience.
- Error Rate (%): Any error rate above 0% is a massive red flag. Dive into it immediately. The report breaks down errors by type, so you can quickly see if you’re dealing with server-side 5xx errors or something on the client-side.
By looking at these three metrics together, you start to see the full picture. For example, if response times suddenly spike and throughput flatlines as the user load ramps up, you’ve almost certainly found a major bottleneck in your application code, a slow database query, or a misconfigured server.
Integrating JMeter into Your CI/CD Pipeline
Performance testing isn’t a one-and-done chore you rush through before a big launch. If you want it to be truly effective, it has to be an automated, continuous part of your development lifecycle. By weaving JMeter into your CI/CD pipeline, you transform performance validation from a rare event into a daily habit, catching regressions the moment they’re introduced.
This “shift-left” approach embeds performance checks right into your build process. Instead of discovering a critical slowdown weeks before release, your team gets immediate feedback on every single commit.

Setting Up Your Automated Performance Job
First things first: treat your JMeter test plans (.jmx files) like any other piece of code. They belong in your Git repository, version-controlled right alongside your application source. This keeps your tests in sync with your application and makes them easily accessible to your CI/CD server.
Most CI/CD tools, whether it’s Jenkins or GitLab CI, make this pretty straightforward. You’ll set up a new job or pipeline stage that handles a few key actions:
- Check Out Code: The job grabs the latest version of your app code and your JMeter scripts from the repo.
- Build and Deploy: It then builds your application and pushes it to a dedicated performance testing environment.
- Execute JMeter Test: Finally, it kicks off your JMeter test in non-GUI mode against that fresh deployment, just like you would from the command line.
With this in place, a performance test automatically runs every time a developer merges new code, giving you a constant pulse on your application’s health.
Establishing Performance Gates
Just running tests automatically is a good start, but the real power comes from setting up performance gates. Think of these as automated pass/fail criteria that decide if a build is good enough to move on. If the performance metrics slip, the build fails, and everyone knows about it instantly.
For instance, you could configure your CI job to fail if:
- The 95th percentile response time creeps over a set threshold (e.g., 800ms).
- The overall error rate jumps higher than a specific percentage (e.g., 0.5%).
- The average throughput (requests per second) drops below a known baseline.
Setting these gates makes performance a non-negotiable quality standard. It’s no longer a subjective “nice-to-have” but a concrete, measurable requirement for every single build. This proactive stance is what separates teams that maintain a great user experience from those who are always fighting fires.
While JMeter is a solid choice, the performance tool landscape is always shifting. Apache JMeter’s market share has adjusted from 24.8% to 16.1% as more specialized and cloud-native alternatives pop up. You can check out more stats on the performance testing tool market on PeerSpot. These newer tools often pack in advanced features like deep CI/CD integration and real-time analytics, showing just how much the industry is pushing toward continuous, automated testing.
A Practical Workflow Example
Let’s walk through a real-world scenario. A developer pushes a code change that, unbeknownst to them, introduces a horribly inefficient database query.
The CI/CD pipeline immediately kicks off, deploys the new code, and runs the JMeter regression suite. The performance gate, which is configured to fail any build with response times over 500ms, detects a sudden spike to 1200ms.
The pipeline automatically fails the build and pings the development team’s Slack channel with an alert. The developer can see right away that their change broke performance, review the JMeter HTML report attached to the build, and fix the query before it ever sniffs another environment. That’s the real value of integrating performance testing with JMeter into your daily workflow.
To get a better handle on the philosophy behind this, check out this great guide on the principles of continuous performance tests.
JMeter vs LoadRunner: What Is the Real Difference?
The biggest difference comes down to two things: cost and community.
JMeter is 100% free and open-source. Being built on Java makes it incredibly flexible and platform-independent. It’s also backed by a massive global community that’s constantly building plugins for just about any protocol you can imagine.
LoadRunner, on the other hand, is a commercial tool from Micro Focus. It definitely has a more polished UI, dedicated enterprise support, and a ton of built-in protocols. But all that comes with a pretty hefty licensing cost. The choice usually boils down to your team’s budget, how comfortable you are with an open-source tool, and your specific protocol needs.
Why You Must Always Run JMeter in Non-GUI Mode
This isn’t just a suggestion; it’s the golden rule of JMeter. The GUI is fantastic for building, debugging, and fine-tuning your test plans. It’s the perfect place for a quick, single-user run to make sure your script actually works.
But the moment you try to run a real load test from the GUI, you’re shooting yourself in the foot. The GUI itself is a resource hog, eating up CPU and memory that should be used for generating load. This makes your load generator the bottleneck, skews all your results, and gives you artificially slow metrics.
For any accurate, reliable performance test, you absolutely have to run it in non-GUI (command-line) mode.
The command line strips JMeter down to its essentials, letting the machine dedicate all its power to generating load. It’s the only way to get trustworthy metrics and effectively simulate a high volume of users.
How to Handle Dynamic Values like Session IDs
Modern apps are stateful. They rely on dynamic data like session IDs or CSRF tokens to keep a user’s session alive, and you have to account for this. This process, known as correlation, is a non-negotiable part of performance testing with JMeter.
You’ll use JMeter’s Post-Processors to grab these values on the fly. The most common tools for the job are:
- Regular Expression Extractor: Your go-to for parsing data from HTML or other text-based responses.
- JSON Extractor: The perfect choice when you’re pulling data from JSON-based API responses.
Here’s how it works: you add one of these extractors as a child to the request that first receives the dynamic value (like a login request). You configure it to find the specific value in the server’s response and save it to a JMeter variable, say ${sessionID}.
From that point on, you just use that variable in all subsequent requests. This sends the correct, dynamic data back to the server, ensuring your virtual user maintains a valid, active session for the entire test.
At GoReplay, we believe the most accurate tests come from real user traffic. Instead of just simulating behavior, our open-source tool allows you to capture and replay your actual production traffic in a safe test environment, providing an unparalleled level of realism. Discover how GoReplay can elevate your performance testing strategy.