Decoding Performance Bottlenecks: What’s Really Slowing You Down
Performance testing bottlenecks are a hidden threat to any application. They can stifle speed, limit scalability, and ultimately, degrade the user experience. These constraints often manifest differently across different system architectures, making them difficult to identify without a proper testing methodology. So, what exactly are these bottlenecks, and why are they so elusive?
One key step is understanding the different types of performance bottlenecks. They generally fall into three main categories: hardware, software, and network.
Hardware bottlenecks can include insufficient CPU, limited memory, or slow disk I/O speeds. Software bottlenecks, however, often arise from inefficient code, poorly optimized databases, or resource contention within the application itself. Finally, network bottlenecks can stem from limited bandwidth, high latency, or DNS resolution problems. Each type impacts key user experience metrics in unique ways, influencing everything from page load times to transaction processing speeds.
Let’s illustrate with an example. Picture an e-commerce website during a flash sale. If the database server is underpowered, it becomes a hardware bottleneck, leading to slow response times and unhappy customers.
Alternatively, if the application code isn’t optimized to handle a surge of concurrent users, it becomes a software bottleneck. This could result in application crashes and lost revenue. Similarly, insufficient network bandwidth could create a bottleneck, preventing users from even accessing the website.
The growing importance of performance testing is directly linked to the increasing demand for smooth, seamless online experiences. McKinsey highlights the critical role of performance testing, especially for large-scale applications in competitive markets. As users expect fast and reliable applications, businesses are investing significantly in performance testing tools and methodologies.
Simply identifying these different bottleneck types isn’t enough. Understanding how they interact and potentially amplify one another is crucial. A seemingly small network issue, for example, can worsen an existing database bottleneck, leading to a cascading failure that could take down the entire application. This interconnectedness emphasizes the need for robust performance testing strategies that can pinpoint and resolve each bottleneck effectively. This requires using the right tools and techniques for proper diagnosis and remediation.
Recognizing the Warning Signs Before Users Do
Before your application crashes under pressure, it’s essential to identify the subtle signs of performance problems. These can range from slow response times and unexpected crashes to resource exhaustion and queuing bottlenecks. Catching these early prevents major performance disasters and ensures a smooth user experience. You might be interested in: How to master performance testing.
Identifying Subtle Symptoms Across Different Application Types
Performance bottlenecks aren’t always obvious. They can subtly impact your application’s performance. For example, a small increase in average response time might seem minor, but it could indicate a growing problem, especially under heavy load. Likewise, occasional error spikes might appear random, but they could be the first sign of a deeper issue. Even minor delays in specific transactions might signal a bottleneck in a specific component.
Resource saturation is another critical warning sign. If your CPU, memory, or disk I/O consistently runs near maximum capacity, your application is struggling to keep up. This can lead to slower response times, more errors, and application instability. Queue buildup is another key symptom. Long queues indicate requests aren’t being processed efficiently, potentially pointing to a bottleneck in a service, database, or other component.
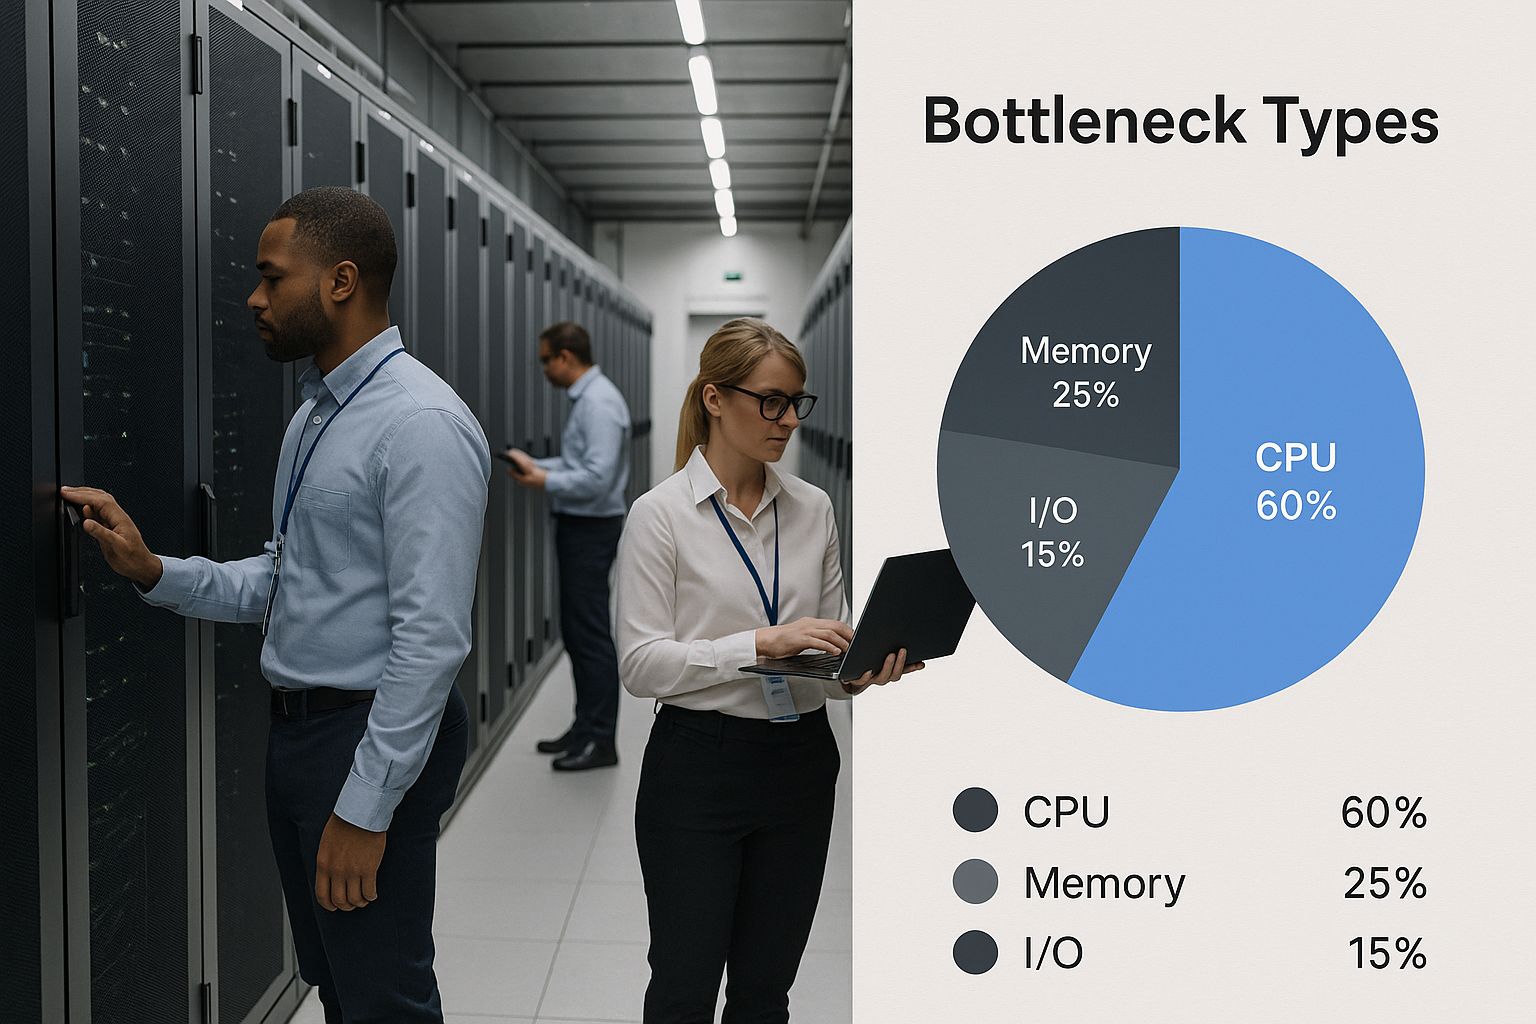
The infographic above visualizes common data center bottleneck types, emphasizing the importance of identifying and addressing these issues. As the visualization shows, identifying these bottlenecks often requires careful monitoring within the complex data center environment.
Establishing Meaningful Performance Baselines
To separate random fluctuations from real bottlenecks, establish meaningful performance baselines. Collect performance data under normal conditions to understand your application’s typical behavior. This baseline data becomes a benchmark for comparison, enabling you to identify deviations that signal a developing problem. A sudden spike in response time compared to the baseline, for instance, could signal a new bottleneck or a regression from a recent code change. Identifying and addressing performance bottlenecks is crucial. For example, optimizing database queries can boost system speed by up to 30%, and techniques like caching can improve database performance by up to 50%. Find more detailed statistics here. These baselines should include key metrics like response times, error rates, resource utilization, and queue lengths.
Understanding how these warning signs appear in different architectures is also essential. A bottleneck in a web application might mean slow page loads, while in a mobile application it could cause sluggish UI interactions. In enterprise applications, bottlenecks impact complex business processes, and in microservice architectures, they affect inter-service communication and system stability. This means performance testing strategies must be tailored to each architecture’s specific characteristics.
The following table outlines common performance bottleneck symptoms, their potential causes, and severity levels to help teams quickly identify issues during testing.
Common Performance Bottleneck Symptoms
| Symptom | Potential Causes | Severity Level | Detection Method |
|---|---|---|---|
| Slow Response Time | High CPU utilization, slow database queries, network latency, inefficient code | Medium to High | Performance Monitoring, Load Testing |
| Application Crashes | Resource exhaustion (memory leaks), unhandled exceptions, database connection issues | High | Error Logging, Crash Reporting |
| Resource Saturation (CPU, Memory, Disk I/O) | Insufficient resources, inefficient resource management, high load | High | Resource Monitoring, Performance Testing |
| Queue Buildup | Bottleneck in a service, database, or other critical component, slow processing times | Medium to High | Queue Monitoring, Performance Testing |
| Error Spikes | Network issues, database errors, resource limitations | Medium to High | Error Logging, Application Monitoring |
This table provides a starting point for identifying performance bottlenecks. By understanding the symptoms, potential causes, and detection methods, teams can quickly pinpoint and resolve performance issues, leading to a better user experience.
Tackling Database Bottlenecks That Tank Performance
Database interactions are frequently the biggest hurdle for application performance. Even simple queries can bring down entire systems when under pressure. This section explores how to identify and fix these hidden performance problems before they affect your users.
Identifying Common Database Bottlenecks
Several common issues contribute to database bottlenecks. Missing indexes are a frequent problem. Imagine searching a massive library with no card catalog—finding a specific book would take forever. Similarly, without indexes, the database has to scan every single row, resulting in slow queries.
Connection pool starvation is another usual suspect. A connection pool limits simultaneous connections to the database, much like a bouncer at a busy club. If too many users try to connect at the same time, some are left waiting, impacting the whole application.
Architectural issues, often unnoticed in smaller systems, become major problems as systems scale. An inefficient database schema can lead to redundant data and too many joins, which affects query performance under heavy load. Incorrect data type choices or inadequate normalization can also significantly slow down queries.
Leveraging Diagnostic Tools and Targeted Testing
Several tools can help uncover database bottlenecks. Execution plans provide a detailed breakdown of how a database will execute a query. Studying these plans can pinpoint inefficiencies, such as full table scans or the need for indexes.
Specialized monitoring tools give you real-time data on database activity. They offer metrics on query execution times, resource usage, and connection pool status. This information helps identify problematic queries and optimize database settings. Targeted performance tests, like load tests and stress tests, simulate real-world traffic, revealing how the database performs under pressure and highlighting areas for improvement.
Globally, businesses encounter significant performance testing challenges. Database queries are a frequent bottleneck, especially in enterprise applications where slow queries cause widespread slowdowns. For instance, Gatling research has shown that database operations often hide deeper performance problems within enterprise applications. Explore this topic further.
Implementing Optimization Strategies
After identifying bottlenecks, you can implement several strategies to resolve them. Adding indexes to frequently used columns makes data retrieval much faster. It’s like adding an index to a textbook—you can quickly jump to specific information.
Optimizing query structure—rewriting complex queries, removing unnecessary joins, and filtering data efficiently—can significantly improve performance. Correctly sizing connection pools helps prevent starvation. Increasing the pool size provides enough connections for peak loads, reducing wait times.
For recurring issues, think about database schema adjustments. Restructuring tables, normalizing data, and choosing the right data types can improve fundamental performance. These optimizations often require careful planning and thorough testing, but the improvements can be substantial.
Using a performance testing framework, particularly one focused on database interactions, offers a proactive way to manage performance. Regular load tests can identify emerging bottlenecks before they affect users, allowing you to continuously optimize your database and keep it a solid foundation for your application.
Breaking Through Network and Infrastructure Barriers
Network and infrastructure limitations are often overlooked bottlenecks in performance testing. Even with flawlessly optimized code, underlying network constraints can severely impact how well your application performs. This makes understanding these bottlenecks, and knowing how to address them, crucial for a positive user experience.
Identifying Network Bottlenecks
Several key factors contribute to these performance roadblocks. Bandwidth limitations, for instance, restrict how much data can be transmitted, leading to slowdowns when the system is under heavy load. Think of it like a highway with too few lanes during rush hour.
Connection throttling, whether intentional or the result of network congestion, also restricts data flow. Imagine a water pipe with a partially closed valve – the flow is restricted. Throttling has a similar impact on application responsiveness.
DNS resolution delays are another culprit. This is the process of translating domain names into IP addresses, and delays can add significant latency. Every time your application needs to access a server, it performs a DNS lookup. Slow DNS resolution means your application waits before it can even begin transferring data.
Finally, CDN configuration issues can introduce performance problems. CDNs (Content Delivery Networks), are geographically distributed servers designed to cache content closer to users. If a CDN is configured incorrectly, it can negate its benefits and even create new bottlenecks.
Differentiating Between Application Code and Infrastructure Problems
One crucial step in resolving performance bottlenecks is pinpointing their source: Is it the application code or the network infrastructure? Leading performance engineers use specific testing techniques to isolate the problem. For instance, testing within a controlled network environment, one with ample bandwidth and minimal latency, can reveal if the issue lies within the code. Conversely, simulating real-world network conditions with GoReplay helps determine the effects of specific network constraints on application performance.
The Unique Challenges of Distributed Systems
Distributed systems and microservices architectures bring their own set of challenges. Network performance becomes even more vital in these environments because numerous services constantly communicate with each other. A slow connection between just two microservices can have a ripple effect, impacting overall system performance. This demands specialized testing strategies, with a focus on inter-service communication and network latency.
Testing Cloud and On-Premises Infrastructure
Performance testing must account for both cloud and on-premises infrastructures. Each presents unique challenges and necessitates specific testing approaches. Cloud environments can be affected by unpredictable resource availability and network variability. On-premises infrastructures, while offering greater control, may be limited in scalability.
Configuring Realistic Network Conditions and Interpreting Metrics
Configuring realistic network conditions is essential for effective performance tests. Simulating real-world network latency, bandwidth limitations, and packet loss using tools like GoReplay allows for accurate assessments. Analyzing the results, particularly key metrics like throughput, latency, and error rates, provides valuable insight and informs optimization strategies. Turning those metrics into actionable insights helps determine the root cause of performance bottlenecks.
Communicating Infrastructure Needs
Finally, communicating infrastructure needs to stakeholders is essential. Using concrete performance data, derived from your network testing, allows you to justify required upgrades or changes to the infrastructure. This data-driven approach gives weight to your recommendations and helps secure buy-in for necessary resource allocation.
The following table summarizes several strategies for resolving network bottlenecks:
Network Bottleneck Resolution Strategies
| Resolution Strategy | Effectiveness | Implementation Complexity | Cost Factor | Best Use Cases |
|---|---|---|---|---|
| Increase Bandwidth | High | Low | Medium | High traffic websites, video streaming applications |
| Optimize CDN Configuration | Medium | Medium | Low | Content-heavy websites, global applications |
| Implement Connection Pooling | High | Medium | Low | Database-intensive applications |
| DNS Optimization | Medium | Low | Low | Applications with frequent DNS lookups |
| Reduce Payload Size | High | Medium | Low | Mobile applications, data-intensive APIs |
This table illustrates different strategies for addressing network performance bottlenecks, their associated complexities, and cost implications. By proactively addressing these challenges, you can ensure your application performs optimally under real-world conditions.
Conquering Memory and CPU Utilization Challenges
Resource utilization, specifically CPU and memory, often presents a significant bottleneck when applications handle substantial traffic. Early identification of these issues is crucial. This means recognizing telltale signs of problems like memory leaks, threading issues, and inefficient algorithms before they impact performance under stress.
Identifying Resource Bottlenecks
Visualize a highway during rush hour. As more cars enter, traffic slows. Similarly, as your application processes more requests, its demand for CPU and memory increases. Limited resources lead to longer response times, application crashes, or even total system failures. Just as traffic engineers monitor highway congestion, performance engineers must understand the nuances of CPU and memory usage.
Memory leaks represent a frequent issue. These occur when an application allocates memory but doesn’t release it when no longer needed. This gradually depletes available memory, much like a slow leak in a tire.
Threading issues also contribute to CPU bottlenecks. Poorly managed threads compete for resources, causing excessive context switching and wasted CPU cycles. It’s like multiple cooks trying to work in a small kitchen, hindering efficiency.
Finally, inefficient algorithms can cause excessive CPU and memory consumption. A poorly designed algorithm is like taking the scenic route when a direct path exists; it consumes more time and resources.
Measuring and Interpreting CPU and Memory Utilization
Precisely measuring CPU and memory utilization across application components is essential. Tools like profilers offer detailed information about resource usage, pinpointing code bottlenecks, much like a mechanic’s diagnostic tools. Profilers) can be invaluable for identifying these issues.
Interpreting this data involves identifying patterns. Consistently high CPU usage alongside increasing memory consumption could indicate a memory leak. CPU usage spikes during specific operations might suggest an inefficient algorithm or threading problem.
Targeted Optimization Strategies and Case Studies
Differentiating between actual resource bottlenecks and misleading metrics is key. Sometimes, apparent resource issues stem from other factors, such as network latency or database slowdowns. Focusing on resource optimization when the real problem lies elsewhere is unproductive.
Targeted optimization strategies significantly improve resource utilization. Using efficient data structures, optimizing algorithms, and improving memory management can reduce resource consumption and enhance performance. For example, a minor optimization to a sorting algorithm resulted in a 20% reduction in CPU usage, significantly impacting overall performance and user experience.
Another example involves identifying and fixing a memory leak causing regular application crashes. Resolving this dramatically improved application stability, increased user satisfaction, and reduced downtime.

This graph demonstrates how monitoring resource utilization provides valuable insights into application performance. By analyzing these metrics, performance engineers identify and resolve resource bottlenecks, leading to improved application stability and responsiveness. Careful monitoring and analysis of CPU and memory utilization allow engineers to address these crucial bottlenecks, ensuring optimal performance and stability.
Essential Tools and Techniques That Reveal Hidden Bottlenecks
Finding the right performance testing tools can make the difference between a seamless user experience and a frustrating one, especially when hunting down hidden bottlenecks. The correct approach, combined with realistic test scenarios, provides invaluable insights into performance issues.
Choosing the Right Performance Testing Tools
Pinpointing performance bottlenecks often requires specialized tools. The best choice depends on your needs and resources. Both commercial and open-source solutions have their advantages. Commercial tools like LoadRunner often come with robust features, detailed reporting, and dedicated support—invaluable for larger teams and complex projects. Open-source tools like JMeter offer flexibility, customization, and a lower cost of entry, making them a great starting point for smaller teams or specialized testing needs.
Performance engineers often prioritize features like automated test creation, detailed performance metrics, and integration with other development tools. Choosing between commercial and open-source often depends on budget, features, and the level of support required. The tool should integrate seamlessly into existing workflows and help identify the root causes of bottlenecks. This precision is key to effective optimization.
Implementing Effective Testing Approaches
Different testing approaches reveal different types of bottlenecks. Load testing, for example, simulates real-world user traffic to assess application performance under normal conditions. This helps identify bottlenecks that arise during typical user activity. Check out our guide on boosting application performance with load testing. Stress testing, on the other hand, pushes the system beyond its limits to uncover breaking points. This reveals bottlenecks related to resource exhaustion and stability under pressure.
Soak testing evaluates long-term performance and stability. Running the application under a moderate load for an extended period can expose slow memory leaks or other issues that might not surface in shorter tests. Spike testing simulates sudden traffic bursts to see how the system handles rapid load changes. This helps identify bottlenecks related to scalability and responsiveness to unpredictable demand.
Creating Realistic Test Scenarios
Realistic test scenarios are essential for meaningful results. Synthetic traffic often misses real-world issues. Instead, simulate actual user behavior by analyzing user logs, monitoring real-time traffic, and modeling user journeys through the application. This ensures your performance tests accurately reflect real usage patterns, leading to more precise bottleneck identification.
Advanced Bottleneck Detection Techniques
Beyond basic tools and approaches, advanced techniques offer deeper insights. Distributed testing setups, using multiple machines to generate load, accurately simulate large-scale user traffic. Service virtualization isolates specific components by simulating dependencies, allowing you to test individual services without impacting the entire system, simplifying bottleneck identification in complex architectures. Real-user monitoring (RUM) tracks actual user experiences in production, capturing performance data directly from user interactions. This offers valuable insights into real-world bottlenecks, complementing simulated test results. Combining these techniques gives you a comprehensive understanding of your application’s performance limitations, letting you prioritize optimizations for maximum impact.
From Bottleneck to Breakthrough: Your Strategic Resolution Plan
Random fixes rarely get to the root of recurring performance issues. A systematic approach, focusing on business impact and continuous optimization, yields much better and longer-lasting results. This means shifting from reactive problem-solving to proactive planning and ongoing improvements.
Prioritizing Bottlenecks Based on Business Impact
Not all bottlenecks are equally important. Some have a minor impact, while others can significantly disrupt key business operations. Prioritizing bottlenecks requires understanding their impact on important business metrics.
For example, a bottleneck affecting the checkout process on an e-commerce website has a higher business impact than one on a less-visited page like the “About Us” section. Focusing on the checkout process first maximizes the return on your optimization efforts.
Developing Targeted Resolution Strategies
Once prioritized, each bottleneck needs a specific resolution strategy. A database bottleneck might be resolved by optimizing queries or adding indexes. A network bottleneck could require bandwidth upgrades or CDN adjustments.
This targeted approach ensures efficient resource allocation, focusing on solving the core issue. Just as a doctor prescribes specific medications for different illnesses, a performance engineer develops targeted solutions for unique performance bottlenecks.
Validating Improvements and Implementing Continuous Performance
After implementing a fix, it’s essential to validate the improvement. This is best achieved through repeated performance tests, comparing before-and-after metrics. This provides concrete proof of the optimization’s effectiveness.
Continuous performance involves integrating performance testing into every stage of the development lifecycle. This proactive approach helps identify regression issues before they impact users. Much like a doctor monitoring a patient’s vital signs after treatment, performance engineers monitor key performance indicators (KPIs) to ensure the implemented solution works as expected.
Documenting, Tracking, and Measuring Optimization Impact
Resolving performance bottlenecks effectively involves documenting the problem, the proposed solution, and the achieved results. This creates a valuable knowledge base for future reference.
Tracking resolution progress allows you to monitor your efforts’ effectiveness and make adjustments as needed. Measuring optimization impact in business-relevant terms, such as increased conversion rates or reduced customer churn, demonstrates the value of performance optimization to stakeholders.
Real-World Examples and Transforming Performance Culture
Many organizations have successfully shifted their performance culture from reactive to proactive. They’ve implemented continuous performance testing, integrated performance as a key metric in development processes, and established clear communication between technical and business teams.
These organizations often see significant improvements in application performance, user satisfaction, and business outcomes. For instance, one online retailer optimized their database queries and reduced average page load time by 40%, resulting in a 15% increase in conversion rates.
This demonstrates the significant impact of prioritizing performance, using the right tools like GoReplay, and implementing a continuous performance optimization process. This builds a culture of continuous improvement and elevates performance optimization from a technical task to a key driver of business success.
Ready to improve your application performance? GoReplay helps you capture and replay live traffic, simulating real-world scenarios to identify and resolve performance bottlenecks before they affect your users. Learn more about GoReplay and start optimizing your application performance today.