Establishing Your First Performance Baseline
So, what exactly is a performance baseline? Think of it as a diagnostic snapshot of your system. It’s a quantitative measurement of your application’s performance under a normal, everyday workload. This gives you a rock-solid benchmark to measure against any time you make a change.
Why a Performance Baseline Is Your System’s North Star
 Before we jump into the how, let’s talk about the why. A performance baseline is so much more than just a spreadsheet full of numbers. It’s the source of truth for your system’s health, stability, and capabilities. Without one, you’re essentially flying blind, making critical decisions based on gut feelings instead of hard data.
This isn’t a concept unique to software, either. Baselines are used everywhere to create a reference point for future comparison. Economists do it all the time—they use global GDP growth rates as a baseline to see how the economy is shifting. The International Monetary Fund’s World Economic Outlook Update, for instance, constantly compares current projections against historical averages to make sense of it all.
From Reactive Guesswork to Proactive Science
Imagine this: you’re running a flash sale on your e-commerce site, and traffic suddenly goes through the roof. If you have a solid performance baseline, you already know your system’s breaking points. You can anticipate how it’ll behave under stress and have proactive measures ready to go, sidestepping a costly outage.
This is what a baseline does. It turns performance tuning from a frantic, reactive guessing game into a data-driven science. It gives you the evidence to answer the questions that really matter:
- Did that new feature actually improve performance? Your baseline gives you the before-and-after data to prove it.
- Is our infrastructure upgrade worth the money? Compare post-upgrade metrics against your baseline to calculate the real ROI.
- What does “normal” even look like for our app? A baseline defines your system’s typical behavior, making any deviation or regression stick out like a sore thumb.
A performance baseline is the ultimate diagnostic tool. It transforms vague complaints like “the site feels slow” into concrete, actionable data points like, “P95 latency jumped by 300ms after the last deployment.”
To build a truly effective baseline, you need to track the right things. The table below outlines some of the most critical metrics you should be watching across your stack.
Essential Metrics for Your Performance Baseline
| Metric Category | Example Metrics | Why It Matters |
|---|---|---|
| Application Layer | Response Time (Average, P95, P99), Error Rate (e.g., HTTP 5xx), Throughput (RPS/RPM) | These directly reflect the end-user experience. Spikes in latency or errors are the first sign of trouble. |
| Database Layer | Query Latency, Active Connections, Index Hit Rate, CPU/Memory Usage | A slow database often becomes the bottleneck for the entire application. Poor query performance can bring everything to a halt. |
| Infrastructure Layer | CPU Utilization, Memory Usage, Network I/O, Disk I/O | These metrics tell you if your underlying hardware can handle the load. Maxed-out resources are a clear indicator of capacity limits. |
| Business Metrics | User Signups, Completed Transactions, Conversion Rate | Tying technical performance to business outcomes proves the value of your optimization work to stakeholders. |
Tracking these gives you a holistic view of your system’s health, from the server rack all the way up to the user’s screen.
The Strategic Value of Baselines
Establishing a robust performance baseline is, at its core, a strategic decision. It’s how you align technical metrics with business goals, ensuring your application can reliably deliver what users expect. This foundational knowledge empowers your team to make confident choices that protect your services, optimize the user experience, and drive predictable growth.
When you can definitively show how a code change impacted performance, you build trust with stakeholders and can easily justify allocating resources for optimization work. It’s the starting point for every load test, capacity plan, and performance-tuning initiative you’ll ever run.
Setting the Stage for Accurate Traffic Capture
 Jumping straight into traffic recording without the right setup is a recipe for skewed, unreliable data. An improperly prepared environment can completely invalidate your performance baseline before you even begin—a lesson many of us have learned the hard way. It’s like trying to get a clear engine reading while driving through a bumpy field. The noise will overwhelm the signal every time.
This prep work ensures that the traffic you capture with a tool like GoReplay is a true mirror of reality, not a funhouse distortion. The first job is to pick the right staging or test environment. It absolutely must mirror your production setup in terms of hardware specs, software versions, and network configuration. A classic mistake is using an underpowered test bed, which just creates artificial bottlenecks and hands you misleading performance data.
Securing Access and Mapping the Flow
Once your environment is ready, it’s time to deal with permissions. Capturing traffic, especially at the network interface level, often requires elevated privileges. Make sure your team has the necessary access sorted out before you plan to start, because nothing kills momentum like a last-minute access roadblock.
Next, you need to map your network topology. You can’t capture traffic effectively if you don’t know exactly where it flows. Ask yourself these critical questions:
- Where does the traffic actually originate?
- Which load balancers or reverse proxies does it pass through?
- Which application servers ultimately process the requests?
Answering these questions helps you pinpoint the perfect spot to place GoReplay. In most cases, capturing traffic after the load balancer—directly on the application servers—is the way to go. This gives you a picture of the true load your application is handling.
A poorly chosen baseline can be far worse than no baseline at all. I once saw a team mistakenly record traffic during a major service outage. The baseline showed extremely low resource usage. Naturally, their subsequent “optimizations” appeared to have a massive positive impact, but they were measuring against a completely broken benchmark.
Choosing a Representative Time Window
Finally, timing is everything. You can’t just capture traffic whenever it’s convenient. You need a period that reflects typical, everyday user activity. Capturing during a Black Friday sale or a late-night maintenance window will give you a weird, anomalous snapshot, not a useful performance baseline.
Dig into your existing monitoring data to find periods of normal, peak, and low traffic. A great starting point is to capture a full 24-hour cycle during a typical business week. This gives you a comprehensive view of how your system behaves under varied, yet predictable, conditions. This careful preparation is what separates a scientifically valid baseline from a useless collection of metrics.
Capturing Production Traffic Safely with GoReplay

Alright, your environment is prepped and ready. Now comes the interesting part: capturing live production traffic. This is where we move from theory to practice, and a tool like GoReplay is your best friend for the job. It lets you listen in on real user interactions without slowing anything down or introducing risk.
The real power of this approach lies in how passive it is. GoReplay works by sniffing network packets, essentially making a copy of the traffic as it flows to your application. Your production system has no idea it’s being watched, which means zero impact on your users’ experience. That captured data becomes the raw material for your performance baseline.
Practical Configuration for Complex Scenarios
Forget the “hello world” examples in the documentation. Real-world systems are messy and demand a more nuanced approach to get clean, relevant data. You almost never want to capture all the traffic—instead, you need to zero in on the requests that actually matter for your baseline.
This is where GoReplay’s filtering really shines. Maybe you only care about requests hitting your core API endpoints. You can use simple flags to filter by request path, making sure you only record interactions with /api/v1/users or /api/v1/orders while ignoring all the noise from static assets.
Here’s what that looks like in a real command:
sudo gor —input-raw :8080 —output-file requests.gor —http-allow-url /api/v1/
This command listens on port 8080, saves everything that matches to requests.gor, and—most importantly—only captures requests where the URL path starts with /api/v1/. It’s a simple filter, but it’s incredibly effective for building a targeted performance baseline.
Managing Long-Term Traffic Recording
If you’re capturing traffic over a long period, say, a full 24-hour cycle, you’re going to generate some massive output files. A busy system can easily churn out gigabytes of data every hour, which will chew through your disk space in no time.
To get around this, GoReplay has built-in file rotation. You can set it up to automatically split the output into smaller, time-stamped files. This makes the data much easier to manage, store, and analyze later on.
Pro Tip: When running a long capture, always run GoReplay as a background service with a tool like
systemdorsupervisor. This ensures the process keeps running even if you get disconnected. Trust me, you don’t want to lose hours of data because your terminal session timed out.
Handling Multi-Server Architectures and Encryption
Modern applications are rarely single-server monoliths. They’re usually distributed across multiple instances sitting behind a load balancer. To get the full picture in this kind of setup, you have to run a GoReplay listener on each and every application server. You can then pull all those individual requests.gor files together before you start the replay.
Encrypted traffic is another common hurdle. If your load balancer handles TLS/SSL termination and sends plain HTTP traffic to your app servers, you’re in luck—capturing it is straightforward. But if the traffic stays encrypted all the way to the application, things get trickier. You’ll need more advanced configurations, often involving special plugins or network setups, to get GoReplay to see the decrypted traffic.
Getting these details right is crucial. It’s what ensures your captured traffic is a true reflection of reality, which is the foundation for a valid performance baseline.
Alright, you’ve captured your production traffic and have it saved. Now for the fun part: creating your performance baseline. This is where we unleash that real-world data against your test environment to see how it really behaves under pressure. The goal isn’t just to see if it runs; it’s to measure, analyze, and find its limits.
With a tool like GoReplay, you can do much more than a simple one-to-one replay. You get to control the speed, effectively simulating different load conditions. This is how you start answering the big questions about your system’s capacity and resilience. It’s the difference between knowing your system works and knowing how well it works.
Calibrating Your Replay for Different Scenarios
The real insight comes from replaying traffic at different speeds. For example, a standard 1x replay is perfect for establishing your initial performance baseline. It shows you exactly how the system performs under a typical, everyday load. Think of this as your benchmark for “normal.”
From there, you can start turning up the heat. A 2x replay can simulate a sudden spike in traffic—maybe a mini-flash sale or a viral social media post. It’s a solid, light stress test. Pushing it even further to 5x or 10x is how you find the absolute breaking point, the load at which response times tank, error rates shoot through the roof, and the system starts to crumble.
This whole process—collecting, analyzing, and reporting—is the foundation for building a baseline you can actually trust.
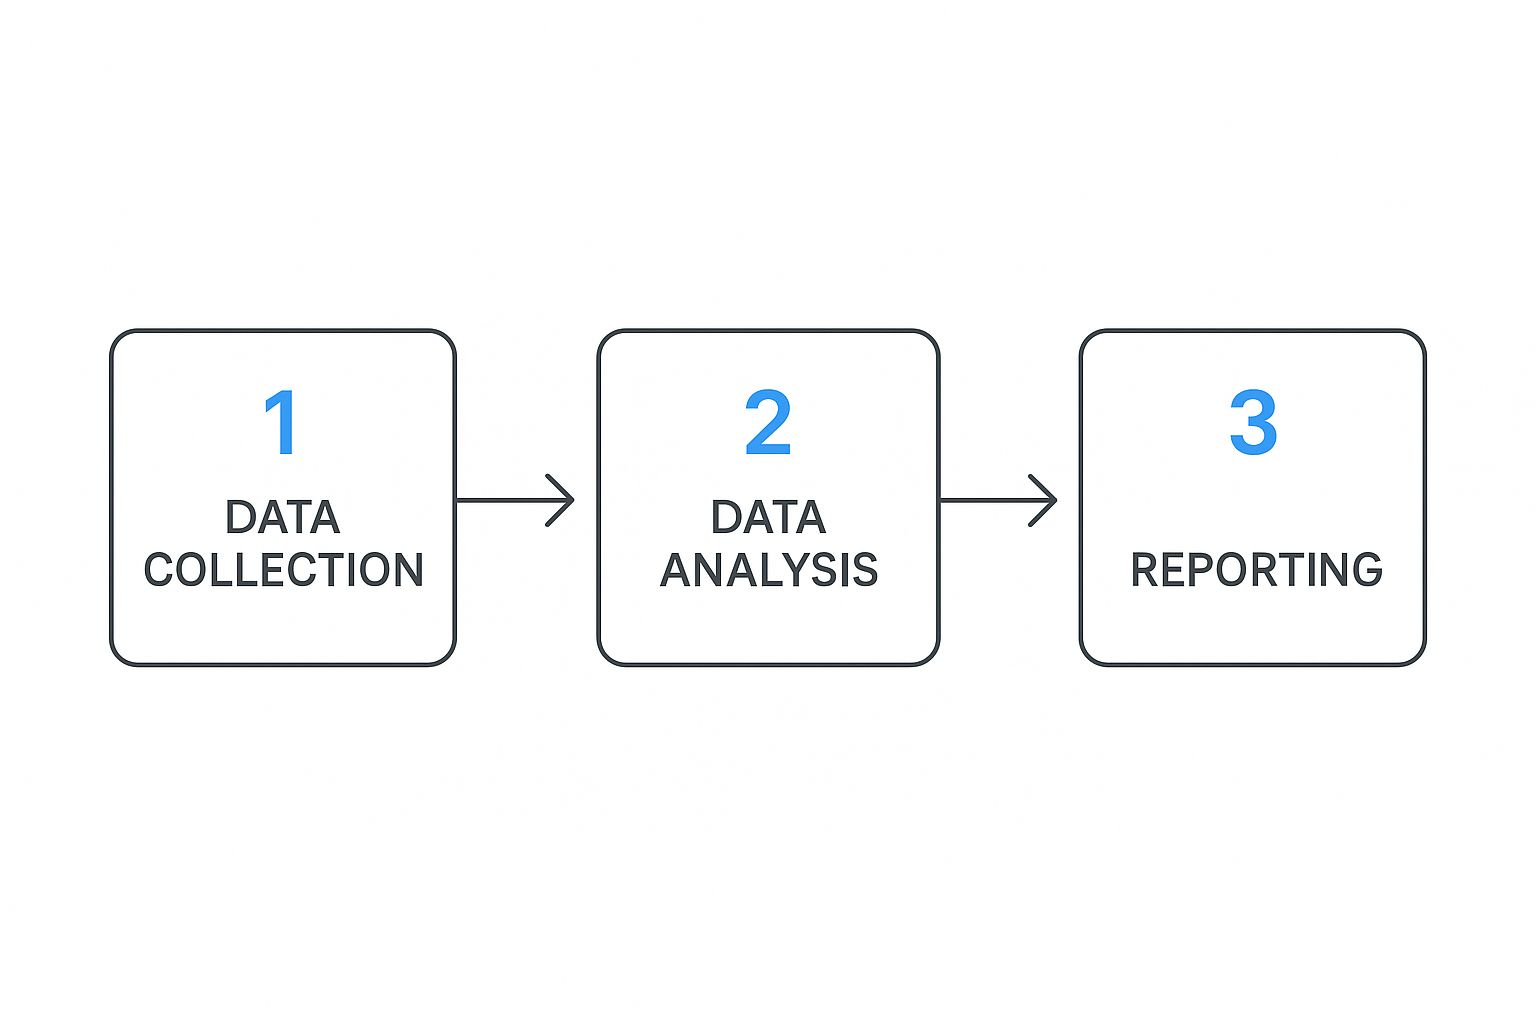
This simple flow really highlights how important a structured approach is. Without careful analysis, all that collected data is just noise.
When deciding how fast to replay your traffic, you need to match the speed to your testing goal. Are you just validating normal behavior, or are you trying to find the absolute ceiling of your infrastructure?
Choosing Your GoReplay Speed and Test Objective
| Replay Speed | Primary Objective | Key Metrics to Watch |
|---|---|---|
| 1x | Baseline Validation | P95/P99 latency, standard error rates, “normal” CPU/memory usage. |
| 2x-3x | Stress Testing | Latency degradation, initial HTTP 5xx errors, resource utilization spikes. |
| 5x-10x+ | Breaking Point Analysis | Skyrocketing error rates, maxed-out CPU/memory, database connection timeouts. |
Ultimately, each speed multiplier tells a different story about your system’s capabilities. Start with your baseline and work your way up to understand the full picture.
Connecting Replay Data with Monitoring Tools
As you run these replays, GoReplay itself spits out some great statistics. But to get the full story, you have to correlate that information with your main monitoring tools, like Prometheus and Grafana. While a replay is running, you should have your dashboards open, watching these key performance indicators (KPIs) like a hawk:
- P95 and P99 Latency: How long are the slowest requests taking? Forget averages; these percentiles are what your users actually feel.
- Error Rates (HTTP 5xx): Are specific endpoints starting to fail as you increase the load? A rising error rate is a clear cry for help from your application.
- CPU and Memory Utilization: Are your servers hitting their physical limits? This will tell you if you have a hardware bottleneck.
- Database Query Times: Is your database the one struggling to keep up? A slow database can bring the whole show to a grinding halt.
A performance baseline isn’t just about the quantity of traffic a system can handle. It’s about the quality of its response under that traffic. This multi-faceted view is crucial for truly understanding your system.
This idea of a multidimensional baseline isn’t just for software. In development finance, for instance, baselines track both the volume of funds distributed and their effectiveness. A comprehensive report on performance baselines in global development finance shows how institutions integrate multiple metrics to measure true impact—a principle we can apply directly.
By watching a wide range of metrics, you build a similarly rich baseline for your own application. This process gives you the hard numbers that officially define what your system is capable of.
From Raw Data to a Validated Baseline
Collecting traffic is just the beginning. The real magic happens when you transform that raw data into a story about your application’s health. This is where you officially establish and validate your performance baseline—the benchmark that will anchor every future deployment and optimization effort.
Your monitoring dashboards are your best friend at this stage. As you replay traffic, you need to be a detective, hunting for clues in the metrics. Look for the connections. Does P95 latency climb when the load increases? Do certain API calls cause a spike in database CPU? The goal isn’t to find one magic number, but to deeply understand the unique personality of your application under real-world pressure.
Defining Your Performance Thresholds
Once you’ve got a feel for the patterns, it’s time to draw some lines in the sand. A validated performance baseline isn’t just a historical record; it’s a contract defining what “good enough” actually means for your system. These thresholds become the non-negotiable quality gates for all future releases.
Based on what you’ve observed during the replay, you might set some hard rules like these:
- The P99 latency for our
/checkoutendpoint absolutely must stay under 800ms. - Our total error rate can’t creep above 0.1% during peak traffic replays.
- CPU utilization on the app servers must remain below 70% under a standard 1x load test.
Suddenly, vague complaints like “the app feels slow” are replaced with objective, data-driven facts. This process of using detailed metrics to ensure system integrity isn’t just for software. Think about how NASA manages its Satellite Laser Ranging network. They use incredibly detailed monthly report cards—tracking successful passes and equipment uptime—to create performance baselines for tracking stations around the globe. It’s the same principle: use hard data to guarantee reliability.
Your baseline needs to be a balance between realistic and ambitious. It should reflect what your system can do today while setting a high standard that protects the user experience tomorrow.
Documenting and Sharing the Baseline
A baseline that lives only in your head is a wasted effort. The final, most crucial step is to document your findings in a clear, accessible report. This document becomes the single source of truth for your system’s performance.
Make sure your baseline report covers:
- The Context: Briefly outline the environment, the time window of the traffic capture, and the tools you used (like GoReplay).
- Key Metrics & Thresholds: This is the core of the report. Clearly list the agreed-upon numbers for latency, errors, and resource usage.
- Dashboard Links: Don’t make people hunt for the data. Provide direct links to the specific monitoring dashboards you used for the analysis.
- Observations & Notes: Jot down any interesting patterns, potential bottlenecks you spotted, or ideas for future investigation.
Getting this report in front of everyone—from developers to product managers—is non-negotiable. It aligns the entire team on what “good performance” really means and shows how their work directly impacts it. This living document is also a fantastic resource for anyone wanting to learn more about boosting application performance through load testing. From this point on, every change to the system will be measured against this validated benchmark.
Common Questions About Performance Baselines
As you start working with GoReplay to build out a performance baseline, a few common questions and roadblocks are bound to pop up. Let’s walk through some of the most frequent ones to clear up key concepts and help you sidestep potential pitfalls.
How Often Should I Update My Performance Baseline?
Think of your performance baseline as a living document, not a one-time snapshot you create and forget. It loses its value the moment it no longer reflects your current production reality. The key is to re-establish it after any significant system change.
So, what counts as a “significant change”?
- Major Code Deployments: Any release that introduces new features, refactors core logic, or alters primary user flows.
- Infrastructure Migrations: Moving to a new cloud provider, changing instance types, or updating your Kubernetes version.
- Shifts in Traffic Patterns: If your user base grows significantly or their behavior changes, your old baseline is no longer representative.
- Key Dependency Updates: Upgrading a core library, database version, or even the language runtime itself can have unexpected performance impacts.
As a rule of thumb, plan to re-evaluate your baseline at least once a quarter, or better yet, in lockstep with your major release cycles. This keeps it a true and reliable benchmark for your system.
The concept of an accurate baseline is absolutely critical in performance engineering. Getting it wrong can lead to wildly incorrect conclusions. A recent deep dive into a CPython performance improvement, for instance, revealed that a perceived 10-15% speedup was mostly an illusion. The real gain was closer to 1-5%. The problem? They were comparing against a flawed baseline caused by a compiler regression. It’s a powerful reminder to always ask, “What am I really comparing against?”
Can I Use GoReplay for an Application with No Traffic?
GoReplay is designed to capture and replay existing traffic, which makes it the perfect tool for applications that already have users. It’s not, however, the right choice for a brand-new application that has never seen live traffic.
For a new app, you’ll first need to generate a synthetic load. Tools like k6, JMeter, or Locust are excellent for this, as they can simulate user journeys and create that initial traffic profile.
Once your application is live and has real user interactions, you can then switch to GoReplay. This lets you create a far more realistic and accurate performance baseline for all your future testing. Our guide on modern performance testing strategies digs into this topic in much more detail.
What Are the Biggest Mistakes to Avoid?
From my experience, the most common pitfalls almost always stem from a lack of careful preparation. Here are the top four mistakes I see people make:
- Capturing traffic during an anomaly: Recording during a flash sale, a system outage, or a public holiday will create a skewed baseline that doesn’t represent normal operations.
- Using an underpowered test environment: If your test server becomes the bottleneck, your results will reflect its limitations, not your application’s actual performance.
- Focusing on a single metric: Obsessing over CPU usage while ignoring latency, error rates, and memory will give you an incomplete and misleading picture of your system’s health.
- Failing to document the baseline: If you don’t record the exact conditions of the test—the code version, infrastructure specs, and traffic profile—future comparisons will be meaningless.
Ready to stop guessing and start measuring? With GoReplay, you can safely capture real user traffic to build a performance baseline you can trust. Eliminate surprises, validate changes with confidence, and ensure your application is always ready for what’s next. Discover the power of GoReplay today.