A Guide to Performance Baseline Testing
Imagine you decide to start running. On your first day, you just run, with no watch, no app, no idea how fast you went. The next day, you feel a bit slower, but how can you be sure? You have no starting point, no reference. That’s what developing without a performance baseline is like.
Performance baseline testing is that crucial first timed run for your software. It creates a definitive, data-backed record of how your application performs under a typical workload, establishing the foundational health check against which all future changes are measured.
What Exactly Is Performance Baseline Testing?
Think of a performance baseline as your application’s unique “fingerprint.” It’s a detailed snapshot—a single source of truth—that captures how your system behaves on a normal day. This isn’t just about one or two speed metrics; it’s a comprehensive record of the key indicators that define its standard operating state.
Without this fingerprint, you’re flying blind. You might get reports that the app feels sluggish, but you have no way to prove it. Was it always this slow on a Tuesday afternoon? Is the new feature deployment really the culprit, or is something else going on? Baseline testing replaces that guesswork with hard data, turning subjective feelings into objective facts.
The Foundation for All Future Analysis
A performance baseline is the absolute first step for any meaningful performance analysis. Every test you run after that—whether it’s a load test, a stress test, or a simple regression check—gets its meaning by comparing its results back to this original benchmark. It provides the “before” picture you need to properly evaluate the “after.”
This is especially critical in modern development, where change is constant. Every new feature, bug fix, or infrastructure tweak can potentially degrade performance. A solid baseline gives your team the power to:
- Isolate Problems Quickly: When a new deployment causes a slowdown, a quick comparison to the baseline immediately flags the deviation. No more hunting in the dark.
- Validate Improvements: Did that big database optimization actually work? The baseline will show you, down to the millisecond, how much response times improved.
- Prevent “Performance Creep”: This is the silent killer of user experience—a slow, gradual degradation from dozens of small, seemingly harmless changes that add up over months until your app is frustratingly slow.
A performance baseline is more than just a set of numbers; it’s a historical contract with your users. It documents the standard of speed and reliability they should expect, holding your team accountable for maintaining that experience with every single update.
Core Components of a Performance Baseline
A truly useful baseline isn’t just one number; it’s a collection of metrics that, when viewed together, tell a complete story. At its core, this discipline is about establishing that starting point by recording critical data under a well-defined, typical load. For instance, if your baseline shows an average response time of 300 milliseconds with 1,000 concurrent users, any future test showing 500ms under the same load is an immediate red flag.
You can explore a deeper dive into how baseline and benchmark testing differ to better understand these concepts. This documented evidence becomes the reference for all future testing, making it possible to catch degradation from new code or infrastructure shifts before your users do.
To build a robust baseline, you need to capture a variety of data points. The table below outlines the essential elements that form a comprehensive performance baseline test.
| Component | Description | Example Metric |
|---|---|---|
| Server-Side Health | Measures the resource consumption on your backend infrastructure. | CPU Utilization below 75% |
| Application Throughput | The number of requests or transactions your system can handle per second. | 500 requests per second (RPS) |
| Response Time | The time it takes from a user’s request to the system’s final response. | Average API response time of 200ms |
| Error Rate | The percentage of requests that result in an error under a specific load. | Less than 0.1% error rate |
By capturing these core components, you create a multi-dimensional view of your application’s health. This rich, historical data is what transforms performance testing from a reactive chore into a proactive strategy for building fast, reliable software.
The Business Case for Baseline Testing

While the metrics behind performance baseline testing are technical, its real value is measured in business outcomes. Establishing a performance baseline isn’t just an engineering chore; it’s a strategic move that directly protects revenue, strengthens your brand, and builds the kind of customer loyalty that lasts.
Think of it as a proactive insurance policy against the steep costs of a slow or unreliable application. Every millisecond of delay, every failed transaction, and every moment of user frustration has a real financial impact. A solid baseline acts as your early warning system, letting you catch costly performance regressions before they ever make it to your customers.
Preventing Revenue Loss and Protecting Your Brand
In e-commerce, speed is a non-negotiable feature. A sluggish product page or a lagging checkout process leads directly to abandoned carts. For a media site, a buffering video is a surefire way to get users to click away. No matter the application, a consistently slow experience erodes confidence and sends your customers looking for faster, more dependable alternatives.
This is where performance baseline testing moves from a technical task to a core business function. When you know your application’s “normal” speed, you can instantly tell when a new code release has introduced a slowdown. This empowers your team to fix the problem before it leads to real damage, like:
- Increased Bounce Rates: Users bailing on your site after viewing just one page because it took too long to load.
- Lower Conversion Rates: Fewer people making a purchase, signing up for your newsletter, or filling out a form.
- Customer Churn: Frustrated customers leaving your service for a competitor due to persistent performance issues.
A performance baseline is your first line of defense against the silent revenue drain caused by slow degradation. It empowers you to protect the user experience, which is ultimately what protects your bottom line.
Building Customer Trust Through Consistency
Trust isn’t built overnight, but it can be lost in an instant. A fast, reliable application signals quality and professionalism. It shows users you value their time and are committed to giving them a great experience. Baseline testing is the engine that ensures this consistency.
When you have a documented standard for performance, you can deliver a predictable experience. Your users learn to trust that your app will just work every single time. That kind of reliability is a powerful competitive edge.
The market reflects this growing focus on user experience. The global performance testing market, which is built on these baselines, was valued at around USD 6.5 billion in 2023 and is on track to hit USD 13.2 billion by 2032. This explosive growth shows just how vital performance is to business success in every sector, from finance to healthcare. You can dive into the complete performance testing market analysis to see how this investment is reshaping entire industries.
Ultimately, investing in performance baseline testing is an investment in your business’s future. It’s a proactive, money-saving measure that stops revenue leaks, shields your brand from a bad reputation, and builds the kind of customer trust that creates a real competitive advantage.
How to Establish a Reliable Performance Baseline
Establishing a solid performance baseline isn’t a guessing game. It’s a structured process that methodically captures a true snapshot of your application’s normal operating state. This journey has a few distinct phases, and each one is critical for building a baseline that’s both meaningful and repeatable.
The whole thing starts long before you even think about running a test. The first, and arguably most important, step is to define clear objectives. You have to ask: what are we actually trying to measure, and why? This means zeroing in on the most critical user journeys in your application—the paths that deliver the most value and are most sensitive to a slowdown.
Think about an e-commerce site. The critical journeys are obvious:
- Searching for a product
- Adding an item to the cart
- Completing the checkout process
By focusing on these key flows, you concentrate your efforts where they’ll have the biggest impact on the business and keep users happy.
Configure a Realistic Test Environment
Once you know what you’re testing, you need the right place to test it. Your test environment absolutely must mirror your production setup as closely as possible. Running tests on a developer’s laptop or an underpowered server will only give you misleading numbers that have no bearing on real-world performance.
A common mistake is testing on shaky or mismatched infrastructure. Your baseline is worthless if the environment itself is a moving target. You need to aim for parity in a few key areas:
- Hardware: CPU, RAM, and disk specs should match.
- Software: Use the same operating system, database versions, and application dependencies.
- Network Configuration: Simulate your production network’s latency and bandwidth.
- Data: Use a dataset that’s similar in size and shape to what’s in production.
Getting this alignment right ensures that the metrics you capture are a genuine reflection of your app’s capabilities, not just an artifact of a flawed setup.
Craft and Execute Realistic Scenarios
With the environment ready, it’s time to design test scenarios that mimic how real people behave. This is where a lot of teams stumble, creating simplistic tests that just don’t capture the messy, complex reality of user interaction. A good baseline test isn’t about hammering one endpoint over and over; it’s about simulating concurrent users, realistic pauses, and a mix of different actions.
This visual gives you a great overview of the core flow for setting up and running your baseline test.
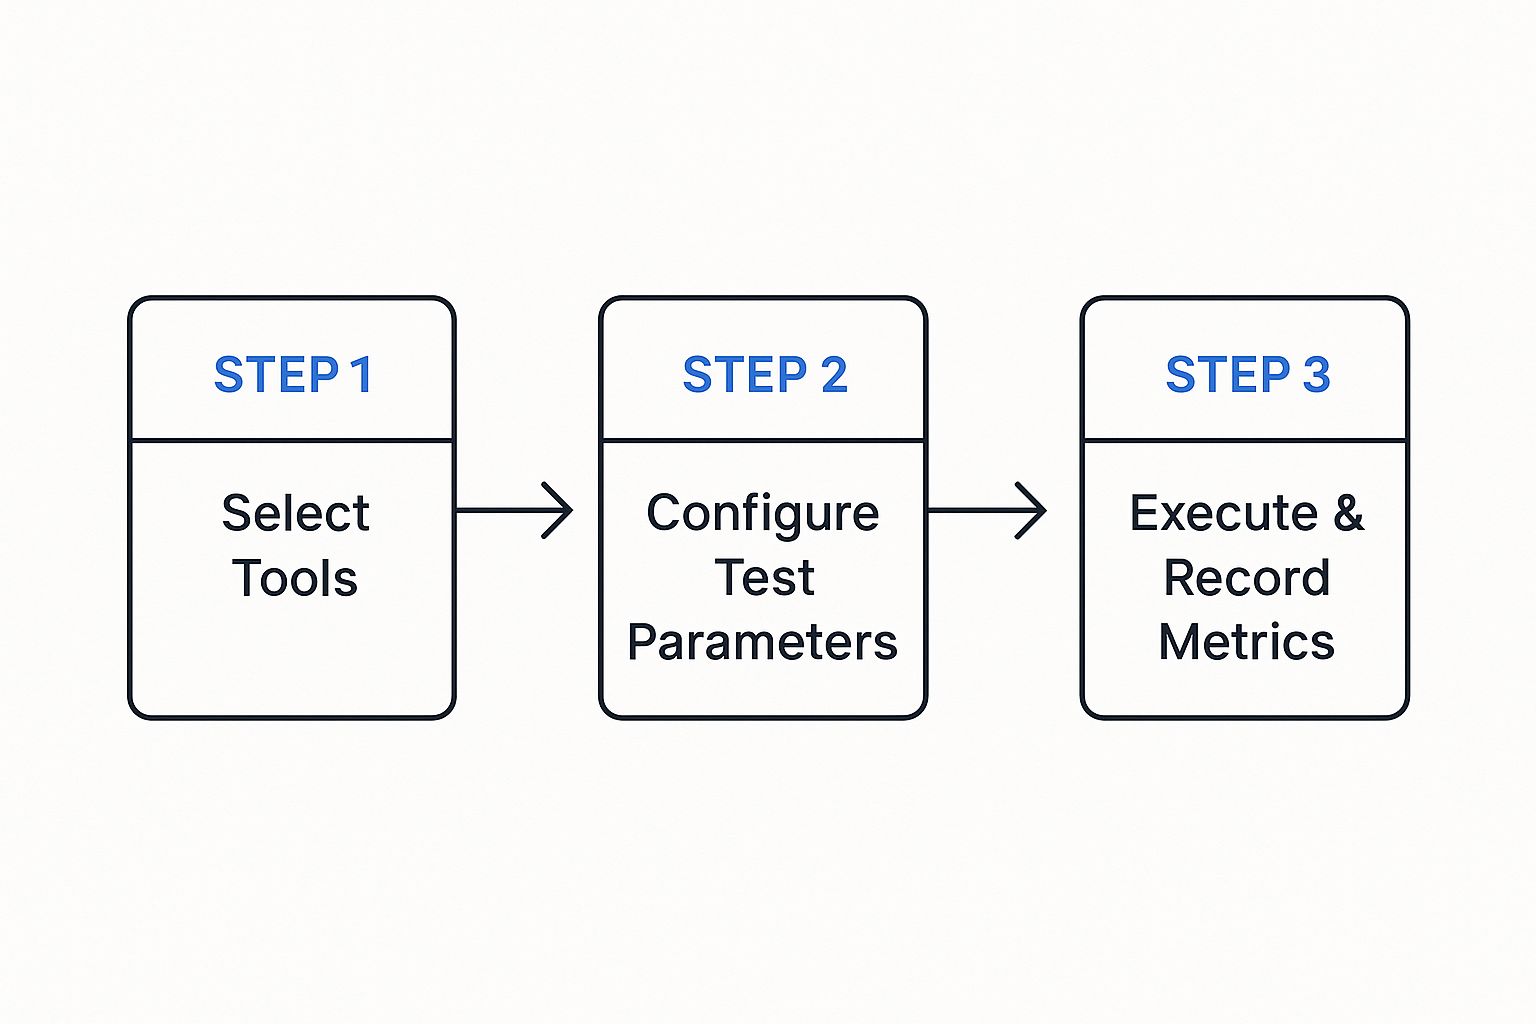
The process here follows a logical progression from picking your tools to collecting metrics, making sure your test is systematic and the data is clean. Once you’ve configured your tools and parameters, you can kick off the test. The goal is to gather pristine data, free from weird anomalies caused by the test itself. Try to run it during a period of low system activity to avoid interference, and let it run long enough to hit a stable state—often called a “warm-up” period.
Analyze and Document the Results
The final phase is where you turn raw data into actionable intelligence. After the test, you’ll be sitting on a mountain of metrics. Your job now is to sift through it all, identify the key performance indicators (KPIs), and document everything in a clear, concise baseline report.
Your baseline report is the “single source of truth” for your application’s performance. It should be easy for both technical and non-technical folks to understand, clearly stating the average response times, throughput, and error rates for each critical user journey you tested.
This document becomes your go-to reference for all future performance analysis. It should be versioned and stored right alongside your code, creating a historical record that lets you track performance trends over time. A well-documented baseline gives your team the power to confidently answer the question, “Is our application getting faster or slower?” with cold, hard data.
Key Metrics You Need To Track

A performance baseline is only as good as the data you put into it. It’s not enough to just run a test; you have to capture the right metrics to truly understand your application’s health.
Think of it like a doctor’s check-up. They don’t just take your temperature and call it a day. They check your heart rate, blood pressure, and breathing to get a complete picture. Your application needs the same holistic approach.
A solid baseline is built on a diverse set of metrics. Each one tells a different part of the performance story, and together they let you move from just seeing a problem to knowing exactly where it’s coming from.
Server-Side Health Metrics
These are the vital signs of your backend infrastructure. When these numbers start to look bad, it’s often the first warning that your system is under strain—sometimes long before your users even notice a problem.
- CPU Utilization: This is a direct measure of how hard your server’s processor is working. If it’s consistently running at over 80%, your server is likely struggling to keep up with requests, which is a recipe for major slowdowns.
- Memory Usage: This tracks the RAM your application is consuming. A sudden jump or a slow, creeping increase can signal a memory leak—a nasty bug that can eventually bring your whole system down.
- Disk I/O (Input/Output): This metric watches how fast your application reads data from and writes data to its storage. For database-heavy apps, slow disk I/O can create a serious bottleneck, causing requests to pile up and wait.
Keeping an eye on these metrics helps answer a simple question: “Does our hardware have what it takes for a normal day?” If any of these are already hitting their limits during a baseline test, it’s a clear sign you need to scale up your infrastructure or optimize your code before you even think about handling more traffic.
Client-Side Performance Metrics
While server health is critical, your users don’t care about CPU utilization—they care about how fast your site feels. Client-side metrics measure performance from their perspective, giving you a direct window into their experience.
A slow website isn’t just an annoyance; it’s a dead end. According to Google, the chance of a user leaving your site jumps by 32% as page load time increases from just one to three seconds. A good client-side baseline is non-negotiable for keeping users around.
Here are the key metrics to watch:
- Time to First Byte (TTFB): This measures the delay between a user clicking a link and their browser receiving the very first piece of data. A slow TTFB almost always points back to a server-side issue. Your backend is simply taking too long to process the request.
- Page Load Time (PLT): This is the big one. It’s the total time it takes for a page to fully appear in the browser, including all scripts, images, and styles. It’s the sum total of network speed, server processing, and browser rendering time.
Tracking these ensures you’re not just building a fast server, but a fast experience. For a deeper dive, check out our guide on the most essential performance testing metrics to ensure top-notch software quality.
Key Transactional Metrics
These metrics bridge the world of your server and your users. They measure the flow of traffic and how successfully your application is handling its core job—processing user actions.
To get a complete view, you need to track several data points. This table breaks down the most critical metrics, what they measure, and why they are so important for a meaningful baseline.
Essential Performance Baseline Metrics
| Metric Category | Specific Metric | What It Measures | Why It’s Important |
|---|---|---|---|
| System Capacity | Throughput (RPS) | The number of requests your system handles per second. | Defines your application’s maximum capacity. A low baseline means it can’t handle much traffic. |
| System Stability | Error Rate | The percentage of requests that fail or return an error (e.g., 500-level errors). | Directly measures stability. An error rate above 0% in a baseline points to hidden bugs. |
| Load Context | Concurrency | The number of users or connections actively using the application at the same time. | Provides crucial context. It helps you understand how performance changes as user load increases. |
| User Experience | Response Time | The total time it takes for the system to process a request and send back a full response. | This is what users feel. Slow response times lead directly to user frustration and abandonment. |
When you put these three categories of metrics together—server, client, and transactional—you create a powerful diagnostic tool.
If a future test shows that response times have shot up, you can immediately check if your server CPU is maxed out or if the error rate has spiked. This turns performance baseline testing from a simple check-the-box exercise into a real strategic advantage.
Tools to Power Your Baseline Testing
Picking the right tool is make-or-break for establishing a solid performance baseline. You can try to gather some metrics by hand, but modern applications are just too complex. You need specialized tools that can simulate real user loads and capture data with precision.
Without them, you’re basically trying to measure a race car’s speed with a sundial. The results won’t just be a little off—they’ll be completely useless. The performance testing world is full of powerful options, most of which are built to help you script user behavior, generate traffic, and make sense of the results.
Traditional and Script-Based Tools
Many teams get their start with well-known, script-based tools. These platforms have been industry workhorses for years, and they offer a ton of functionality if your engineers have the time to really dig in and learn them.
Two of the most popular choices are:
- Apache JMeter: A highly versatile, open-source tool built on Java. It can load test all sorts of services, but it hinges on your ability to manually build test plans by scripting out user scenarios, which can eat up a lot of time.
- Gatling: Another fantastic open-source tool, Gatling is known for its high performance and developer-friendly, code-based approach to writing tests. Just like JMeter, its value depends entirely on how well you can script what you think your users are doing.
The biggest headache with these tools is the scripting itself. Trying to create test scripts that truly capture the chaotic, unpredictable nature of real user traffic is incredibly difficult. It’s also a huge maintenance burden. Every time your application changes, your scripts have to change, too. This is exactly where a different approach to performance baseline testing shines.
GoReplay and Realistic Traffic Shadowing
Instead of trying to simulate reality, what if you could just use it? That’s the whole idea behind GoReplay, an open-source tool that takes a completely different path: it captures and replays your actual production traffic. This technique, often called traffic shadowing, gets rid of all the guesswork and script maintenance.
By replaying real user interactions, you create a baseline test that is a 100% accurate reflection of how your application performs under real-world conditions. It captures every complex user journey, every unexpected API call, and every edge case that manual scripting would almost certainly miss.
This gives you a far more authentic performance baseline. You’re no longer testing against a clean, idealized script of user behavior. You’re testing against the messy, complex reality of your actual traffic.
The image below shows just how straightforward the concept is. GoReplay captures traffic from a source and replays it against your target environment.
This simple visual nails the core value: seamlessly redirecting live traffic to your testing environment for real, authentic analysis. Your baseline isn’t just an approximation; it’s a direct copy of your real-world load.
Establishing a Baseline with GoReplay
Using GoReplay to build a performance baseline is a refreshingly simple process that completely sidesteps the nightmare of creating and maintaining scripts.
- Capture Live Traffic: First, you run the GoReplay listener on your production server. It quietly listens to network traffic on a specific port and saves the requests to a file, all without affecting your live performance.
- Replay in Staging: Next, you take that file of captured traffic and replay it against your staging environment. GoReplay sends the recorded requests to your test server at the exact same rate they originally happened.
- Analyze the Results: While the traffic replay is running, you use your usual monitoring tools to watch the key performance metrics—CPU, memory, response times, and error rates. The results you gather form an incredibly accurate performance baseline.
This traffic-shadowing approach makes performance baseline testing not only more accessible but also way more effective. It guarantees your tests are always relevant and perfectly matched to actual user behavior, giving you a rock-solid foundation for all future performance work.
Best Practices for Maintaining Your Baselines

A performance baseline isn’t a trophy you create once and then stick on a shelf. Its real value comes from keeping it alive and relevant. Think of it like tuning a guitar; it needs constant tweaks to stay in harmony. If you let it sit, your baseline quickly goes out of date, giving you a completely distorted picture of your app’s health.
The key is to treat your baseline as a living document. This means building a rhythm for re-evaluation and weaving checks directly into your development workflow. You’re turning a one-off task into a continuous process that actively guards your user experience.
Re-Baseline After Major Releases
The absolute most critical time to update your baseline is after any big system change. A new feature launch, a migration to a different cloud provider, or a major database schema update can all make your old performance data totally useless. Without a fresh baseline, you’re flying blind—you have no accurate way to judge the true impact of these changes.
After every major deployment, you need to run your full suite of baseline tests to establish the new “normal.” This gives you two huge advantages:
- Immediate Feedback: You instantly know if the new release improved, degraded, or maintained performance under real-world conditions.
- Accurate Future Comparisons: Your reference point is always current, so you can precisely measure how the next round of smaller changes affects things.
Integrate Baselines into Your CI/CD Pipeline
For modern dev teams, the real magic happens when you bring automation into the mix. By integrating lightweight performance tests right into your Continuous Integration/Continuous Deployment (CI/CD) pipeline, you can catch performance regressions automatically with every single commit. This stops performance testing from being a separate, manual chore and makes it a core part of your development culture.
Automating baseline comparisons in your pipeline acts as a vigilant gatekeeper. It can automatically flag a build if a new change causes response times to jump by more than 5% from the baseline, stopping performance issues before they ever get near production.
This constant feedback loop lets developers see the performance impact of their code right away, making it far easier to find and fix problems on the spot. This proactive mindset is a cornerstone of any solid performance testing strategy for modern applications.
Version Your Baseline Reports
You version your source code with tools like Git, right? You should be doing the same thing with your baseline reports. Storing historical performance data alongside the code version it belongs to creates an invaluable record of your application’s journey.
This historical context lets you:
- Track Long-Term Trends: Spot how performance has changed over months or even years, helping you catch that slow, sneaky “performance creep.”
- Correlate Changes with Impact: Easily connect a specific release to a noticeable dip or spike in performance.
- Inform Architectural Decisions: Use hard data from the past to make smarter choices about future development and infrastructure upgrades.
When you adopt these practices, performance baseline testing transforms from a one-time event into a continuous, strategic process. It ensures your baseline remains a trustworthy and powerful tool for building faster, more stable applications.
Got questions about baseline testing? You’re not alone. When engineering teams start weaving this into their workflow, a few common questions always pop up. Getting them answered is the key to turning theory into a practice that actually works.
Let’s clear up some of the most frequent ones. The goal here is to get you comfortable enough to not just know what a baseline is, but to confidently manage it for the long haul.
How Often Should We Update Our Performance Baseline?
There’s no magic number here—it really depends on how fast you ship code. A solid rule of thumb is to re-establish your performance baseline whenever a significant change occurs. Think major feature releases, infrastructure migrations, or big schema changes in your database.
If your team is deep into CI/CD, you can (and should) integrate smaller, automated baseline checks into every single build. But at the very least, you should run a full baseline analysis quarterly. This catches the slow, sneaky performance drains from all those tiny, incremental changes that add up over time.
What Is the Difference Between Baseline and Benchmark Testing?
People often use these terms interchangeably, but they serve two very different purposes. It helps to think of it like this: baselining looks inward, while benchmarking looks outward.
Baseline Testing: This is all about your application’s performance measured against itself. It answers the question, “Where are we now?” For example, you might find that “Our login API responds in 250ms under typical load.” That’s your private standard.
Benchmark Testing: This compares your application’s performance to an external standard, like a direct competitor or an industry average. It answers the question, “How do we stack up against everyone else?”
A baseline is your own private reference point. A benchmark is how you measure up against the competition.
Can I Run Baseline Tests Without a Staging Environment?
While you technically can, it’s a terrible idea. Running performance tests of any kind directly in production is strongly discouraged. It’s incredibly risky. You could easily slow down the experience for live users or, even worse, cause system instability and outages. The potential damage to your customers and your business just isn’t worth it.
A dedicated, production-like staging environment is non-negotiable for getting results that are reliable, repeatable, and safe. This environment needs to be a near-perfect mirror of production—same hardware, software, network setup, and data volume. This is the only way to ensure the numbers you capture are real, without putting your business on the line.
Ready to create baselines with 100% realistic traffic? With GoReplay, you can capture and replay real user interactions, eliminating guesswork and tedious script maintenance. Ensure your next release is rock-solid by testing against reality. Explore GoReplay today.