Staying Ahead of the Curve: Why Network Traffic Monitoring Matters
Network slowdowns and security threats can cripple your business. Effective network traffic monitoring tools are crucial for identifying performance bottlenecks, security vulnerabilities, and ensuring optimal user experience. This listicle presents ten leading network traffic monitoring tools in 2025 – including GoReplay, Wireshark, SolarWinds, and more – to help you pinpoint the perfect solution for your needs. You’ll learn about each tool’s key features and capabilities, enabling you to make informed decisions about optimizing your network performance and bolstering your security posture.
1. GoReplay
GoReplay is a versatile open-source network traffic monitoring tool that captures and replays live HTTP traffic, transforming real user interactions into practical testing scenarios. This makes it an invaluable tool for developers, QA engineers, DevOps professionals, and enterprise IT teams striving to identify and rectify application performance issues before they impact users. GoReplay stands out due to its ability to mirror real-world user traffic with impressive accuracy, using session-aware replay technology that preserves distinct user sessions, implements smart connection pooling, and optimizes TLS/SSL handling. This ensures that tests faithfully represent actual user behavior, providing reliable insights into application performance under real-world conditions. With over 18,000 GitHub stars and a proven track record spanning over 11 years, including adoption by Fortune 500 companies, GoReplay offers a trusted and reliable solution for performance testing and analysis.

GoReplay’s strength lies in its ability to leverage actual user traffic patterns for comprehensive load testing. This enables accurate assessment of application capacity and scalability by subjecting the system to real-world usage scenarios. The tool’s real-time monitoring capabilities and advanced analytics provide deep insights into traffic patterns, enabling proactive alerts and performance tracking. This user-centric approach to performance monitoring allows teams to understand how their applications perform under various conditions, proactively identify potential bottlenecks, and optimize their infrastructure accordingly. The simplicity of GoReplay is another key advantage. Deploying it is often as straightforward as executing a single command to start capturing user interactions and converting them into reusable test cases, all without disrupting the live environment.
For enterprise-level needs, GoReplay Pro offers a range of enhanced features. These include advanced traffic storage options for extended analysis, data masking functionalities to ensure security and compliance requirements are met, support for WebSockets, and a sophisticated analytics dashboard for visualizing key metrics. The Pro version is further complemented by priority expert support and a commercial license, providing peace of mind for organizations relying on GoReplay for critical production traffic testing. Learn more about GoReplay and the critical role it plays in API monitoring. Case studies, such as ResDiary’s successful cloud migration using GoReplay, further demonstrate its effectiveness and reliability in complex real-world scenarios. These endorsements, combined with widespread use among enterprise teams for production traffic testing, solidify GoReplay’s position as a leading choice for reality-driven testing.
GoReplay offers flexible pricing plans to cater to different needs, ranging from a free and open-source edition ideal for individual developers to the feature-rich GoReplay Pro designed for enterprise deployments. While specific pricing for the Pro version isn’t publicly listed and requires contacting the sales team, this tiered approach ensures that both individual users and large organizations have access to a suitable version of the tool. This makes it an attractive solution for organizations looking to scale their testing efforts.
While powerful, GoReplay’s command-line interface and focus on HTTP traffic may present a slight learning curve for users unfamiliar with traffic replay or those needing to analyze non-HTTP protocols. Additionally, the advanced features and dedicated support offered in the Pro version, while valuable, may represent a significant investment for smaller teams or startups. This potential cost barrier is an important consideration for budget-conscious organizations. However, considering its comprehensive capabilities and proven efficacy, GoReplay remains a highly recommended network traffic monitoring tool for organizations prioritizing real-world performance testing and analysis.
2. Wireshark
Wireshark is arguably the world’s foremost free and open-source network protocol analyzer, making it an indispensable tool for anyone involved in network traffic monitoring. Whether you’re troubleshooting network issues, analyzing security threats, or simply trying to understand the flow of data across your network, Wireshark provides the depth and breadth of features necessary for a comprehensive analysis. Its ability to capture and dissect network traffic in real-time, combined with its extensive protocol support and powerful filtering options, sets it apart as the gold standard in network traffic analysis. Its origins as Ethereal, and subsequent evolution into Wireshark, have cemented its position as the de facto standard for network professionals, academics, and security researchers alike. This makes it a critical addition to any list of essential network traffic monitoring tools.

For software developers, Wireshark offers a crucial window into the network interactions of their applications. By capturing and analyzing the packets exchanged between client and server, developers can pinpoint performance bottlenecks, identify communication errors, and ensure their applications adhere to specified protocols. Quality Assurance Engineers can leverage Wireshark to replicate and diagnose network-related bugs reported by users. Its ability to capture specific traffic flows based on various filters allows for precise isolation of problematic communication patterns.
Enterprise IT teams rely on Wireshark for diverse network traffic monitoring tasks, ranging from troubleshooting connectivity issues and identifying security breaches to optimizing network performance and capacity planning. DevOps professionals can integrate Wireshark into their continuous integration and continuous delivery (CI/CD) pipelines to proactively detect and address network-related issues during development and deployment. Even tech-savvy business leaders can benefit from a high-level understanding of Wireshark’s capabilities, allowing them to make informed decisions regarding network infrastructure and security investments.
Wireshark excels in its ability to perform deep packet inspection across hundreds of protocols, providing detailed decoding of each layer of the network stack. This allows users to see exactly what data is being transmitted, identify potential security vulnerabilities, and understand the intricacies of complex network interactions. The powerful filtering capabilities, using both display and capture filters, enable users to isolate specific traffic flows of interest, making it easier to analyze large volumes of data.
Features and Benefits:
- Live Capture and Offline Analysis: Capture network traffic in real-time or analyze previously saved capture files.
- Deep Packet Inspection: Analyze hundreds of protocols with detailed decoding down to the individual bits.
- Powerful Filtering: Use display filters to isolate specific packets within a capture and capture filters to selectively capture traffic.
- Cross-Platform Support: Runs seamlessly across Windows, macOS, Linux, and Unix environments.
- VoIP Analysis: Dedicated features for analyzing Voice over IP traffic, including call setup, signaling, and media streams.
- Extensive Documentation and Community Support: A vast library of documentation and a large, active community provide ample resources for learning and troubleshooting.
Pros:
- Free and Open-Source: No licensing costs, allowing for widespread adoption and community contributions.
- Detailed Packet-Level Analysis: Unmatched depth of analysis for understanding network communication at the lowest level.
- Extensive Protocol Support: Covers virtually all common and many niche network protocols.
Cons:
- Steep Learning Curve: Requires a significant time investment to master its powerful features and interpret results effectively.
- Overwhelming for Simple Tasks: Its extensive functionality can be overkill for simple monitoring scenarios.
- Expertise Required for Interpretation: Effectively analyzing and interpreting the captured data requires a solid understanding of networking principles and protocols.
Getting Started with Wireshark:
- Download and Install: Download the appropriate version for your operating system from the official website (https://www.wireshark.org).
- Select the Network Interface: Choose the network interface you wish to monitor.
- Start Capturing: Initiate the capture process to begin recording network traffic.
- Apply Filters: Use display or capture filters to refine the captured data and focus on specific traffic flows.
- Analyze the Packets: Examine the captured packets in detail, utilizing the various decoding and analysis tools available.
While Wireshark’s complexity might seem daunting initially, the wealth of online resources, including tutorials and documentation, make the learning process manageable. The powerful capabilities and unparalleled depth of analysis offered by Wireshark make it an indispensable network traffic monitoring tool for any serious network professional.
3. SolarWinds Network Performance Monitor
SolarWinds Network Performance Monitor (NPM) is a robust and comprehensive network traffic monitoring tool designed to provide enterprise-level visibility and control over complex network infrastructures. It’s a popular choice for organizations needing real-time insights into network performance, bandwidth usage, and device health, allowing them to proactively address potential issues before they impact end-users. NPM goes beyond simple monitoring by offering automated network discovery, intelligent alerting, and in-depth performance analysis, making it a valuable tool for maintaining optimal network performance. This makes it an essential tool for any team responsible for maintaining a high-performing and reliable network. From identifying bandwidth hogs to troubleshooting network latency, SolarWinds NPM equips IT professionals with the tools they need to ensure smooth network operations.
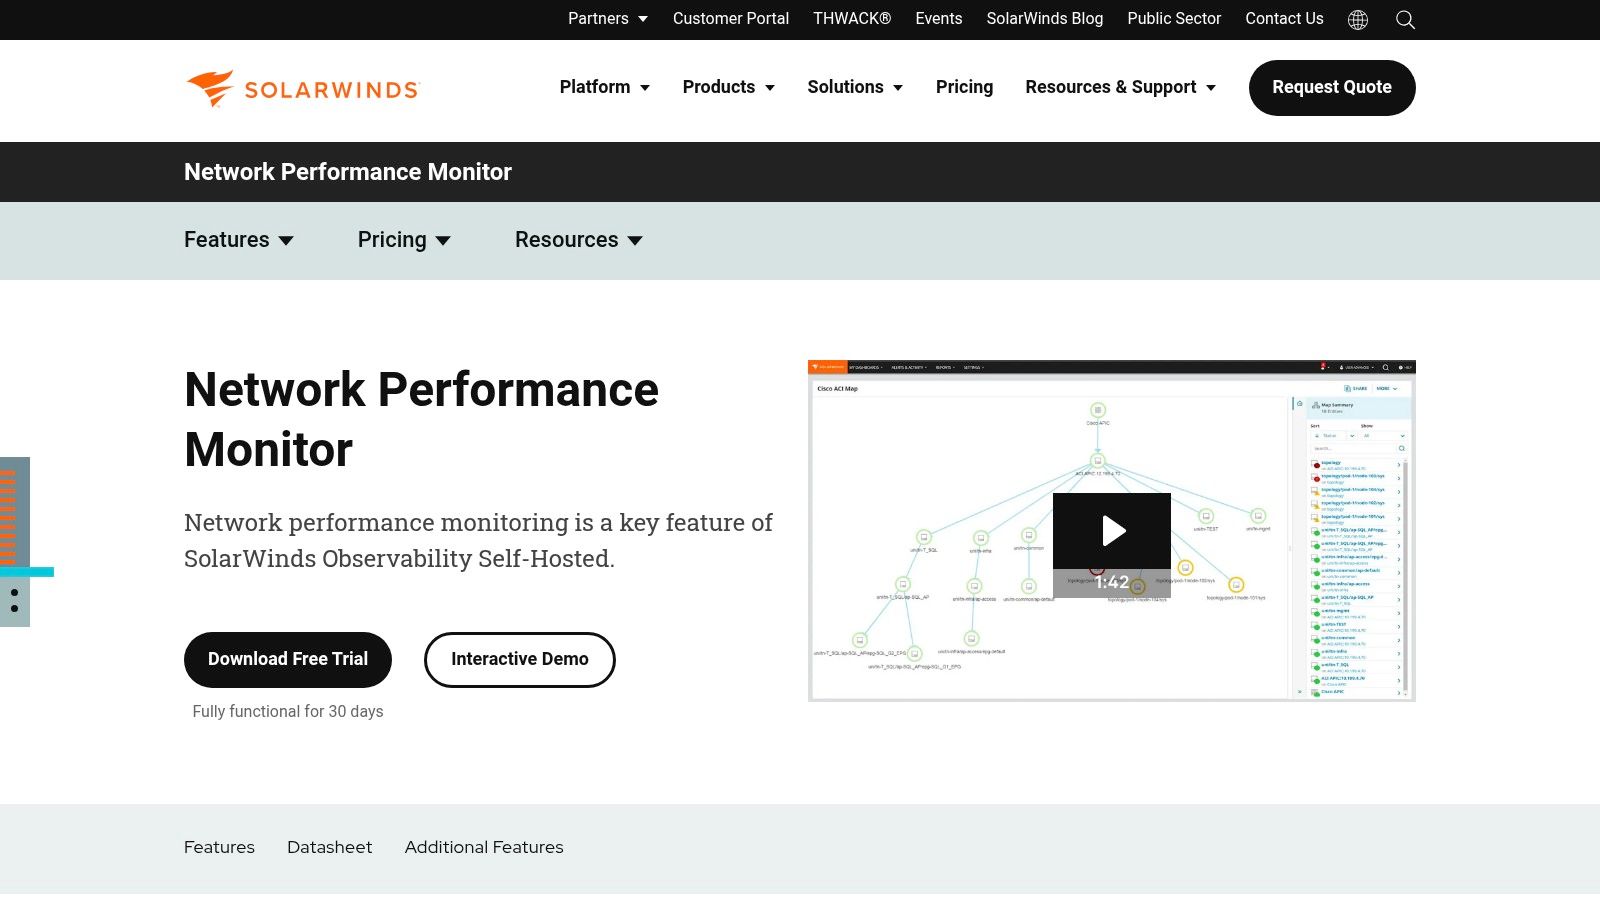
One of the key strengths of SolarWinds NPM is its automated network discovery and mapping capability. It uses SNMP to automatically scan the network, identify connected devices, and build a visual representation of the network topology. This feature simplifies network management by providing a clear overview of the entire infrastructure, including routers, switches, servers, and other network devices. This automatic discovery and mapping feature is particularly beneficial in dynamic environments where devices are frequently added or removed.
For software developers and DevOps professionals, NPM offers invaluable insights into network performance, helping to identify potential bottlenecks that might be impacting application performance. Quality Assurance Engineers can leverage NPM to monitor network conditions during testing, ensuring that test results are accurate and reflect real-world scenarios. Enterprise IT teams benefit from the comprehensive monitoring and alerting features, allowing them to proactively manage network health and prevent outages. Tech-savvy business leaders can use NPM’s reporting capabilities to gain a high-level understanding of network performance and its impact on business operations. For example, identifying periods of high bandwidth consumption can inform decisions about network upgrades or capacity planning.
SolarWinds NPM uses a combination of SNMP polling and packet analysis to monitor network traffic and device performance. This dual approach provides a granular view of network activity, allowing administrators to pinpoint the root cause of performance issues quickly. The platform also offers customizable dashboards and reports, enabling users to tailor the information displayed to their specific needs. These dashboards can be configured to show key metrics such as bandwidth utilization, latency, packet loss, and device availability, providing a comprehensive overview of network health.
Key Features and Benefits:
- Automated Network Discovery and Mapping: Automatically discovers and maps network devices, simplifying network management.
- Real-time Network Performance Monitoring: Provides real-time visibility into network performance metrics with customizable dashboards.
- Intelligent Alerting System: Offers an intelligent alerting system with root cause analysis to proactively address network issues.
- NetPath Network Path Analysis: Provides detailed hop-by-hop analysis of network paths for effective troubleshooting.
- Integration with other SolarWinds Products: Integrates seamlessly with other SolarWinds products for unified monitoring and management.
Pros:
- User-friendly Interface: Intuitive and easy-to-navigate interface with excellent visualization capabilities.
- Comprehensive Network Discovery and Mapping: Powerful automated discovery and mapping features for simplified network management.
- Strong Reporting and Alerting Capabilities: Provides customizable reports and alerts for proactive network management.
- Good Scalability: Scales well to accommodate large and complex enterprise network environments.
Cons:
- Expensive Licensing Costs: Can be expensive, particularly for smaller organizations.
- Resource Intensive: Can be resource-intensive on monitoring servers, requiring adequate hardware resources.
- Limited Customization: Offers limited customization options in some areas.
- Windows-Centric: Primarily focused on Windows environments, although it does support monitoring of other operating systems.
Pricing and Technical Requirements: SolarWinds NPM licensing is based on the number of elements being monitored. Contact SolarWinds directly for detailed pricing information. System requirements vary depending on the scale of deployment but generally require a Windows server environment.
Implementation Tips:
- Plan your deployment carefully: Consider the size and complexity of your network when planning your NPM deployment.
- Utilize the automated discovery features: Take advantage of the automated network discovery and mapping capabilities to streamline the initial setup process.
- Customize dashboards and alerts: Configure dashboards and alerts to focus on the specific metrics that are most important to your organization.
Website: https://www.solarwinds.com/network-performance-monitor
SolarWinds NPM provides a powerful set of network traffic monitoring tools that are essential for maintaining optimal network performance. Its comprehensive features, combined with its user-friendly interface, make it a valuable asset for any IT team responsible for managing a complex network infrastructure. While the cost may be a factor for some organizations, the benefits of proactive network monitoring and improved network performance often outweigh the expense. It compares favorably to other tools like PRTG Network Monitor and ManageEngine OpManager, offering a strong balance of features and usability.
4. PRTG Network Monitor
PRTG Network Monitor, developed by Paessler, stands out as a comprehensive all-in-one solution for network traffic monitoring. Unlike tools focused solely on network traffic, PRTG extends its capabilities to encompass server and application monitoring, consolidating these crucial functions within a single, unified platform. This makes it an exceptionally valuable tool for IT teams seeking a holistic view of their entire IT infrastructure’s performance. For organizations needing to monitor everything from network bandwidth usage to server CPU load and application response times, PRTG offers a centralized management approach simplifying oversight and troubleshooting. Its ability to leverage various monitoring technologies, including SNMP, WMI, packet sniffing, and flow protocols, provides granular visibility into network traffic, enabling IT teams to pinpoint bottlenecks, identify anomalies, and proactively address potential performance issues. PRTG empowers organizations to optimize network performance and ensure the smooth operation of critical business applications.

One of PRTG’s key strengths lies in its user-friendly nature. The intuitive web-based interface features customizable dashboards and interactive maps, presenting complex network data in an easily digestible format. This accessibility extends to both technical and non-technical users, empowering business leaders and other stakeholders to gain insights into network performance without requiring deep technical expertise. Learn more about PRTG Network Monitor This accessibility facilitates better communication and collaboration across different teams within an organization. Furthermore, dedicated mobile apps for iOS and Android provide on-the-go access to network monitoring data, ensuring IT teams can stay informed and respond to critical alerts even when away from their workstations.
PRTG offers a flexible, sensor-based pricing model. Each monitored element, whether a port, a server, or a specific application metric, consumes one sensor. This granular approach allows organizations to tailor their monitoring setup to their specific needs and budget. While this model offers excellent value for smaller deployments, costs can escalate as the number of monitored elements grows. Therefore, careful planning and sensor allocation are crucial for larger organizations to manage costs effectively. For example, a small business monitoring a few servers and network devices might find PRTG very cost-effective, while a large enterprise with hundreds of servers and complex network infrastructure might require a substantial investment.
From a technical perspective, PRTG is relatively straightforward to set up and configure. The auto-discovery feature simplifies the initial setup process, automatically identifying devices and services on the network. However, while the user-friendly interface is a boon for most users, advanced users might find the customization options somewhat limited compared to more specialized network traffic monitoring tools. The reporting capabilities, while functional, could be more robust, particularly for generating in-depth analytical reports. Additionally, PRTG’s Windows-centric architecture might present compatibility challenges for organizations operating in heterogeneous environments.
Key Features of PRTG Network Monitor:
- All-in-one monitoring: Covers network devices, servers, and applications.
- Web-based interface: Customizable dashboards and maps provide a clear overview.
- Multiple monitoring technologies: SNMP, WMI, Packet Sniffing, and Flow protocols offer comprehensive visibility.
- Mobile Apps: iOS and Android apps enable remote monitoring and alerts.
- Flexible alerting system: Multiple notification methods ensure timely responses to critical issues.
Pros:
- User-friendly interface simplifies network monitoring.
- Quick setup and easy configuration reduce deployment time.
- Sensor-based pricing provides flexibility and good value for smaller deployments.
- Excellent mobile applications offer on-the-go monitoring.
Cons:
- Costs can escalate with increasing sensor requirements.
- Limited customization options for advanced users.
- Reporting capabilities could be enhanced.
- Windows-centric architecture may limit cross-platform compatibility.
Website: https://www.paessler.com/prtg
PRTG Network Monitor deserves its place on this list due to its comprehensive monitoring capabilities, user-friendly interface, and flexible pricing model. While it may not be the ideal choice for organizations requiring highly specialized network traffic analysis or advanced customization, its all-in-one approach and ease of use make it a powerful and valuable tool for a broad range of users, from small businesses to large enterprises. Its ability to correlate network traffic data with server and application performance metrics provides valuable context for troubleshooting and optimization, enabling IT teams to proactively maintain the health and performance of their entire IT infrastructure.
5. Nagios
Nagios is a venerable open-source monitoring system renowned for its comprehensive approach to IT infrastructure management. While often associated with server and application monitoring, Nagios offers robust capabilities for network traffic monitoring tools, empowering organizations to proactively identify and address network issues before they impact business operations. Its highly customizable nature and extensive plugin ecosystem make it a versatile choice for organizations of all sizes. Nagios helps pinpoint bandwidth bottlenecks, track latency issues, and monitor critical network devices, ensuring optimal network performance and availability.
For over two decades, Nagios has been a cornerstone in the network monitoring landscape. Its longevity speaks volumes about its reliability and adaptability. Nagios offers two primary versions: Nagios Core, the free and open-source offering, and Nagios XI, the commercially licensed version with enhanced features and a more user-friendly interface. Both versions offer extensive network traffic monitoring capabilities, making it a compelling option for organizations seeking a powerful yet flexible solution. Network administrators can leverage Nagios to monitor various network metrics, such as bandwidth utilization, packet loss, and latency, providing invaluable insights into network health and performance.
Nagios leverages a plugin-based architecture, which contributes significantly to its flexibility. This allows users to extend Nagios’s functionality to monitor virtually any network device or service. Through readily available or custom-developed plugins, Nagios can monitor routers, switches, firewalls, load balancers, and more. This extensibility makes Nagios suitable for diverse network environments, from small businesses to large enterprises with complex network infrastructures. For example, a DevOps team can use Nagios to monitor the performance of their cloud-based network infrastructure, while a security team can leverage it to detect and alert on suspicious network activity.
One of Nagios’s strengths lies in its highly customizable monitoring checks and thresholds. Users can define specific metrics to monitor and set thresholds that trigger alerts when those metrics exceed pre-defined limits. This granular control allows organizations to tailor their network traffic monitoring tools to their specific requirements and proactively address potential issues before they escalate. For instance, an e-commerce company can configure Nagios to monitor website traffic and trigger alerts if latency exceeds a certain threshold, ensuring a seamless online shopping experience for their customers.
While Nagios is a powerful and flexible tool, it’s important to acknowledge its complexities. The learning curve can be steep, especially for those new to network monitoring. Configuring Nagios Core can be challenging, requiring significant time investment and technical expertise. The user interface, particularly in the open-source version, can feel outdated compared to some modern network traffic monitoring tools. However, the commercial version, Nagios XI, offers a more intuitive web-based interface, simplifying configuration and management.
Nagios Core is available at no cost, making it an attractive option for organizations with limited budgets. However, setting up and maintaining Nagios Core requires considerable technical expertise. Nagios XI, the commercial version, offers a more streamlined experience and advanced features, but it comes with a price tag. The cost of Nagios XI varies based on the number of monitored devices, making it essential to carefully evaluate the pricing structure and compare it with other commercial network traffic monitoring tools available.
For those considering implementing Nagios, starting with the open-source version (Nagios Core) is often recommended. This provides a valuable opportunity to explore its capabilities and understand its complexities without any financial commitment. Abundant online resources, including community forums and documentation, can assist users in navigating the learning curve. Once comfortable with Nagios Core, organizations can then consider upgrading to Nagios XI for its enhanced features and user-friendly interface.
Despite its complexities, Nagios remains a powerful and versatile network traffic monitoring tool. Its open-source nature, extensive plugin library, and highly customizable monitoring checks make it a compelling choice for organizations seeking granular control over their network monitoring strategy. While the learning curve can be steep, the vast community support and proven reliability in enterprise environments make Nagios a worthwhile investment for organizations dedicated to maintaining optimal network performance and availability. Its website (https://www.nagios.org) provides comprehensive documentation and resources to aid implementation.
6. Zabbix
Zabbix stands out as a powerful and versatile open-source solution among the leading network traffic monitoring tools. Designed for comprehensive monitoring across networks, servers, applications, and services, Zabbix offers a robust feature set that rivals many commercial alternatives. Its real-time monitoring capabilities, coupled with a web-based interface, provide valuable insights into network performance, enabling proactive identification and resolution of potential bottlenecks or outages. This makes Zabbix a compelling choice for organizations of all sizes, from startups to large enterprises, seeking a cost-effective yet powerful network traffic monitoring solution. Its ability to leverage various data collection methods, including SNMP, IPMI, JMX, and custom scripts, offers flexibility in adapting to diverse network infrastructures.

One of Zabbix’s key strengths is its scalability. Built to handle large-scale monitoring deployments with millions of metrics, it caters specifically to the demands of growing businesses and complex network environments. This scalability, combined with its distributed monitoring architecture, allows organizations to monitor geographically dispersed networks and data centers efficiently. Whether you’re tracking bandwidth utilization, analyzing network latency, or monitoring the health of critical network devices, Zabbix provides the tools and flexibility to gain a comprehensive understanding of your network traffic.
For software developers, Zabbix integrates seamlessly into existing development workflows, providing crucial insights into application performance and resource utilization. Quality Assurance Engineers can leverage Zabbix to monitor the performance of test environments and identify potential issues before they impact end-users. Enterprise IT teams benefit from Zabbix’s comprehensive monitoring capabilities, allowing them to proactively manage network infrastructure and ensure optimal uptime. DevOps professionals can integrate Zabbix into their CI/CD pipelines for automated performance monitoring and alerting. Tech-savvy business leaders can use Zabbix’s reporting features to gain a high-level overview of network performance and identify areas for optimization.
Key Features and Benefits:
- Real-Time Monitoring with Web-based Dashboard: Access real-time performance data and visualize network traffic trends through an intuitive web interface. This allows for immediate identification of anomalies and performance bottlenecks.
- Auto-Discovery of Network Devices and Services: Automatically discovers and monitors new devices and services added to the network, simplifying deployment and reducing manual configuration efforts.
- Flexible Data Collection Methods: Supports a wide range of data collection methods, including SNMP, IPMI, JMX, and custom scripts, providing flexibility in monitoring diverse network components.
- Advanced Visualization: Offers advanced visualization tools including graphs, network maps, and customizable screens, enabling clear and concise representation of complex network data.
- Distributed Monitoring Architecture: Facilitates large-scale deployments by distributing monitoring tasks across multiple servers, enhancing scalability and resilience.
Pros:
- Completely Free and Open-Source: Eliminates licensing costs, making it an attractive option for organizations seeking a cost-effective solution.
- Highly Scalable for Large Environments: Designed to handle millions of metrics and monitor large, distributed networks.
- Professional-Grade Features: Offers a comprehensive set of monitoring features comparable to commercial solutions.
- Active Development and Regular Updates: Benefits from an active community and receives regular updates, ensuring ongoing improvements and bug fixes.
Cons:
- Complex Setup and Configuration: Requires a certain level of technical expertise to configure and manage effectively.
- User Interface Can Be Overwhelming Initially: The feature-rich interface can be challenging for new users to navigate initially.
- Requires Database Management Knowledge: Requires a database backend (MySQL, PostgreSQL, Oracle, DB2, etc.) and basic database administration knowledge.
- Limited Built-in Reporting Compared to Commercial Solutions: While offering basic reporting, it may lack the advanced reporting features found in some commercial tools.
Technical Requirements: A server running a supported operating system (Linux, Unix, Windows) and a compatible database system (MySQL, PostgreSQL, Oracle, DB2, etc.) are required. The server’s hardware resources (CPU, RAM, disk space) should be scaled according to the size and complexity of the monitored environment.
Implementation Tips: Start by monitoring a small subset of your network infrastructure before scaling up. Familiarize yourself with Zabbix’s documentation and community resources. Consider using pre-configured templates to simplify the initial setup process. Invest time in properly configuring alerts to avoid notification fatigue.
Website: https://www.zabbix.com
Zabbix presents a compelling value proposition for organizations seeking a robust, scalable, and cost-effective network traffic monitoring tool. While the initial setup and configuration process can be challenging, the wealth of features and the active community support make Zabbix a valuable asset for maintaining optimal network performance and ensuring business continuity. It’s a worthy contender against both open-source and commercial tools, offering a compelling blend of performance, flexibility, and cost-effectiveness. For those willing to invest the time and effort in mastering its capabilities, Zabbix offers an exceptional network traffic monitoring solution.
7. ManageEngine OpManager
ManageEngine OpManager is a robust network traffic monitoring tool that provides comprehensive visibility into your network’s performance and health. This makes it an excellent choice for organizations looking for a centralized platform to manage their network infrastructure. From small to medium-sized businesses to large enterprise environments, OpManager offers a scalable and affordable solution for keeping your network running smoothly. Its ability to automate network discovery, provide real-time monitoring, and offer efficient fault management capabilities places it firmly amongst the top contenders in the network traffic monitoring tools landscape. It’s particularly well-suited for teams needing a powerful yet easy-to-deploy solution for maintaining optimal network performance and quickly identifying and resolving network issues.

OpManager excels at automating the often tedious task of network discovery and mapping. With over 2000 device templates, it can quickly identify and categorize devices on your network, providing a clear visual representation of your network topology. This automated discovery is crucial for maintaining an accurate and up-to-date understanding of your network infrastructure, especially in dynamic environments. This feature significantly simplifies network administration, freeing up IT teams to focus on more strategic initiatives.
Real-time network performance monitoring is another key strength of OpManager. The tool provides detailed metrics on bandwidth usage, latency, packet loss, and other critical performance indicators. This granular level of monitoring enables proactive identification of potential bottlenecks and performance degradation, allowing for timely intervention before they impact end-users. This is especially important for businesses that rely heavily on their network infrastructure for critical operations.
Beyond basic monitoring, OpManager provides Layer 2 network mapping and switch port mapping. This feature allows administrators to visualize the physical connections within their network, pinpoint the location of devices, and track port utilization. This level of detail is invaluable for troubleshooting connectivity issues and optimizing network performance. For example, identifying a heavily congested switch port can lead to proactive upgrades or redistribution of traffic, preventing potential network slowdowns.
OpManager also offers network configuration management and compliance features. This allows administrators to track changes to device configurations, enforce security policies, and ensure compliance with industry regulations. This is particularly useful for organizations operating in regulated industries where maintaining strict compliance is paramount. Furthermore, OpManager integrates workflow automation for incident management, allowing teams to streamline their response to network events and resolve issues more efficiently. Automating tasks like sending notifications, escalating tickets, and running diagnostic scripts significantly reduces the mean time to resolution (MTTR), minimizing the impact of network disruptions on business operations.
While OpManager offers a comprehensive suite of features, it’s important to consider its limitations. The interface, while feature-rich, can feel cluttered at times, especially for new users. Some advanced features require additional modules, which can add to the overall cost. Furthermore, customization options for dashboards are somewhat limited compared to other network traffic monitoring tools. Lastly, while generally performant, OpManager can experience occasional performance issues with very large deployments, something to consider for large enterprise networks.
Pricing and Technical Requirements:
Pricing for ManageEngine OpManager is based on the number of devices monitored and starts with a free edition for monitoring up to 10 devices. Paid editions offer more advanced features and support for larger networks. Detailed pricing information can be found on the ManageEngine website. Technical requirements vary depending on the deployment size but generally require a server running Windows or Linux with sufficient resources to handle the monitoring load.
Comparison with Similar Tools:
Compared to other network traffic monitoring tools like PRTG Network Monitor and SolarWinds Network Performance Monitor, OpManager offers a competitive price point, especially for smaller to medium-sized businesses. While it might not have the same level of polish and customization as some of the higher-end enterprise solutions, it provides a comprehensive feature set out of the box.
Implementation and Setup Tips:
Implementing OpManager is relatively straightforward. The software provides a guided setup process that helps with initial configuration and device discovery. It’s recommended to start with a smaller subset of your network during initial deployment and gradually expand monitoring coverage as needed. Leveraging the extensive documentation and excellent technical support provided by ManageEngine can significantly ease the implementation process.
Conclusion:
ManageEngine OpManager offers a powerful and affordable solution for network traffic monitoring. Its comprehensive feature set, ease of deployment, and competitive pricing make it a valuable tool for organizations of all sizes. While the interface can feel cluttered at times and some advanced features require additional modules, its strengths in automated discovery, real-time monitoring, and fault management make it a compelling choice for businesses seeking a centralized platform to manage their network infrastructure. For more information and to download a free trial, visit https://www.manageengine.com/network-monitoring.
8. Ntopng: Deep Dive into Network Traffic Flows
Ntopng stands as a powerful and versatile network traffic monitoring tool, earning its place on this list due to its comprehensive flow-based analysis, real-time monitoring capabilities, and modern web interface. It’s the successor to the widely-used ntop, significantly improving upon its predecessor with enhanced features and a more user-friendly experience. Ntopng provides invaluable insights into network usage patterns, application performance, and potential security threats, making it a valuable asset for anyone managing network infrastructure. This tool is particularly well-suited for identifying bandwidth hogs, troubleshooting network slowdowns, and gaining a granular understanding of how your network resources are being utilized.

Ntopng excels in flow-based monitoring, leveraging industry-standard protocols like NetFlow, sFlow, and IPFIX to collect and analyze network traffic data. This allows it to efficiently process vast amounts of data, providing detailed statistics about network protocols, applications, and user behavior. For example, you can quickly identify which applications are consuming the most bandwidth, pinpoint users experiencing latency issues, and detect unusual traffic patterns that might indicate a security breach. This granular level of detail empowers IT teams to proactively address performance bottlenecks and strengthen network security.
This open-source network traffic monitoring tool offers a professional paid version with additional features. Ntopng’s responsive web interface delivers real-time traffic analysis, presenting information in an easily digestible format with interactive charts and graphs. This allows administrators to quickly assess network health, identify top talkers, and drill down into specific flows for deeper investigation. The historical data analysis feature, powered by RRD integration, enables long-term trend analysis and capacity planning. Furthermore, the integrated REST API opens up possibilities for integration with other tools, allowing for customized monitoring dashboards and automated reporting.
Key Features and Benefits:
- Real-time traffic analysis: Monitor network activity as it happens, enabling immediate identification of performance issues and security threats.
- Flow-based monitoring: Efficiently analyze large volumes of network data, providing detailed insights into application usage and user behavior.
- Geolocation support: Visualize traffic sources and destinations on a world map, aiding in identifying geographical patterns and potential security risks.
- Historical data analysis: Track network trends over time to optimize resource allocation and plan for future capacity needs.
- REST API: Integrate Ntopng with other tools for customized reporting and automated alerts.
Pros and Cons:
Pros:
- Open-source with professional version: Provides flexibility and cost-effective entry point for smaller organizations.
- Excellent flow analysis capabilities: Offers granular insights into network traffic patterns.
- Modern and responsive web interface: Provides intuitive and easy-to-navigate dashboards.
- Good performance with high-speed networks: Capable of handling significant traffic loads.
Cons:
- Limited alerting capabilities: While it provides some alerts, it may not be as comprehensive as dedicated monitoring suites.
- Requires technical expertise: Advanced configurations and troubleshooting may require specialized knowledge.
- Documentation could be more comprehensive: Further improvements in documentation would enhance usability for less experienced users.
- Professional features require paid licensing: Unlocking the full potential of Ntopng requires investment in the professional license.
Implementation and Setup Tips:
Installing Ntopng is relatively straightforward, with packages available for various Linux distributions. For optimal performance, it’s recommended to install Ntopng on a dedicated server with sufficient resources, especially when monitoring high-speed networks. Configuring Ntopng to collect flow data requires setting up your network devices to export NetFlow, sFlow, or IPFIX data. Familiarizing yourself with these protocols and your network device’s configuration options is crucial for a successful implementation.
Comparison with Similar Tools:
Compared to other network traffic monitoring tools like Wireshark and tcpdump, Ntopng focuses on flow-based analysis rather than packet-level inspection. While Wireshark and tcpdump are invaluable for deep packet analysis and troubleshooting specific network issues, Ntopng provides a higher-level overview of network activity, making it ideal for long-term trend analysis and capacity planning. Tools like Nagios and Zabbix offer more comprehensive alerting and monitoring capabilities, but often lack the detailed flow analysis provided by Ntopng.
Website: https://www.ntop.org
Ntopng provides a robust and effective solution for network traffic monitoring, offering a compelling balance of features, performance, and usability. Its focus on flow-based analysis, coupled with a modern web interface and powerful API, makes it a valuable tool for both small businesses and large enterprises seeking deeper insights into their network infrastructure.
9. LibreNMS
LibreNMS is a powerful and versatile open-source network traffic monitoring tool ideal for organizations seeking a comprehensive yet cost-effective solution. As a fully featured system, it offers a wide array of capabilities comparable to commercial alternatives, making it a compelling choice for everything from small businesses to large enterprise networks. Its strength lies in providing a complete picture of network health, performance, and availability, empowering teams to proactively identify and address potential issues before they impact users or business operations. LibreNMS deserves its place on this list due to its robust feature set, active community support, and the freedom and flexibility afforded by its open-source nature.
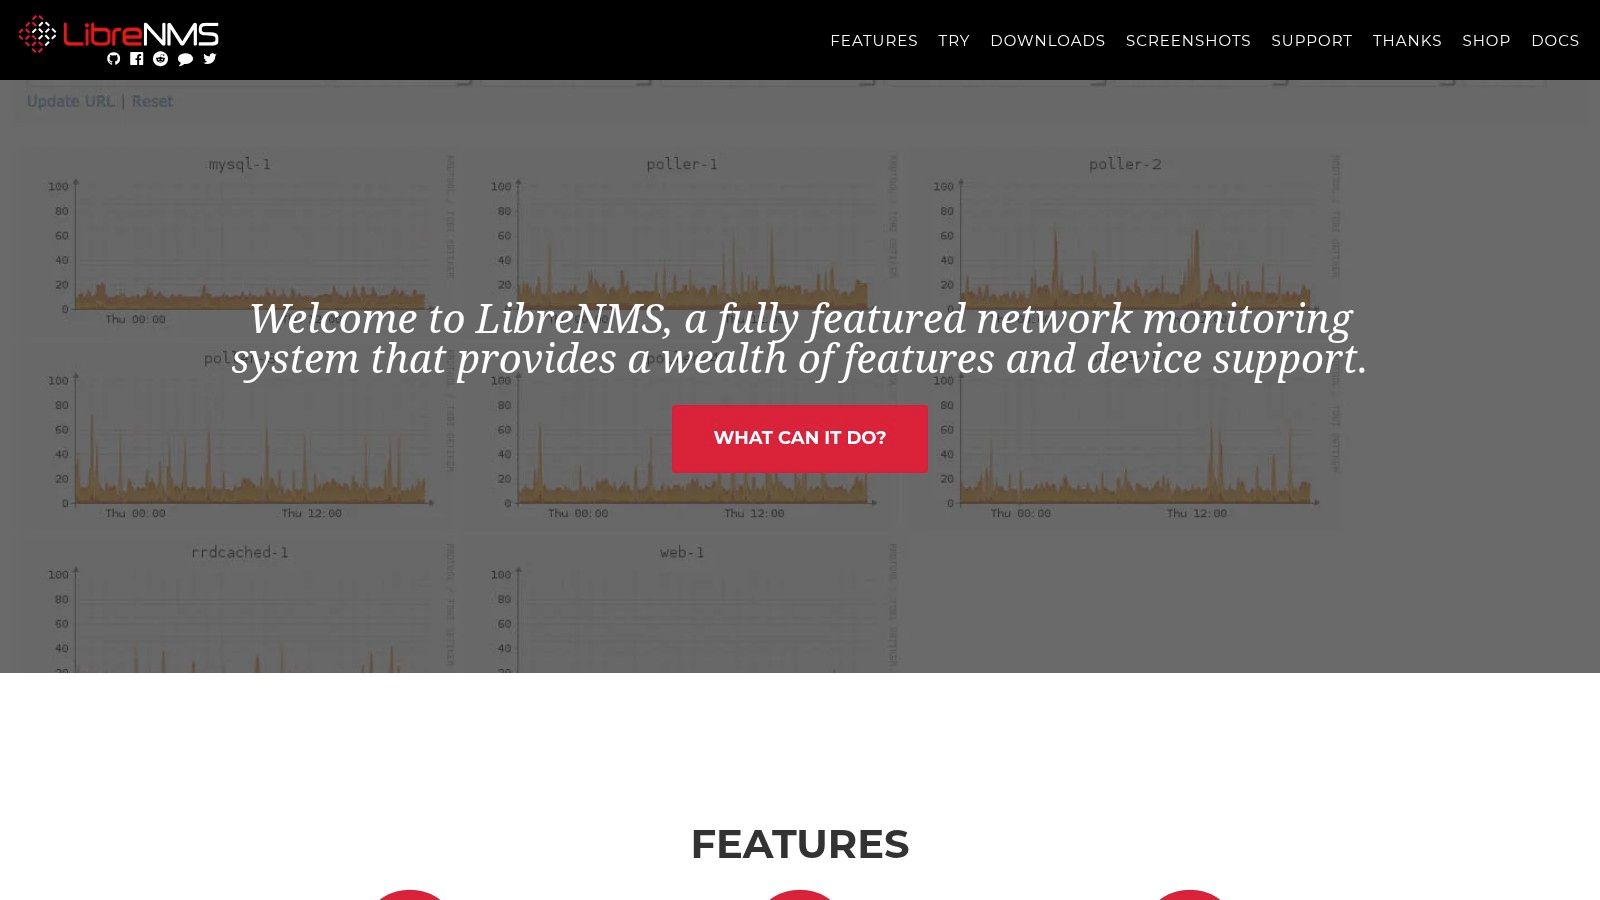
One of the most significant advantages of LibreNMS is its automatic network discovery and device detection. This feature simplifies the initial setup and ongoing management by automatically identifying and adding devices to the monitoring system. This automation saves valuable time and effort, particularly in dynamic network environments where devices are frequently added or changed. Furthermore, LibreNMS boasts extensive device support, covering a wide range of vendors and hardware, ensuring compatibility with diverse network infrastructures.
For software developers, QA engineers, and DevOps professionals, the modern API-driven architecture of LibreNMS is a significant boon. It allows for seamless integration with other tools and systems, enabling the automation of workflows and data exchange. This integration capability is crucial for building robust monitoring and alerting pipelines within a DevOps environment. Additionally, the mobile-responsive interface allows for convenient access to network data and alerts from anywhere, empowering teams to stay informed and respond quickly to issues, even when on the go.
Enterprise IT teams and tech-savvy business leaders will appreciate the flexible alerting system offered by LibreNMS. With multiple transport methods available, including email, SMS, and Slack notifications, teams can customize alerts to suit their specific needs and preferences. The ability to define thresholds and trigger alerts based on various metrics ensures that critical issues are promptly addressed, minimizing downtime and maximizing service availability. Furthermore, the built-in oxidized integration provides a streamlined solution for configuration backup, ensuring business continuity and disaster recovery.
While LibreNMS offers a compelling value proposition as a free and open-source network traffic monitoring tool, it does have some considerations. It requires a Linux server environment for installation, which might present a challenge for organizations without existing Linux infrastructure. Furthermore, for large-scale deployments, LibreNMS can be resource-intensive, requiring careful planning and adequate server resources. Lastly, while the active community provides excellent support, commercial support options are limited, which might be a concern for some organizations.
Implementation Tips:
- Start small: Begin by monitoring a subset of your network to familiarize yourself with the tool and its capabilities.
- Plan your server resources: Ensure your server has sufficient CPU, memory, and disk space to handle the expected load.
- Utilize the community resources: The LibreNMS community forum and documentation are valuable resources for troubleshooting and getting support.
- Customize your alerts: Configure alerts based on your specific needs and priorities to avoid alert fatigue.
- Explore the API: Leverage the API to integrate LibreNMS with other tools and automate workflows.
Pricing: LibreNMS is completely free and open-source.
Technical Requirements: A Linux server environment is required for installation.
Compared to commercial tools like SolarWinds and PRTG, LibreNMS offers a compelling free alternative with a comparable feature set. While commercial tools might offer more polished interfaces and dedicated support, LibreNMS provides the flexibility and cost savings of an open-source solution, making it an attractive option for budget-conscious organizations and those who prefer the control and customization offered by open-source software. The website (https://www.librenms.org) provides comprehensive documentation and community support resources. LibreNMS proves itself as a robust and valuable addition to any network administrator’s toolkit for comprehensive network traffic monitoring.
10. Icinga
Icinga is a powerful open-source monitoring system well-suited for comprehensive network traffic monitoring. It allows you to keep a close watch on the availability and performance of your critical network devices, ensuring smooth operation and quick identification of potential bottlenecks or outages. While inheriting its roots from Nagios, Icinga has evolved into a modern platform offering advanced features, a scalable architecture, and an improved user experience. Its versatility makes it suitable for monitoring everything from basic network connectivity to complex application performance, thus earning its place on this list of top network traffic monitoring tools. It excels at providing a holistic view of your network infrastructure, empowering you to proactively address potential issues before they impact your users.

Icinga’s strength lies in its ability to monitor various aspects of network traffic. By integrating with plugins and modules, Icinga can track metrics like bandwidth utilization, packet loss, latency, and connection status. This allows you to pinpoint network congestion, identify problematic links, and diagnose performance issues affecting your applications and services. Beyond simple network checks, Icinga’s business process monitoring capabilities allow you to define and track the health of complex multi-step processes, providing a higher-level view of service availability and performance.
One of Icinga’s key features is its modern and responsive web interface, Icinga Web 2. This interface provides a significantly improved user experience compared to traditional Nagios, offering intuitive dashboards, customizable views, and easy navigation. This makes it easier for teams to visualize network traffic data, understand performance trends, and quickly identify and respond to alerts. The RESTful API provided by Icinga further enhances its power by enabling seamless integration with other tools and systems. This facilitates automation of tasks, such as provisioning new monitoring checks, generating reports, and triggering automated responses to specific events.
For larger organizations, Icinga’s scalable architecture, including support for clustering, is a significant advantage. This allows Icinga to handle the monitoring needs of large and complex networks, ensuring high availability and resilience of the monitoring system itself. The flexible configuration through its domain-specific language gives administrators fine-grained control over their monitoring setup, adapting it to specific requirements and integrating with existing infrastructure.
While Icinga offers a powerful and flexible solution for network traffic monitoring, it’s important to be aware of its complexities. Compared to simpler tools, Icinga has a steeper learning curve and requires more significant configuration to achieve optimal results. The out-of-the-box dashboards might be limited, requiring customization to suit specific needs. While community support is available, it may not be as extensive as that of Nagios, its more established predecessor.
Technical Requirements and Implementation: Icinga 2 runs on Linux systems and requires a web server for Icinga Web 2. Installation can be done through package managers or by compiling from source. Setting up Icinga involves configuring the core, defining hosts and services to monitor, installing necessary plugins, and customizing the web interface.
Pricing: Icinga 2 is open-source and freely available. Icinga also offers commercial subscriptions, Icinga Director and Icinga Module for vSphere, providing additional features like configuration management, reporting, and enterprise-grade support.
Comparison with Similar Tools: Compared to Nagios, Icinga offers a more modern interface and better API integration, focusing on scalability. Zabbix, another open-source option, provides a wider range of pre-built templates and dashboards but can be more resource-intensive. Proprietary solutions like SolarWinds Network Performance Monitor offer more polished interfaces and advanced features but come with a higher price tag.
Implementation Tips:
- Start with a small-scale deployment and gradually expand your monitoring coverage.
- Invest time in understanding Icinga’s configuration language and best practices.
- Utilize the available plugins and modules to extend Icinga’s functionality.
- Leverage the API for automation and integration with other systems.
- Consider using Icinga Director for simplified configuration management.
Icinga, with its powerful features and open-source nature, is an excellent choice for organizations seeking a robust and flexible network traffic monitoring tool. By investing in understanding its intricacies and leveraging its extensive capabilities, organizations can gain valuable insights into their network performance and ensure the smooth operation of their critical services. You can explore Icinga further by visiting their website: https://icinga.com
Top 10 Network Traffic Tools Overview
| Tool | Core Features/Characteristics | User Experience/Quality ★ | Value Proposition 💰 | Target Audience 👥 | Unique Selling Points ✨ |
|---|---|---|---|---|---|
| 🏆 GoReplay | HTTP traffic capture & session-aware replay, load testing, TLS optimization | ★★★★★ Trusted by Fortune 500 & 18k+ stars | Free OSS & Pro with advanced analytics & support | Developers, QA, DevOps, Enterprises | Real user scenario replay, real-time monitoring, data masking |
| Wireshark | Deep packet-level network protocol analyzer, multi-platform | ★★★★ Extremely detailed & comprehensive | Free & open-source | Network engineers, Analysts | Hundreds of protocol analyses, powerful filters |
| SolarWinds Network Performance Monitor | Automated network discovery, real-time monitoring, alerting | ★★★★ User-friendly, excellent visualization | Expensive licensing | Enterprises | NetPath path analysis, integrated SolarWinds ecosystem |
| PRTG Network Monitor | All-in-one network/server/app monitoring, web interface | ★★★★ User-friendly, mobile apps | Sensor-based pricing, scalable | SMBs to Enterprises | Multi-technology monitoring, customizable dashboards |
| Nagios | Open-source core with extensive plugins, highly customizable | ★★★★ Reliable, but complex UI | Free core, expensive commercial | IT admins, Enterprise teams | Vast plugin ecosystem, scalable distributed monitoring |
| Zabbix | Enterprise-class monitoring, multiple data collection methods | ★★★★ Highly scalable, free | Free & open-source | Large enterprises | Auto-discovery, advanced visualization, distributed setup |
| ManageEngine OpManager | Automated discovery, real-time network monitoring | ★★★★ Comprehensive, easy deployment | Competitive pricing | SMBs and Enterprises | 2000+ device templates, network config & compliance |
| Ntopng | Web-based flow traffic analysis, real-time statistics | ★★★★ Modern UI, strong flow analytics | Open-source + paid pro | Network admins, Traffic analysts | Flow monitoring (NetFlow, sFlow), geolocation support |
| LibreNMS | Auto discovery, API-driven, flexible alerts | ★★★★ Modern, active community | Free & open-source | Small to large networks | Oxidized integration, clean interface |
| Icinga | Infrastructure & business process monitoring, flexible config | ★★★★ Modern UI, scalable, active development | Free & OSS | Enterprises, IT admins | REST API, cluster support, business process monitoring |
Choosing the Right Tool for the Job
Selecting the best network traffic monitoring tools from the array of options available can feel overwhelming. This article has explored ten popular choices, ranging from open-source solutions like Wireshark and GoReplay to robust commercial platforms like SolarWinds Network Performance Monitor and ManageEngine OpManager. Key takeaways include the importance of considering your specific needs, budget, and technical expertise when making a decision. While free tools offer powerful capabilities, they may require more hands-on configuration and management. Commercial solutions often provide comprehensive features, user-friendly interfaces, and dedicated support, but come with associated costs.
Remember that effective network traffic monitoring is crucial for maintaining network performance, security, and stability. By implementing the right tools, you can identify bottlenecks, troubleshoot issues proactively, and ensure a seamless user experience. Factors such as scalability, ease of integration with existing infrastructure, and the level of detail provided in reports should all play a role in your decision-making process. The right network traffic monitoring tools empower you to not only understand your network’s current state but also anticipate and address potential problems before they impact your users.
Ready to take your network traffic monitoring to the next level? GoReplay can help you capture and replay real-world traffic for testing and analysis, ensuring your applications can handle peak loads and maintain optimal performance. Explore the power of GoReplay today by visiting GoReplay.