Why Monitoring Application Performance Isn’t Optional Anymore
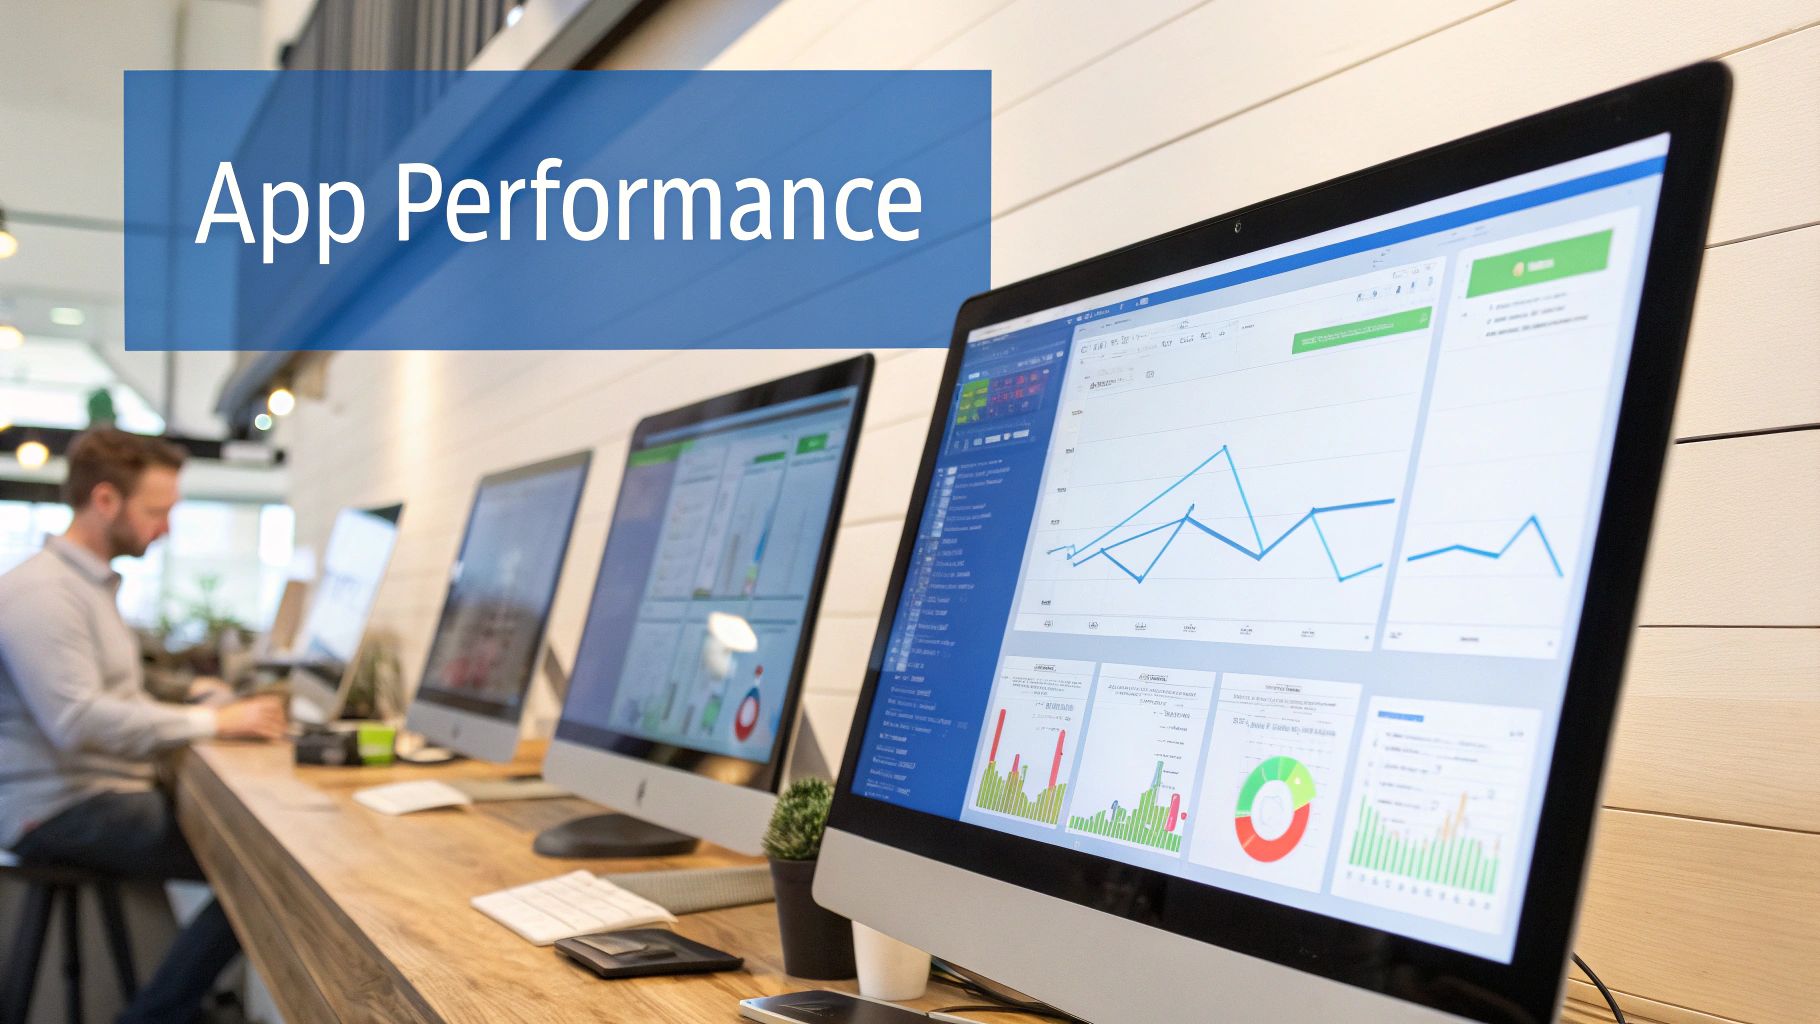
In today’s competitive business landscape, application performance is crucial for success. Even small performance hiccups can have a big impact on your bottom line. This goes beyond simple technical errors; we’re talking about real consequences for revenue, customer loyalty, and brand reputation.
The Real Cost of Poor Performance
Poor application performance can lead to lost revenue in several ways. One major example is abandoned transactions. Today’s customers expect speed, and a slow application can quickly lead to frustration and lost sales. If a webpage takes more than three seconds to load, the chance of a user leaving increases significantly. Explore this topic further. Lost customer loyalty is another consequence. Users facing repeated performance issues are unlikely to return, impacting long-term customer value. Investing in performance monitoring is a key strategy for customer retention.
The Rise of User Expectations
User expectations for application performance have grown tremendously. In our fast-paced world, users have little patience for slow or unreliable applications. Even milliseconds can matter, leading to negative perceptions. This shift in user behavior highlights the need for proactive performance monitoring to catch and fix issues before they affect the user experience.
The Competitive Edge
Companies that prioritize monitoring application performance consistently outperform their competition. They can:
- Identify and resolve issues quickly: Minimizing downtime and preventing widespread user frustration.
- Optimize resource utilization: Leading to cost savings and improved efficiency.
- Deliver superior user experiences: Fostering customer loyalty and driving positive reviews.
- Maintain a strong brand reputation: Attracting new customers and building trust with existing ones.
Proactive Monitoring with GoReplay
GoReplay offers a robust solution for proactive performance monitoring. By capturing and replaying live HTTP traffic, GoReplay lets you test applications under real-world conditions, identifying potential performance bottlenecks before they impact users. This proactive approach helps ensure a stable and reliable user experience, contributing to long-term business success. It’s particularly useful for load testing and simulating different traffic scenarios.
Performance Metrics That Actually Matter to Users and Revenue

Keeping your application online is just the first step. True success lies in focusing on metrics that resonate with users and directly impact your bottom line. This requires a shift from a purely technical viewpoint to one that prioritizes the user experience.
This section explores the performance indicators that significantly influence both user satisfaction and revenue generation.
From Technical Metrics to User Experience
Developers often concentrate on technical metrics such as CPU usage and memory allocation. While these are important, they don’t always reflect the user’s experience.
For example, a server might have low CPU usage, but users could still experience slow loading times due to a poorly optimized database query.
The key is bridging the gap between technical measurements and the actual user experience. This is where focusing on experience metrics becomes crucial.
The Frustration Threshold: When Performance Impacts Users
User expectations vary across different application types and industries. A slight delay in a gaming application can be far more frustrating than a similar delay in a business intelligence dashboard. Understanding these nuances is key to effective performance monitoring.
Studies show that even minor delays of 500 milliseconds in key interactions, like button clicks, can lead to noticeable user frustration. This highlights the importance of monitoring interaction delays, not just overall page load times.
Application Performance Monitoring (APM) tools like Datadog are essential for tracking metrics such as response times and error rates, which directly influence user experience. One key metric is the Apdex score, which measures user satisfaction based on transaction response times. You can discover more insights about APM tools.
The Revenue Connection: Tying Performance to Business Outcomes
Leading organizations recognize the direct link between performance and revenue. They diligently track how specific performance metrics correlate with key business indicators like conversion rates and customer churn.
For example, an e-commerce company might discover that a one-second decrease in checkout page load time leads to a 2% increase in conversions. This data justifies investments in performance optimization. You can learn more about performance testing in our guide on Essential Performance Testing Metrics.
Beyond the Basics: Emerging Performance Indicators
While traditional metrics like response times and error rates remain vital, emerging indicators provide deeper insights. API dependencies, for instance, are increasingly critical in modern applications.
Slowdowns in external APIs can significantly impact your application’s performance, even if your internal infrastructure is running smoothly. Therefore, monitoring the performance of these external dependencies is crucial. This includes tracking metrics like API call latency and error frequency.
Before diving into implementation, let’s review some key performance metrics. The following table summarizes essential application performance metrics, their significance, and target values:
Essential Application Performance Metrics: A comparison of critical performance metrics, their significance, and target values
| Metric | What It Measures | Why It Matters | Target Values |
|---|---|---|---|
| Response Time | The time it takes for a system to respond to a request. | Impacts user experience and satisfaction. | < 200ms (ideal), < 500ms (acceptable) |
| Error Rate | The percentage of requests that result in an error. | Indicates application stability and reliability. | < 1% |
| Apdex Score | User satisfaction based on response times. | Provides a quantifiable measure of user experience. | > 0.9 (excellent), > 0.7 (good) |
| API Latency | The time it takes for an API call to complete. | Affects the performance of applications relying on external APIs. | < 500ms (ideal), < 1000ms (acceptable) |
| Interaction Delay | Delay in user interface elements like buttons and menus. | Directly impacts user frustration and interaction flow. | < 100ms |
This table provides a quick overview of key performance metrics and their importance. Understanding these metrics is fundamental to effective performance management.
Implementing and Troubleshooting
Effective application performance monitoring requires understanding the right metrics and knowing how to implement them and troubleshoot issues.
Each metric should have clear implementation guidelines and troubleshooting pathways. This enables quick identification and resolution of problems, minimizing user impact and preventing revenue loss. This proactive approach is essential for maintaining a healthy and performant application.
Cutting Through the Noise: APM Tools That Deliver Results
The Application Performance Monitoring (APM) landscape is complex. Finding the right tool is about more than just a feature list; it’s about achieving real value. Choosing the right APM tool hinges on understanding the specific performance metrics it offers. Using the right call center metrics can significantly enhance the customer experience.
Matching Tools to Architecture
Different applications demand different monitoring strategies. A monolithic application has different needs than a microservices architecture or a serverless function deployment. Some platforms excel at tracing transactions in distributed systems, while others focus on containerized environments. Selecting the right tool for your architecture is paramount. If you mainly use serverless functions, ensure your APM tool has robust serverless monitoring.
The True Cost of Implementation
The initial price tag of an APM tool is only part of the story. The true cost includes several often-overlooked factors:
- Infrastructure overhead: Some tools require substantial server resources, increasing operational costs.
- Integration complexity: Integrating a new tool into existing workflows can consume time and resources.
- Team adoption: Even the most powerful tool is useless if your team struggles to use it. Consider the learning curve and usability.
Building a Cohesive Monitoring Ecosystem
Many organizations are shifting from single APM tools to cohesive monitoring ecosystems. This involves combining specialized tools for a more holistic view of performance. For example, combining an open-source tracing tool like Jaeger with a commercial platform like Datadog for infrastructure monitoring. This leverages each tool’s strengths to address specific needs.
Before we delve further, let’s compare some leading APM solutions:
The following table, “Comparison of Leading APM Tools,” analyzes popular APM solutions, highlighting their key features, ideal use cases, pricing models, and integration capabilities. This overview should assist in understanding the diverse landscape and selecting the right tool for your individual needs.
| Tool | Key Features | Best For | Pricing Model | Integration Capabilities |
|---|---|---|---|---|
| New Relic | Application monitoring, infrastructure monitoring, digital experience monitoring | Enterprises, large organizations | Subscription-based | Wide range of integrations |
| Dynatrace | AI-powered monitoring, automation, cloud-native monitoring | Enterprises, complex applications | Subscription-based | Strong cloud integrations |
| AppDynamics | Business transaction monitoring, application performance management, end-user monitoring | Enterprises, business-critical applications | Subscription-based | Extensible platform |
| Datadog | Infrastructure monitoring, log management, APM | DevOps teams, cloud-native environments | Subscription-based | Broad ecosystem of integrations |
| Prometheus | Open-source monitoring, time-series database, alerting | DevOps teams, cloud-native environments | Open-source, free | Extensive customization options |
As you can see, choosing the right APM tool requires careful consideration of various factors, including features, pricing, and integrations.
Open Source vs. Enterprise: Finding the Right Balance
The APM market offers both open-source and enterprise options. Open-source tools like Prometheus offer value and flexibility. Enterprise platforms often provide advanced features like AI-powered anomaly detection. Understanding the trade-offs between cost, features, and support is essential. This involves comparing community support for open-source tools with dedicated support from enterprise vendors.
The Role of AI in Modern APM
AI is increasingly important in APM. AI-powered tools can automatically detect anomalies, predict performance issues, and suggest fixes. However, AI is not a replacement for traditional methods. Effective strategies often combine AI and traditional techniques. This balances automated insights with human expertise. The effectiveness of AI-powered APM depends heavily on the data it’s trained on.
Choosing the right APM involves considering your architecture, budget, team expertise, and specific performance challenges. Focus on practical value and a cohesive monitoring strategy to monitor effectively and deliver excellent user experiences.
Building a Monitoring Strategy That Drives Action
Having the right tools is only half the battle when it comes to monitoring application performance. A well-defined strategy is essential for turning data into actionable improvements. This section explores how successful organizations create performance monitoring approaches that deliver real results.
Defining the Scope: What to Monitor and Why
The first step in building a robust monitoring strategy is defining its scope. This involves pinpointing the critical application components and the key metrics that matter most. By concentrating on the most important areas, such as key user transactions and core system functionalities, you can prioritize your monitoring efforts effectively.
This focused approach ensures your monitoring strategy directly supports your overall business goals. Think of it like a roadmap – you need to know where you’re going before you start the journey.
Establishing Baselines: Understanding Normal Performance
After defining what to monitor, the next step is establishing meaningful baselines. A baseline represents the typical performance of your application under normal operating conditions. This understanding helps differentiate between expected performance fluctuations and actual performance problems.
Baselines should be regularly reviewed and adjusted to account for changes in application usage and infrastructure. For instance, a baseline could be the average response time for a specific API call during peak traffic. This provides a valuable benchmark for comparing future performance.
Alerting Strategies: Balancing Sensitivity and Actionability
Effective alerting is essential for catching critical issues before they impact your users. However, too many alerts can lead to alert fatigue, where teams start ignoring even important notifications.
Defining clear alert thresholds and escalation procedures is vital. This includes specifying which metrics trigger alerts, the severity levels of different alerts, and who is responsible for responding to them. A well-defined process keeps everyone informed and ensures timely action.
Additionally, fast and reliable application performance is crucial in today’s competitive market. The Apdex score can help developers set performance goals and ensure applications meet user expectations. Find more detailed statistics here.
Tailoring Dashboards: From Engineers to Executives
Different stakeholders need different types of information. Engineers need detailed technical dashboards for troubleshooting, while executives require high-level overviews of the business impact.
Creating customized dashboards for each audience is crucial. This ensures everyone has access to the right information. For engineers, this might include real-time metrics and detailed transaction traces. For executives, key performance indicators (KPIs) and overall business impact are more relevant. Explore further insights in our guide on How to master a Performance Testing Strategy.
Navigating Common Monitoring Challenges
Monitoring complex systems presents specific challenges:
- Third-Party Dependencies: Monitoring external services that affect your application’s performance.
- Legacy Applications: Working with older systems that lack robust instrumentation.
- Distributed Systems: Tracking interactions across numerous interconnected services.
Addressing these challenges often involves using specialized tools, strategic planning, and deep technical expertise. This might include employing techniques like distributed tracing and implementing synthetic monitoring for third-party dependencies. For legacy applications, consider adding custom instrumentation or exploring agentless monitoring solutions. By tackling these hurdles, organizations can create comprehensive monitoring strategies that offer valuable insights and lead to meaningful improvements.
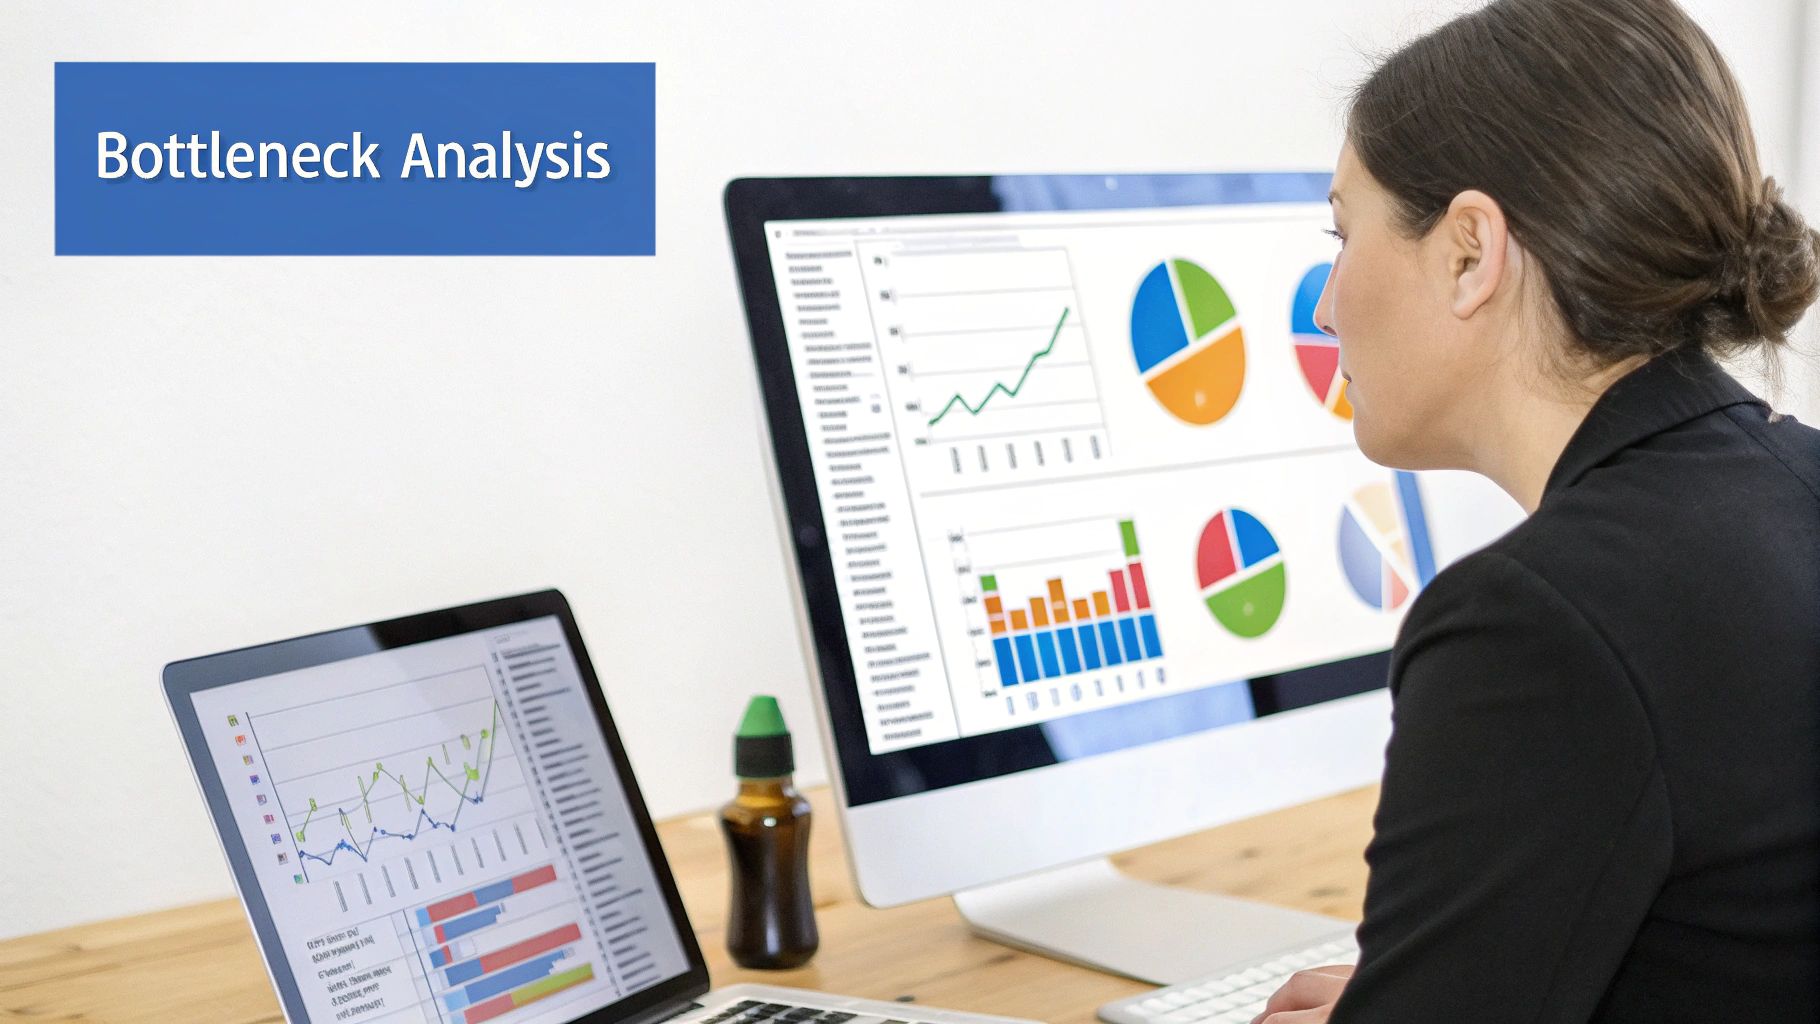
Diagnosing Performance Issues Like a Seasoned Pro
When your application performance monitoring system sends you an alert, knowing where to begin your investigation is critical. This is often what separates experienced engineers from those just starting out. This section offers structured methods for troubleshooting common performance problems, drawing on insights from senior performance engineers.
Troubleshooting Workflows: A Systematic Approach
Think of a doctor diagnosing a patient. They don’t simply address the symptoms; they search for the root cause. Similarly, diagnosing application performance issues requires a systematic approach. Let’s explore effective workflows for tackling several common issues.
-
Slow Response Times: The initial step is identifying the affected component. Is it the application server, the database, or the network? Response times at different points in the request lifecycle, CPU utilization, and database query times are all key metrics to examine.
-
Memory Leaks: Over time, these can severely impact application performance. Begin by analyzing memory usage trends. A continuous climb in memory usage without leveling off often indicates a leak. Tools like memory profilers can help pinpoint the source within your code.
-
Database Bottlenecks: Slow database queries can significantly hinder an application. Analyze query performance, focusing on long-running queries or excessive database load. Database profiling tools can identify inefficient queries that require optimization.
-
Networking Issues: These can be particularly tricky. Begin by examining network latency and packet loss. Network monitoring tools can offer more detailed information on overall network performance.
Isolating Problems in Complex Environments
Today’s applications rarely exist in isolation. They frequently involve multiple interconnected services, which can complicate isolating the source of a problem. Here are some useful techniques:
-
Analyzing Clustered Services: When working with clustered applications, look for performance differences between individual servers. A slow server might point to a localized problem.
-
Differentiating Code vs. Infrastructure: Is the problem in your codebase, or is it a limitation of your infrastructure? Analyze resource utilization metrics. High CPU or memory usage on a server can indicate an infrastructure bottleneck.
-
Addressing Gradual Degradation: Performance can sometimes degrade slowly over time. Regularly reviewing performance trends and setting baselines can reveal these slow declines before they become major issues. GoReplay can help proactively test your application and identify potential bottlenecks.
The Importance of Correlation: Connecting the Dots
Effective troubleshooting requires correlating various metrics. For instance, slow response times coupled with high database CPU usage suggests a database bottleneck. Searching for these correlations speeds up root cause analysis.
Think of it like detective work; connecting the clues tells the complete story. This involves using monitoring dashboards and analyzing logs to gain a comprehensive understanding. By employing specific tools and systematic workflows, you can proactively address potential performance issues before they impact users and, ultimately, your bottom line. Remember, application performance monitoring is about more than just data collection—it’s about actively using that data to improve performance and stability.
Making Performance Everyone’s Responsibility
Effective application performance monitoring isn’t limited to a single team. It’s an integral part of both development and operations. High-performing engineering teams recognize that performance is a shared responsibility. This section explores how to build a performance-focused culture throughout your application’s lifecycle.
Integrating Performance into Planning and Development
Performance should be a key consideration from the very beginning. By integrating performance requirements into the initial planning stages, you ensure it’s not an afterthought. This proactive approach prevents costly performance fixes down the line. For example, defining acceptable response times for a new API endpoint before development sets clear performance goals from the start.
Automated performance gates within your CI/CD pipelines are also crucial. These gates trigger automated performance tests during the build process. This helps catch performance regressions early, before they reach production. These automated tests act as a safety net, ensuring performance doesn’t slip during development.
Feedback Loops and Architecture Decisions
Creating feedback loops is essential for continuous improvement. Performance data should be fed back to development teams, informing architecture decisions and future development efforts. This creates a cycle of continuous learning and optimization. For instance, performance data from a recent release might reveal a database bottleneck. This feedback can then guide the team to optimize database queries or adjust the database architecture for future releases.
Fostering a Culture of Performance
Leading engineering teams incentivize performance optimization. They understand that prioritizing performance requires a cultural shift, not just tools and processes. Recognizing and rewarding engineers who prioritize performance reinforces its importance. This might involve highlighting performance improvements in team meetings or offering bonuses for significant performance gains.
Furthermore, fostering cross-functional alignment around performance goals is essential. Shared goals ensure everyone is working towards the same objectives. This creates a unified effort and breaks down silos between teams, preventing the “performance is someone else’s problem” mentality. Clear communication and regular collaboration between development, operations, and business teams are key to achieving this alignment.
Shared Ownership: Preventing the Blame Game
Developing shared ownership models is critical. When performance is everyone’s responsibility, teams proactively identify and address potential issues. This collaborative approach fosters a sense of collective ownership and avoids finger-pointing when performance problems arise. It creates a culture of shared responsibility, where everyone contributes to optimizing performance and ensuring a positive user experience.
By integrating performance considerations into every stage of the application lifecycle—from planning and development to monitoring and troubleshooting—organizations create a culture of performance excellence. This leads to better user experiences, improved business outcomes, and a more engaged engineering team.
Ready to improve your application’s performance and ensure a seamless user experience? GoReplay offers a powerful solution for capturing and replaying live HTTP traffic, allowing you to proactively identify and address performance bottlenecks. Start optimizing your application performance today!