12 Best Load Testing Tools Open Source for 2025
In today’s competitive digital marketplace, application performance is non-negotiable. A slow-loading page or a system crash under high traffic can directly impact revenue, user retention, and brand reputation. Proactive load testing is the essential practice that separates reliable applications from those that fail under pressure. However, implementing a robust testing strategy doesn’t require a significant financial investment, thanks to a vibrant ecosystem of powerful load testing tools open source solutions.
This comprehensive guide is designed to help you navigate this ecosystem and select the right tool for your specific needs. We move beyond generic feature lists to provide a deep, practical analysis of the top 12 open-source options available today. For each tool, you will find a detailed breakdown of its core strengths, potential limitations, and ideal use-case scenarios-from developer-centric frameworks like Grafana k6 to traffic-replay solutions like GoReplay.
We’ll explore how each platform helps you simulate realistic user loads, identify performance bottlenecks, and ultimately build more resilient systems. This resource offers a direct path to finding the perfect open-source tool to fortify your application’s reliability and ensure it delivers a seamless user experience, even during peak demand.
1. GoReplay
Best For: Creating highly realistic load tests by replaying live production traffic.
GoReplay stands out as one of the most innovative load testing tools open source by fundamentally changing the approach to test creation. Instead of manually scripting user behavior, GoReplay captures real HTTP traffic from your production environment and replays it against a staging or development server. This unique “shadowing” capability provides an unparalleled level of realism, ensuring your tests accurately reflect true user interactions, traffic patterns, and edge cases.
This method eliminates the guesswork and bias inherent in synthetic test scripts. By simulating authentic user activity, developers and QA engineers can confidently validate application scalability, identify performance bottlenecks, and catch elusive bugs before they impact production. GoReplay is particularly powerful for complex scenarios like infrastructure migrations, pre-deployment performance validation, and regression testing where ensuring stability under real-world conditions is paramount.
Key Strengths and Use Cases
- Session-Aware Replay: GoReplay intelligently preserves user sessions with connection pooling and TLS optimization. This ensures that multi-step user journeys and stateful interactions are replayed accurately, providing a test that truly mimics authentic user behavior.
- Realistic Load Simulation: It’s an excellent tool for validating how your application scales. By replaying captured traffic at varying speeds (e.g., 2x, 10x), you can simulate sudden traffic spikes or project future growth, stress-testing your infrastructure with data grounded in reality.
- Risk-Free Migrations: When moving to new infrastructure or a cloud provider, GoReplay can be used to shadow production traffic to the new environment. This allows you to compare performance, latency, and error rates between the old and new systems side-by-side, de-risking the entire migration process.
Implementation and Pricing
GoReplay offers a robust, free open-source version that is more than sufficient for many developers and smaller teams. For enterprise needs, a commercial Pro version unlocks advanced features like data masking, sophisticated traffic filtering, a real-time analytics dashboard, and priority support. While the Pro license is a consideration for budget-conscious teams, the core open-source tool remains a powerful, accessible option. Effective implementation requires some technical expertise to configure the listener and replay components within your network architecture.
Website: https://goreplay.org
2. Apache JMeter Official Website
The official Apache JMeter website is the definitive source for anyone using this powerhouse of the open-source load testing world. It serves as the central hub for downloads, comprehensive documentation, and community resources. Unlike third-party sites, the official platform guarantees you are getting the latest, most stable, and secure version of the JMeter application, free of any modifications.
The site is purely informational and functional, providing direct access to the software, which is completely free to download and use. Its design is straightforward, prioritizing access to technical documentation and user guides over aesthetics. For developers and QA engineers, this no-frills approach is ideal for quickly finding necessary information.
Key Features & Use Cases
- Extensive Protocol Support: JMeter’s strength lies in its versatility. It handles everything from standard HTTP/S traffic for web applications to more complex protocols like SOAP/REST for APIs, JDBC for database testing, and FTP for file servers.
- GUI and Scripting: The user-friendly GUI allows for rapid test plan creation and debugging. For advanced scenarios requiring dynamic data or complex logic, JMeter supports scripting with Groovy, making it highly adaptable.
- Distributed Testing: The website provides clear instructions on how to set up a distributed testing environment, allowing you to simulate massive loads by coordinating multiple JMeter instances (slaves) from a single controller machine.
For a deep dive into practical application, you can explore a complete guide to load testing a REST API with JMeter.
Website Link: https://jmeter.apache.org/
3. Grafana k6 Official Website
The official Grafana k6 website is the central resource for one of the most developer-centric load testing tools open source has to offer. It’s designed for modern engineering teams, providing everything needed to start performance testing APIs, microservices, and websites. The site serves as the hub for downloading the open-source CLI tool, accessing extensive documentation, and exploring its commercial cloud offerings for large-scale distributed testing.
The platform is clean, modern, and focuses on getting developers up and running quickly. It champions a “tests as code” philosophy, where performance tests are written in JavaScript and managed within your version control system. While the core tool is free, the website also details the Grafana k6 Cloud service, a paid option that simplifies test execution and results analysis.
Key Features & Use Cases
- Developer-Friendly Scripting: Tests are written in JavaScript (ES2015/ES6) with support for modules, making it intuitive for developers to create and maintain sophisticated test logic directly in their IDE.
- Seamless CI/CD Integration: k6 is built to be a first-class citizen in CI/CD pipelines. Its command-line interface and configurable pass/fail criteria (Thresholds) allow for easy automation of performance testing within Jenkins, GitLab CI, GitHub Actions, and more.
- High-Performance Engine: Written in Go, k6 is lightweight and resource-efficient. It can generate significant load from a single machine, making it ideal for both local testing during development and larger tests in a pipeline.
Website Link: https://k6.io/
4. Gatling Official Website
The Gatling official website is the primary resource for developers and performance engineers looking to leverage this high-performance, open-source load testing tool. It provides access to Gatling’s open-source version, detailed documentation, and information on its commercial counterpart, Gatling FrontLine. The site highlights Gatling’s modern, code-first approach, which sets it apart from GUI-driven tools.
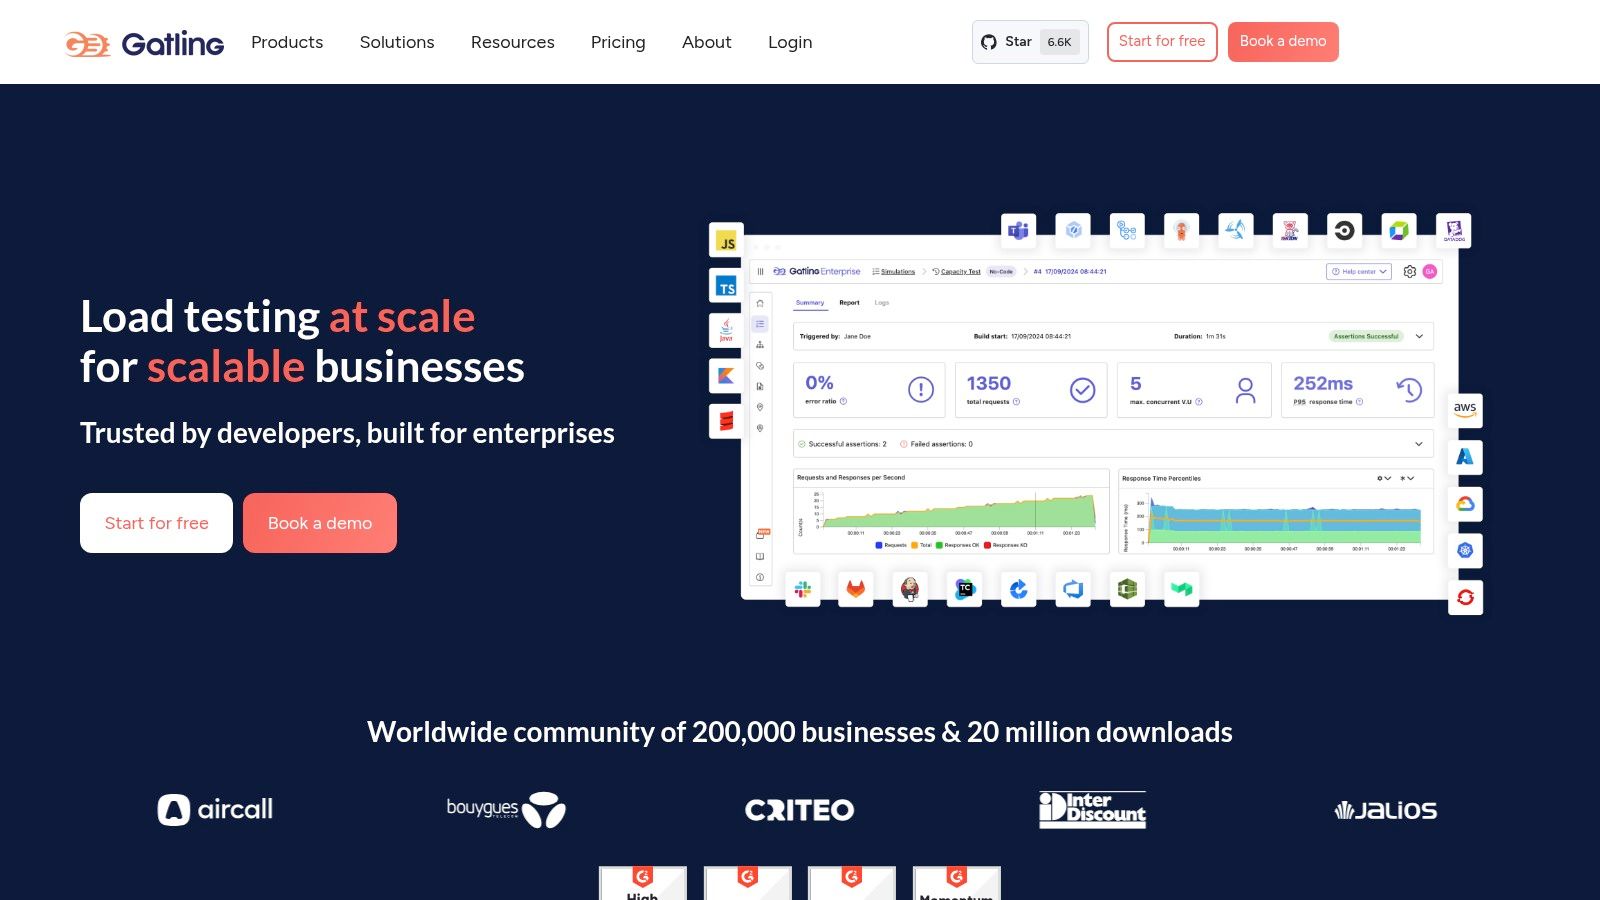
Unlike tools that rely on graphical interfaces for test creation, Gatling uses a powerful Scala-based DSL (Domain-Specific Language). This makes test scripts highly readable, maintainable, and version-control-friendly, which is a significant advantage for teams practicing DevOps and GitOps. The website offers comprehensive guides and tutorials to help users get started with this code-centric methodology.
Key Features & Use Cases
- Code-Based Scripting: Gatling’s Scala DSL allows for expressive and version-controlled test scripts. This is ideal for complex scenarios where tests need to be treated as code, integrating seamlessly into a development workflow.
- Asynchronous Architecture: Built on an asynchronous, non-blocking engine (Akka and Netty), Gatling uses resources with extreme efficiency. It can simulate thousands of virtual users from a single machine, making it a cost-effective choice for generating massive load.
- Rich HTML Reports: After a test run, Gatling automatically generates detailed, dynamic, and easy-to-understand HTML reports. These reports offer deep insights into response times, request counts, and error rates, helping teams quickly pinpoint performance bottlenecks.
To better understand how such tools fit into a performance strategy, you can explore insights on boosting application performance with load testing.
Website Link: https://gatling.io/
5. Locust Official Website
The official Locust website is the central resource for one of the most developer-friendly open-source load testing tools available. It champions a “code-first” philosophy, allowing engineers to define complex user behaviors with Python scripts. The site provides everything needed to get started, from installation guides and in-depth documentation to direct downloads, ensuring users have access to the latest and most secure version of the tool.

Locust is entirely free and open source. Its website is designed for developers, prioritizing clear, actionable information and code examples over flashy visuals. The platform’s main differentiator is its use of Python for test creation, making it an incredibly flexible and intuitive choice for teams already proficient in the language. The lightweight nature of Locust tests means you can simulate millions of users from a distributed cluster of machines.
Key Features & Use Cases
- Python-Based Scripting: Define user behavior in plain Python code. This makes it easy to version control your test scenarios and handle complex user flows with conditional logic, loops, and external data.
- Distributed & Scalable: Locust was built for performance, supporting distributed load generation out of the box. You can easily run tests across multiple machines to simulate massive traffic spikes for large-scale applications.
- Web-Based UI: While tests are written in code, Locust provides a clean, real-time web interface. From the UI, you can start and stop tests, view key performance metrics like response times and failure rates, and monitor results as they happen.
Website Link: https://locust.io/
6. Artillery Official Website
The Artillery official website serves as the primary resource for its modern, developer-centric load testing toolkit. Known for its simplicity and power, Artillery is designed for testing backend systems with a focus on ease of use and extensibility. The website provides everything needed to get started, from clear installation guides to in-depth documentation and access to both the open-source version and its premium, managed cloud service.

Unlike more complex tools, Artillery’s documentation highlights its declarative, YAML-based approach to test scripting, which significantly lowers the entry barrier. The site is cleanly designed, offering a smooth user experience for developers looking to quickly integrate performance testing into their workflow. It clearly outlines how to use Artillery for everything from simple API checks to complex WebSocket and Socket.io scenarios, making it a favorite among those who value efficiency and CI/CD integration.
Key Features & Use Cases
- YAML-Based Test Scripts: Artillery uses simple, readable YAML files to define test scenarios. This makes test creation and maintenance straightforward, even for team members who aren’t performance engineering experts.
- Multi-Protocol Support: While its core strength is in HTTP/S and API testing, it also offers first-class support for real-time protocols like WebSocket and Socket.io, which is crucial for modern web applications.
- Extensible with JavaScript: For complex logic, dynamic data generation, or custom metrics, you can write custom JavaScript code directly within your YAML test scripts, offering a powerful blend of simplicity and flexibility.
- CI/CD Integration: The tool is designed to be run from the command line, making it one of the best open-source load testing tools for seamless integration into continuous integration and delivery pipelines like Jenkins, GitLab CI, or GitHub Actions.
Website Link: https://www.artillery.io/
7. Vegeta GitHub Repository
The GitHub repository for Vegeta serves as the official home for this high-performance, Go-based HTTP load testing tool. As a command-line-first utility, its repository is the central point for downloads, source code access, comprehensive documentation, and issue tracking. This platform is essential for developers who need a lightweight yet powerful tool for quick and precise HTTP load testing, guaranteeing they are working with the latest, untampered version.
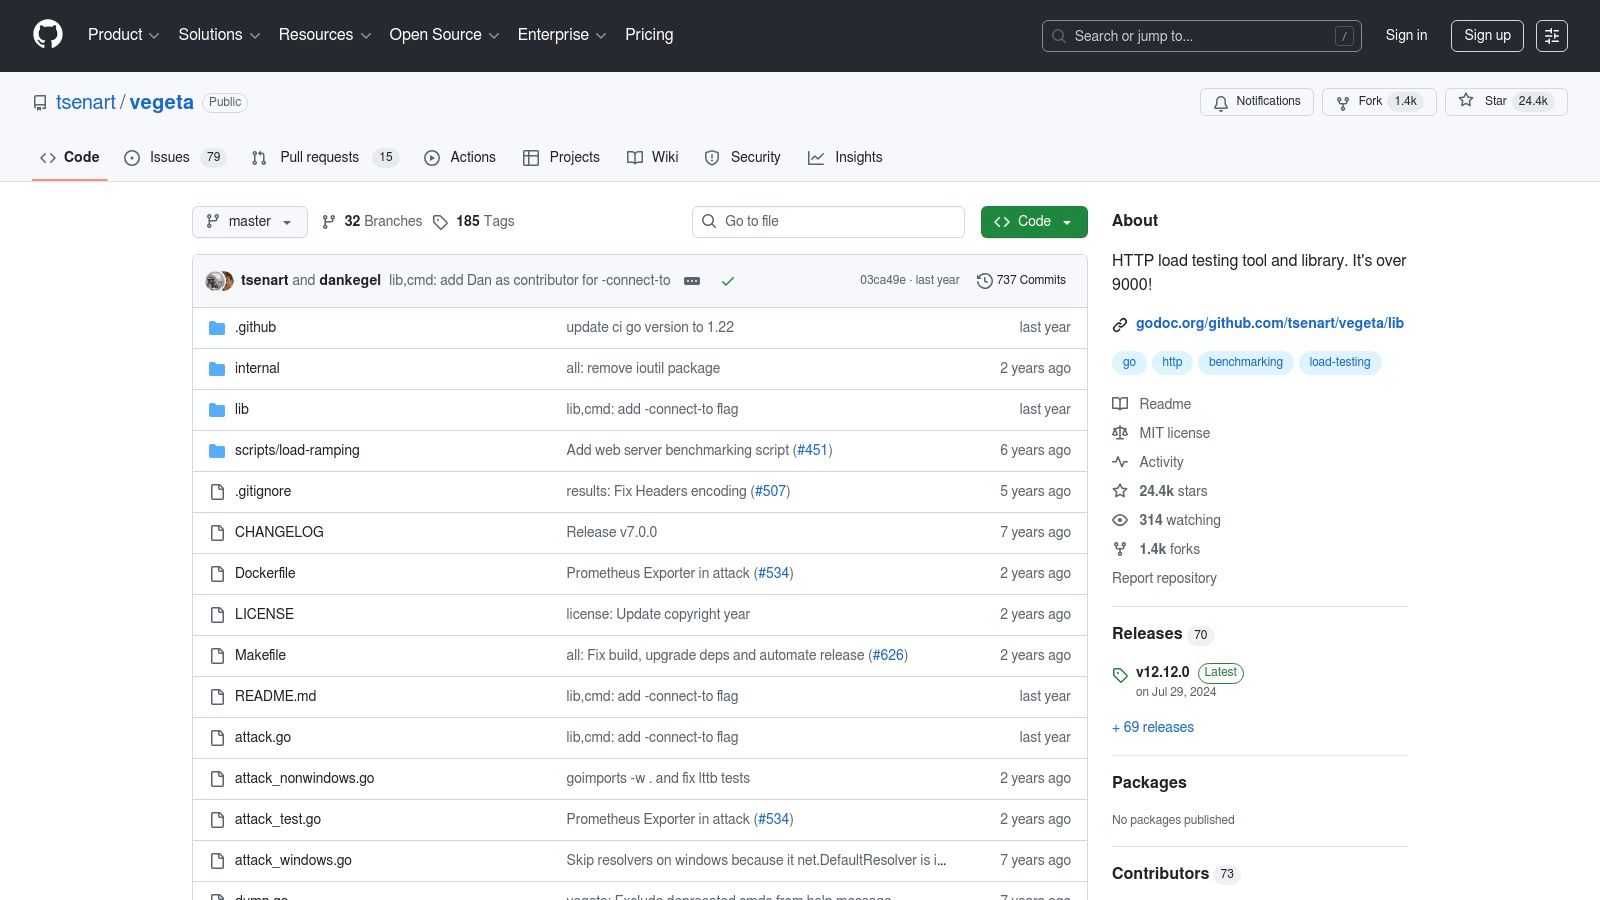
The repository’s structure is purely functional, prioritizing developer needs with a detailed README, usage examples, and direct access to the source code. Vegeta is completely free and open-source, and its design philosophy emphasizes simplicity and efficiency. This makes it a standout choice among other open-source load testing tools for teams that value speed and command-line integration over complex GUIs.
Key Features & Use Cases
- CLI and Library Usage: Vegeta shines in its dual-purpose nature. It can be used directly from the command line for immediate tests or imported as a library into custom Go applications for programmatic and automated testing workflows.
- Constant Request Rate: Its ability to maintain a constant request rate is perfect for soak testing and capacity planning, allowing you to accurately determine how your system behaves under a steady, predictable load.
- Detailed Reporting: The tool generates text-based reports and JSON output detailing latencies, throughput, and error rates. These reports can be easily piped into other tools for visualization and further analysis.
Website Link: https://github.com/tsenart/vegeta
8. The Grinder Official Website
The official website for The Grinder serves as the primary resource for this Java-based, open-source load testing framework. It provides direct access to downloads, documentation, and community links for a tool designed for performance testing at scale. The platform is straightforward, focusing on function over form to give developers and performance engineers quick access to the necessary files and technical information for getting started.
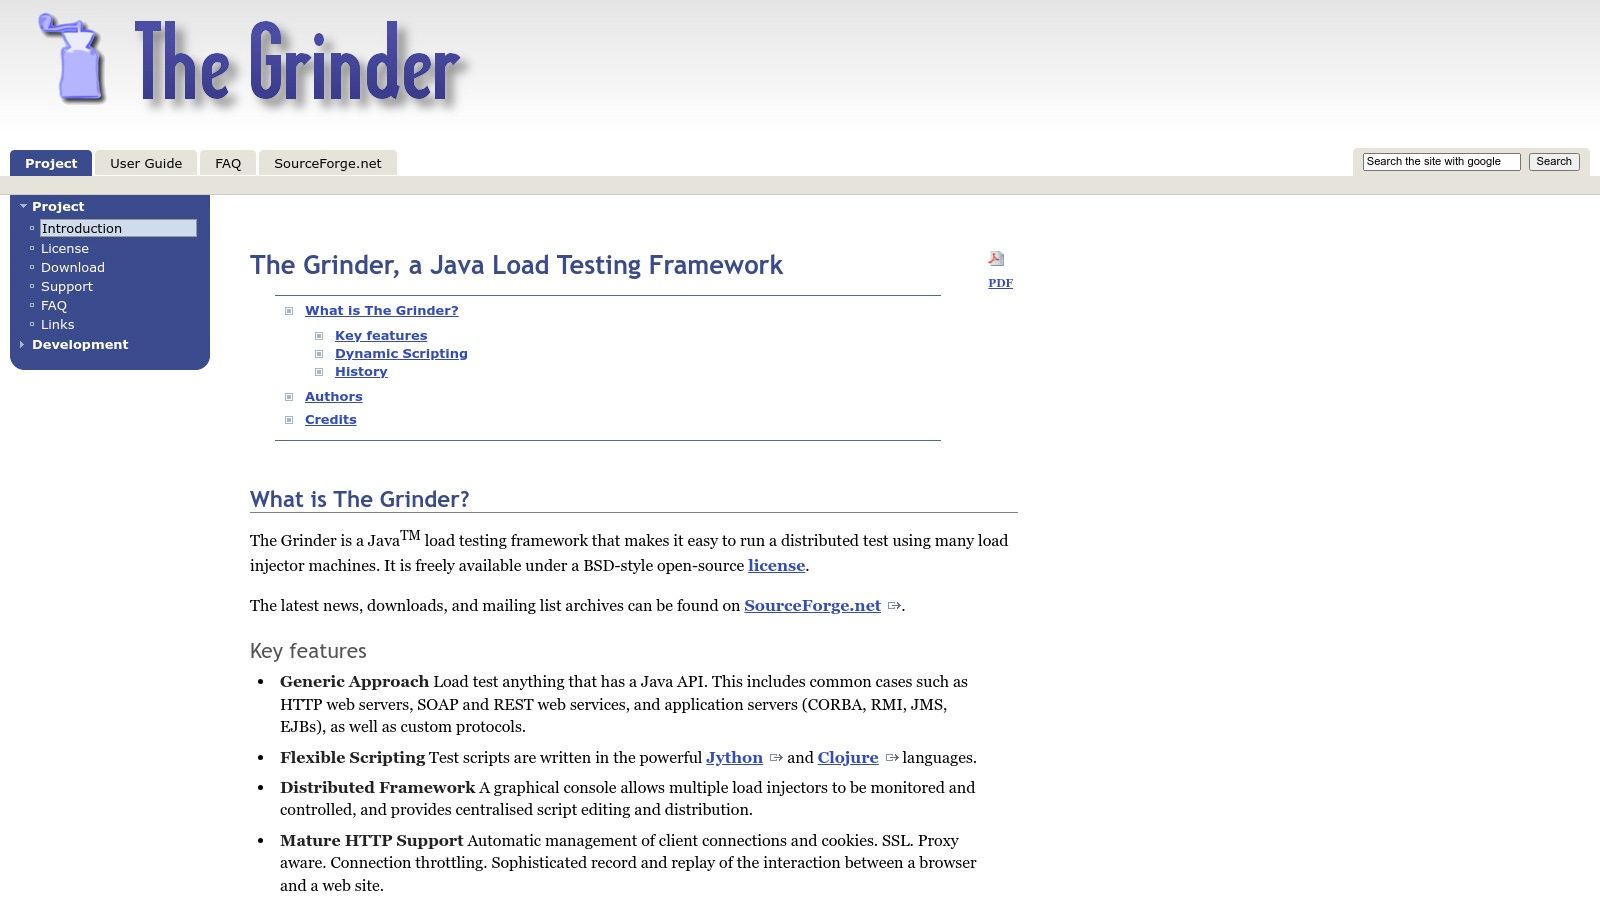
The Grinder is completely free to download and use from this site. Its standout feature is its powerful scripting capability using Jython (Python on Java) or Clojure, which gives engineers full access to Java APIs. This makes it a highly flexible and extensible choice among load testing tools open source, especially for complex or custom testing scenarios where standard GUI tools may fall short.
Key Features & Use Cases
- Powerful Scripting: Test scripts are written in Jython or Clojure, allowing for sophisticated test logic, dynamic data handling, and direct interaction with Java libraries. This is ideal for testing applications with complex state management or custom protocols.
- Distributed Testing Architecture: The framework is built for scalability. It uses a console to coordinate multiple load injector agents, making it possible to generate massive, distributed loads against an application from various machines.
- Live Monitoring: A GUI console provides live monitoring and control over tests. Users can view key metrics in real-time, adjust load levels on the fly, and manage test execution across all distributed agents.
Website Link: https://grinder.sourceforge.net/
9. Tsung Official Website
The Tsung official website is the primary resource for a highly scalable, multi-protocol distributed load testing tool. Built on Erlang/OTP, Tsung is engineered for stressing IP-based servers and simulating massive user loads with exceptional efficiency. The site acts as a central repository for downloads, in-depth documentation, and community-contributed content, making it essential for anyone looking to leverage one of the most powerful open source load testing tools for high-concurrency scenarios.
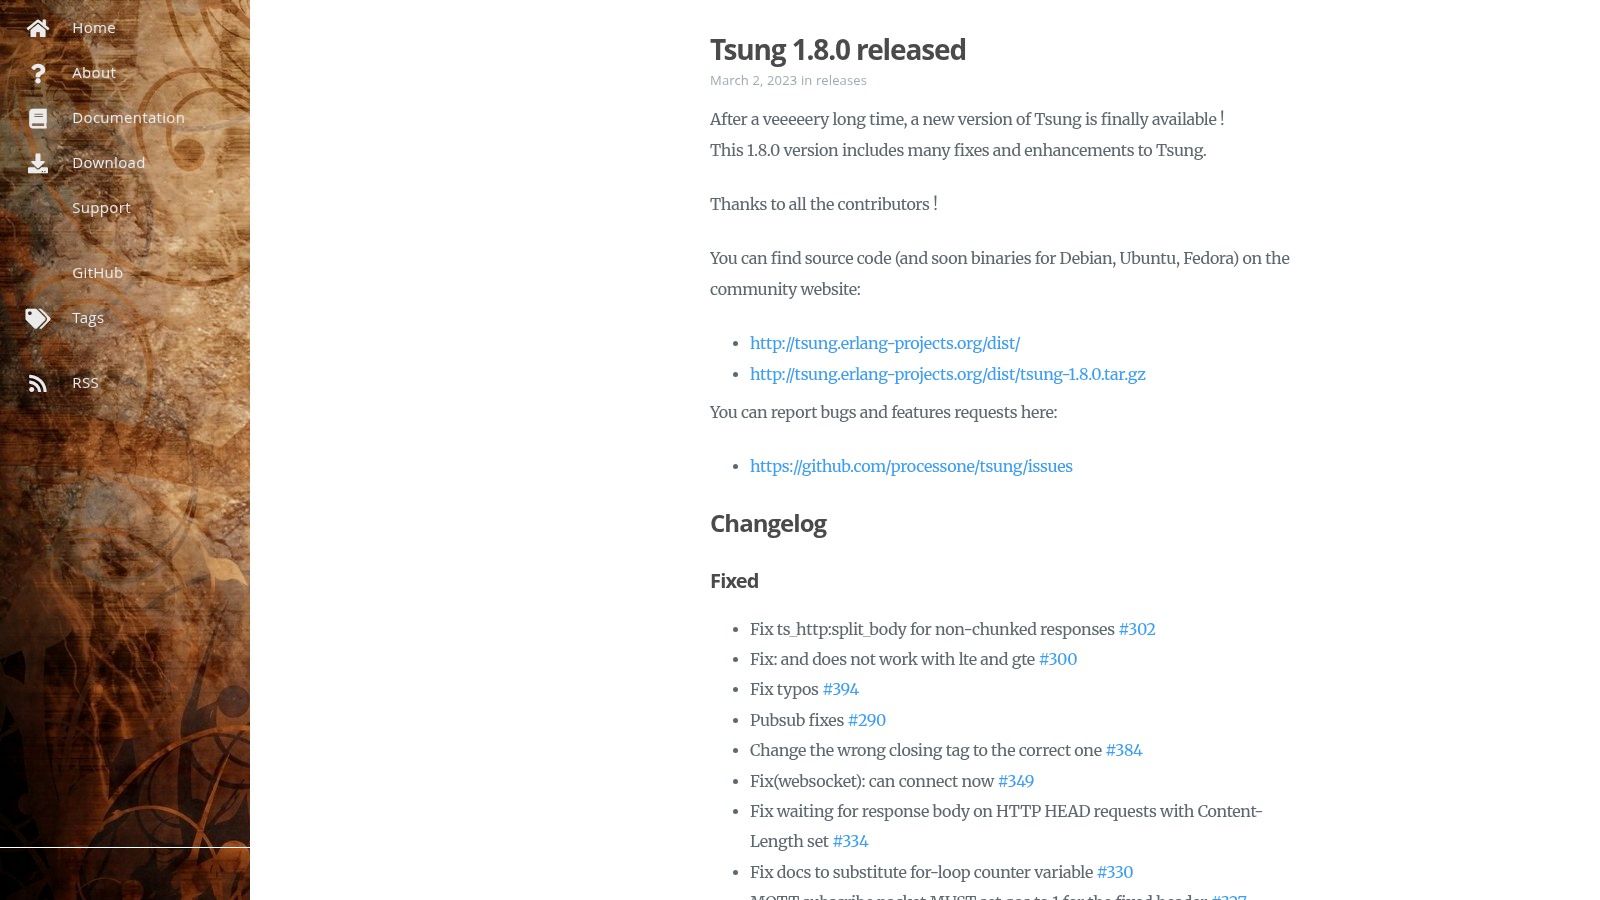
As a completely free and open-source project, all software and resources on the site are available at no cost. The website is functional and documentation-centric, providing clear access to technical guides. Its configuration relies heavily on XML files, which offers immense flexibility but requires a steeper learning curve compared to GUI-based tools. This makes it a preferred choice for experienced DevOps and performance engineers.
Key Features & Use Cases
- High Concurrency: Thanks to its Erlang foundation, Tsung excels at simulating hundreds of thousands or even millions of virtual users from a distributed cluster of client machines, making it ideal for testing large-scale systems.
- Multi-Protocol Support: It natively supports HTTP, WebDAV, SOAP, PostgreSQL, MySQL, and LDAP. This versatility allows teams to test complex architectures involving web servers, databases, and other backend services within a single test plan.
- Real-time Monitoring: The platform includes a web-based monitoring interface that provides real-time graphs and statistics during a load test, helping engineers identify performance bottlenecks as they occur.
Website Link: http://tsung.erlang-projects.org/
10. Siege Official Website
The official website for Siege is the primary home for this minimalist yet effective HTTP load testing and benchmarking utility. Siege is designed for one thing: brutally testing web servers. The website reflects this philosophy, offering a no-nonsense, direct path to downloading the tool, accessing its manual, and understanding its command-line-driven approach to performance assessment. It is a completely free, open-source tool.

The platform is purely informational, prioritizing function over form. Its simple design makes it easy for developers and sysadmins to quickly grab the software and get started. Siege’s appeal lies in its simplicity and low resource usage, making it an excellent choice among open-source load testing tools for quick, straightforward stress tests without the overhead of more complex solutions.
Key Features & Use Cases
- Command-Line Interface: Siege operates entirely from the command line, which is perfect for integration into automated scripts and CI/CD pipelines. You can initiate a test against a URL with a single command.
- Simple Stress Testing: Its core function is to stress test single or multiple URLs simultaneously. You can configure the concurrency level and test duration to simulate a specific amount of user traffic.
- Basic Authentication and Cookies: Despite its simplicity, Siege supports basic authentication, cookies, and HTTPS, allowing it to test a wide range of web applications and secure endpoints. It’s ideal for quick performance checks on APIs or websites.
Website Link: https://www.joedog.org/siege-home/
11. ApacheBench (ab) Official Documentation
For developers needing a quick and straightforward way to measure web server performance, the official documentation for ApacheBench (ab) is an essential resource. As part of the Apache HTTP Server package, ab is a command-line utility designed for simple, direct HTTP load testing. The official documentation page serves as the definitive guide, detailing every command-line flag and option available to users, ensuring tests are configured correctly for accurate results.

This platform is purely informational, providing the technical specifications needed to run ab, which is already included with most Apache installations and requires no separate download. Its value lies in its simplicity and accessibility, making it one of the most fundamental open source load testing tools for quick benchmarks. The documentation is direct and technical, perfect for developers who need fast answers without navigating a complex GUI or extensive setup process.
Key Features & Use Cases
- Simple Command-Line Interface:
abis executed directly from the terminal, making it ideal for quick, on-the-fly performance checks. A single command can initiate a test, for example,ab -n 100 -c 10 http://example.com/. - Basic Concurrency Testing: It excels at sending a specified number of concurrent requests to a single URL, which is perfect for understanding how a server handles simultaneous user traffic under basic conditions.
- Rapid Benchmarking: The tool provides immediate, fundamental metrics like requests per second, time per request, and transfer rate. This is highly useful for before-and-after comparisons when optimizing server configurations or code.
Website Link: https://httpd.apache.org/docs/2.4/programs/ab.html
12. Taurus Official Website
The official Taurus website is the central resource for an open-source automation framework that dramatically simplifies performance testing. Taurus acts as a wrapper, providing a unified and human-readable YAML-based syntax to control other popular load testing tools like JMeter, Gatling, and Locust. The site offers direct access to downloads, extensive documentation, and examples to get you started.
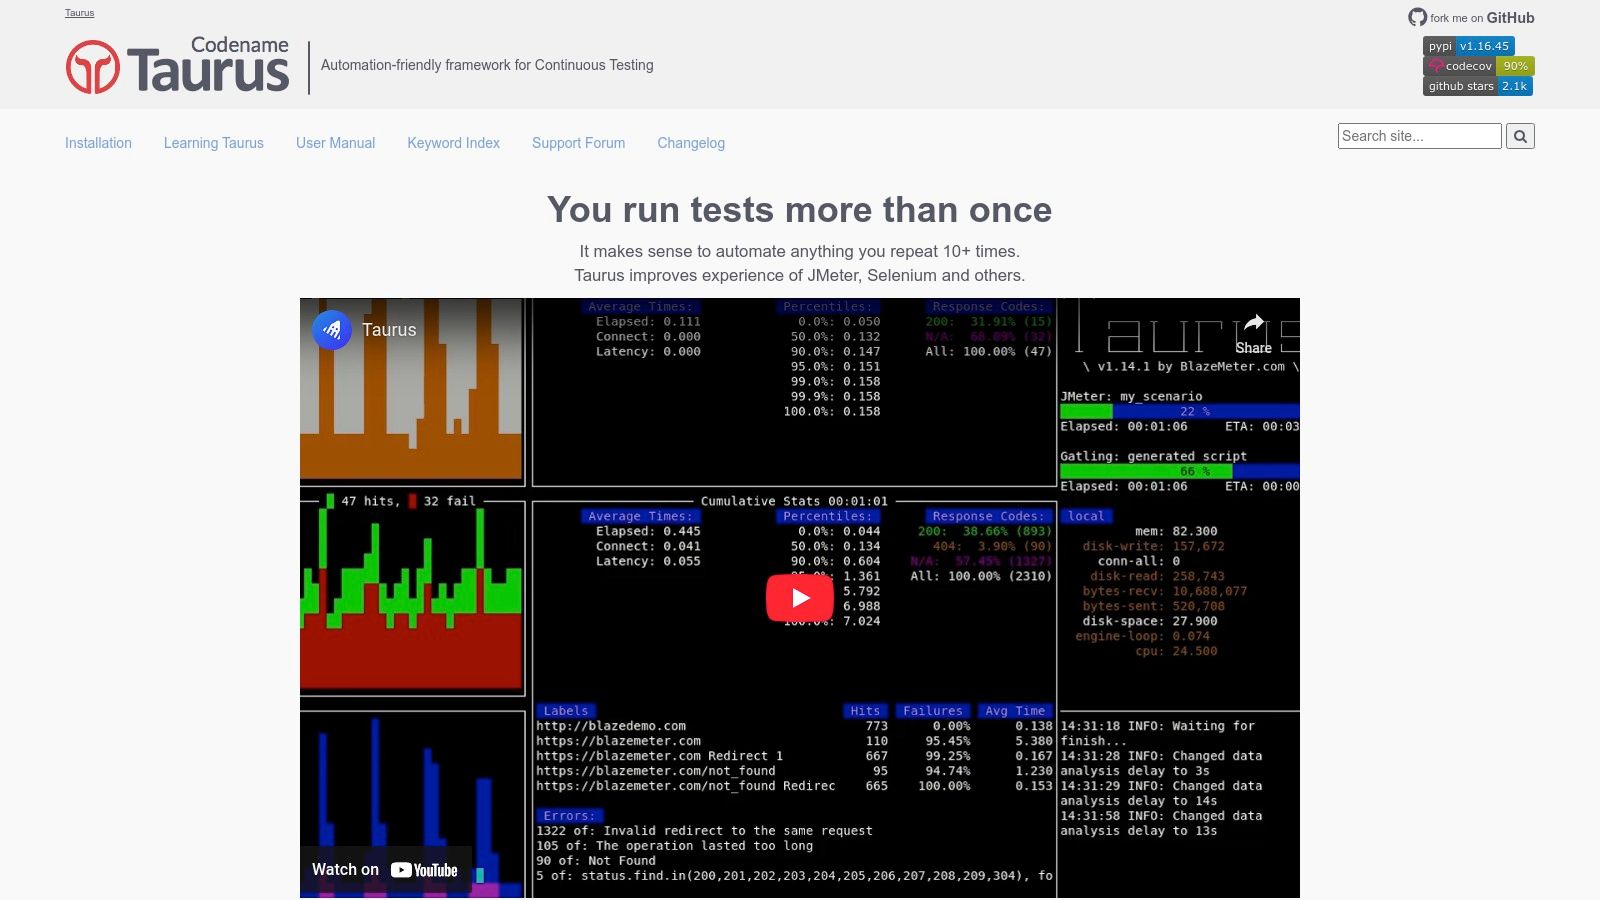
This platform is completely free and focused on abstracting the complexity of individual tool configurations into a single, simple format. Its value proposition is clear: write your test plan once in simple YAML and let Taurus handle the execution with the underlying tool of your choice. This makes it an invaluable asset for teams looking to integrate performance testing into their CI/CD pipelines without a steep learning curve.
Key Features & Use Cases
- Unified DSL: Taurus uses a simple YAML-based Domain Specific Language. This allows you to define complex load tests, including concurrency, ramp-up times, and pass/fail criteria, in a readable and version-controllable file.
- Multi-Tool Support: It provides an abstraction layer over JMeter, Gatling, Locust, and others. This lets you leverage the strengths of different tools without needing to learn their specific scripting languages or GUIs for basic-to-intermediate tests.
- CI/CD Integration: Designed for automation, Taurus integrates seamlessly with CI/CD tools like Jenkins, Bamboo, and TeamCity. It provides clear, automatable pass/fail results, making it a cornerstone for continuous performance testing practices.
Website Link: https://gettaurus.org/
Key Feature Comparison of 12 Open Source Load Testing Tools
| Tool | Core Features/Capabilities | User Experience & Quality ★★★★☆ | Value & Pricing 💰 | Target Audience 👥 | Unique Selling Points ✨ |
|---|---|---|---|---|---|
| GoReplay 🏆 | Capture & replay real production HTTP traffic, session-aware replay, TLS optimization, advanced analytics (Pro) | ★★★★★ Realistic & session-preserving replay | Free OSS + Pro with priority support 💰 | Developers, QA, Enterprise IT 👥 | Real user traffic for testing, advanced analytics dashboard ✨ |
| Apache JMeter | Multi-protocol support, GUI, plugin ecosystem, distributed testing | ★★★★ Mature with extensive documentation | Free Open Source 💰 | QA engineers, Testers, DevOps 👥 | GUI + broad protocol support |
| Grafana k6 | JS/TS scripting, CI/CD integration, HTTP/2, WebSocket, Cloud | ★★★★ Developer-friendly CLI | Free OSS + Cloud options 💰 | Developers, DevOps 👥 | Modern scripting, cloud execution |
| Gatling | Scala DSL, async architecture, detailed reports, CI integration | ★★★★ High performance & code-based | Free OSS 💰 | Developers, Performance Testers 👥 | Scala scripting, high concurrency |
| Locust | Python scripting, web UI, distributed testing | ★★★★ Simple, scalable, web-based UI | Free OSS 💰 | Python devs, QA engineers 👥 | Python-based, real-time monitoring |
| Artillery | YAML config, HTTP/WebSocket support, real-time metrics | ★★★ Easy setup, CLI only | Free OSS 💰 | Developers, Testers 👥 | YAML configs, CI integration |
| Vegeta | CLI load testing, constant request rates, library integration | ★★★ Simple, lightweight | Free OSS 💰 | Developers, DevOps 👥 | Go library usage, precise rate control |
| The Grinder | Jython/Clojure scripting, distributed load, GUI monitoring | ★★★ Flexible scripting, GUI support | Free OSS 💰 | Developers, Test Engineers 👥 | Jython/Clojure scripting, GUI console |
| Tsung | Multi-protocol, Erlang-based, distributed, real-time reporting | ★★★ Highly scalable, efficient | Free OSS 💰 | Large-scale testing teams 👥 | Multi-protocol, high concurrency via Erlang |
| Siege | CLI HTTP load testing, basic auth, HTTPS | ★★★ Simple & lightweight | Free OSS 💰 | Developers, small teams 👥 | Minimal setup, CLI-based |
| ApacheBench (ab) | Simple CLI benchmarking, concurrency support | ★★★ Quick & lightweight | Free (bundled with Apache) 💰 | Sysadmins, Developers 👥 | Fast, no extra install needed |
| Taurus | Unified YAML interface for multiple tools, real-time reporting | ★★★ Simplifies orchestration | Free OSS 💰 | Testers, Automation Engineers 👥 | Unified configuration, multi-tool orchestration |
Choosing the Right Tool for Peak Performance
Navigating the landscape of open-source load testing tools can feel overwhelming, but as we’ve explored, this vibrant ecosystem offers a powerful solution for nearly every performance engineering challenge. From the developer-centric scripting of k6 and Gatling to the broad protocol support and GUI of Apache JMeter, the right tool is available to help you build resilient, high-performance systems. The key takeaway is that there is no single “best” tool; the optimal choice is deeply contextual, hinging on your team’s specific needs, existing skill sets, and the unique architecture of your application.
This exploration has highlighted a clear trend: the most effective load testing strategies are moving away from synthetic, approximated user behavior and toward higher-fidelity, realistic traffic patterns. While scripting user journeys has its place, accurately predicting the chaotic and diverse nature of real-world user interactions remains a significant challenge.
Key Factors for Your Selection Process
When evaluating the load testing tools open source options detailed in this article, consider the following critical factors to guide your decision:
- Team Skills and Workflow: Does your team prefer writing tests in code (Go, Scala, JavaScript, Python) or using a graphical interface? Tools like k6, Gatling, and Locust are ideal for teams comfortable with scripting and integrating tests directly into their CI/CD pipelines. In contrast, JMeter offers a lower entry barrier for those who prefer a visual approach.
- Protocol Support: Your application’s tech stack is a major determinant. While many tools excel at HTTP testing, you may have specific needs like WebSockets, gRPC, or database protocols. Be sure to align the tool’s capabilities, like those found in Artillery or Tsung, with your specific protocol requirements.
- Scalability and Distribution: For simulating massive user loads, consider how easily a tool can be run in a distributed fashion. Tools like k6, Locust, and Tsung are architected for distributed testing, allowing you to generate significant traffic from multiple machines.
- Test Fidelity and Realism: The ultimate goal is to understand how your system behaves under real production stress. Scripted tests, no matter how well-designed, are an approximation. For the highest level of confidence, nothing beats using actual production traffic.
This is where a tool like GoReplay truly differentiates itself. By capturing and replaying real user traffic, it bypasses the need for script creation and maintenance entirely. This approach ensures your tests reflect the genuine, unpredictable patterns of your user base, providing unparalleled insights into how your application will perform when it matters most. For teams seeking the most accurate simulation of production conditions, traffic replay offers a definitive advantage.
Ultimately, the journey to selecting the right open-source load testing tool is an investment in your application’s reliability and your users’ experience. Begin by identifying your primary goals, shortlist two or three candidates from this list that align with your needs, and conduct small proof-of-concept tests. This hands-on evaluation will provide the clarity needed to choose the tool that will empower your team to proactively identify and resolve performance bottlenecks, ensuring your application remains fast, stable, and ready for peak demand.
Ready to move beyond synthetic scripts and test your system with the ultimate realism of actual production traffic? Discover how GoReplay can provide the highest-fidelity load testing by capturing and replaying real user requests, eliminating guesswork and ensuring your application is truly production-ready. Explore the power of traffic replay at GoReplay.