A Guide to Load and Stress Testing Your Application
In today’s fast-paced world, poor application performance isn’t just a nuisance—it directly translates to lost customers and revenue. Think of load and stress testing not as technical chores, but as essential business strategies for making sure your application can handle real-world demand without crumbling.
Why Application Performance Is Your Most Important Metric

Let’s be direct—slow, buggy, and unreliable applications kill businesses. When alternatives are just a click away, user patience is razor-thin. Your app’s performance isn’t just some technical metric buried in a dashboard; it’s a direct reflection of your brand’s promise and reliability.
Picture a popular retail store on Black Friday. If the doors jam, the registers freeze, and the staff are overwhelmed, customers won’t wait around. They’ll leave, frustrated and unlikely to ever come back. Your digital application is no different. When it can’t handle a surge in demand, the result is the same: chaos, customer churn, and a badly damaged reputation.
The Real-World Cost of Poor Performance
This link between performance and success isn’t just a theory. It’s backed by hard data showing that even tiny delays have a massive impact.
For instance, Google found that 53% of users will abandon a website if it takes more than three seconds to load. For e-commerce giants, the stakes are even higher. Amazon famously calculated that every 100-millisecond delay in page load time costs them about 1% in sales. That’s a staggering amount of money lost to a fraction of a second. You can find more data on these performance impacts from various industry studies.
Proactive testing isn’t about finding bugs; it’s about building resilience. By simulating real-world demand, you can ensure your application delivers a flawless experience when it matters most, protecting both your brand and your bottom line.
Moving From Reactive to Proactive
Too many teams are stuck in a reactive loop. A customer complains, a server crashes during a big marketing campaign, or a critical feature breaks under an unexpected user spike. This cycle is stressful, expensive, and it erodes customer trust with every failure.
Adopting a proactive mindset flips this dynamic on its head. Instead of waiting for things to break, you intentionally try to break them yourself—but in a controlled environment. This is the whole point of effective load and stress testing. By doing this, you can:
- Protect Your Brand: A smooth, fast, and reliable experience builds trust and loyalty.
- Secure Your Revenue: Keeping your application online and responsive during peak traffic prevents lost sales.
- Build Confidence: Launching new features or running major promotions becomes far less risky when you know your infrastructure can handle the heat.
Ultimately, performance testing is a business continuity strategy. It ensures your most critical asset—your application—is ready to perform under pressure, safeguarding your revenue and reputation.
Understanding Load Testing vs Stress Testing
People often throw around the terms load and stress testing as if they’re the same thing. They’re not. Confusing the two can give you a false sense of security about your app’s stability and lead to some seriously flawed test results.
Let’s use a simple analogy to clear things up.
Think of your application as a bridge. Load testing is all about making sure that bridge can handle its expected daily traffic—all the cars, trucks, and buses crossing during a normal rush hour. The goal is simple: verify that performance and stability hold up under normal and even peak, but predictable, conditions.
Stress testing, on the other hand, is about finding out what happens to that same bridge during a once-in-a-century hurricane. You’re no longer just confirming expected performance. You’re intentionally pushing the structure to its absolute breaking point to see what fails first, how it fails, and if it can recover.
The Core Goal of Load Testing
At its heart, load testing is about validation. It answers one critical question: “Can our application handle the volume of users we actually expect?” This means simulating a specific, realistic user load—like the number of concurrent users you’d anticipate during a holiday sale or a big product launch.
The metrics that matter in a load test are all about performance under that expected load. You’re watching for things like:
- Response Times: Does the application stay quick and snappy for every user?
- Throughput: Can the system process the number of transactions per second you need it to?
- Resource Utilization: Are your CPU, memory, and network resources all operating within safe, acceptable limits?
If your e-commerce site expects 10,000 concurrent shoppers for a Black Friday event, a load test would simulate that exact number. A successful test proves your system performs just as designed when the pressure is on. You can dig deeper into this in our guide on boosting application performance with effective load testing.
The Destructive Nature of Stress Testing
Unlike the validation-focused approach of load testing, stress testing is all about discovery through destruction. The goal is to find your system’s upper limits by piling on an ever-increasing, extreme load until something finally breaks. It’s built to answer a much more intense question: “Where is our breaking point, and what happens when we get there?”
A stress test doesn’t stop at the expected peak load of 10,000 users. It keeps pushing—to 15,000, 20,000, and beyond—until the application starts to buckle.
The real purpose of a stress test isn’t just to watch the system fail. It’s to analyze how it fails. Does it crash gracefully or go down in flames? Does it corrupt data? And, most importantly, how quickly can it recover once the extreme load is gone?
This chart paints a clear picture of what happens when load gets out of hand.
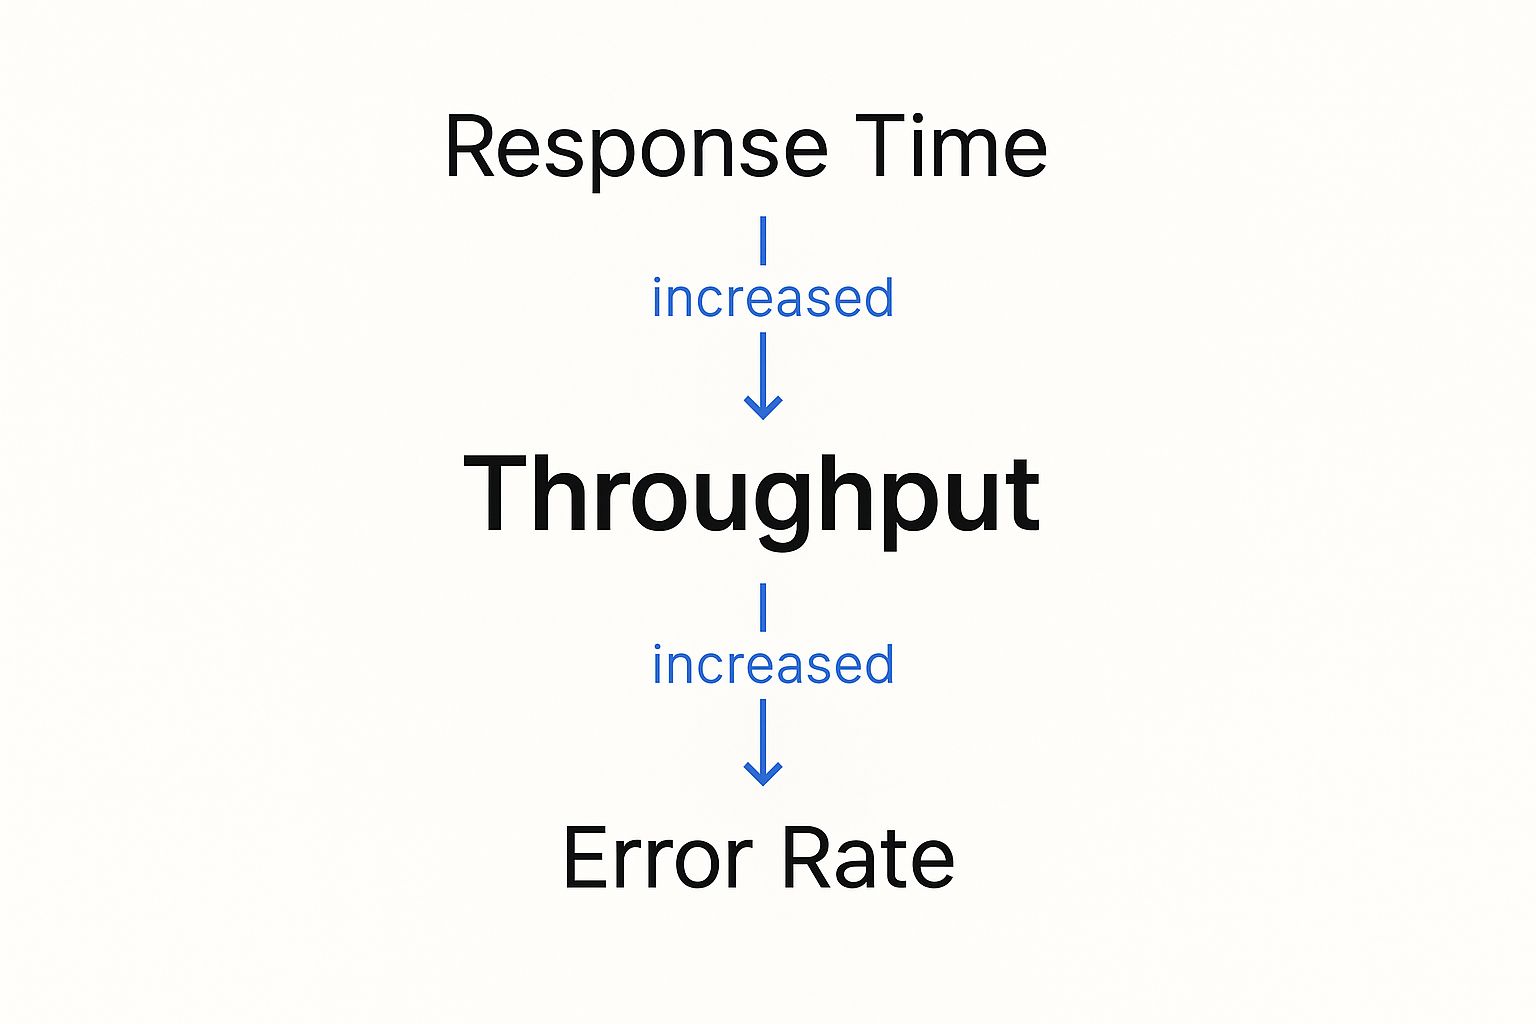
As you can see, as the throughput (user load) goes up, response times eventually skyrocket and the error rate spikes. These are the classic signs of a system in distress.
For instance, a streaming service might use stress testing to get ready for a massive live sports event. They need to know not just if the system can handle millions of viewers, but what happens if viewership unexpectedly doubles. This is the kind of testing that reveals critical information about robustness, recoverability, and vulnerabilities that only show up under extreme duress.
Ultimately, you need both. Load and stress testing are essential partners in building a truly resilient application.
The Shift-Left Movement in Performance Testing

In traditional software development, performance testing was often treated like an afterthought. It was that one big, scary event tacked on at the very end of the cycle, right before a major release.
Think of it like building an entire skyscraper and only checking the foundation’s integrity the day before the grand opening. If you find a crack, the fix is slow, disruptive, and incredibly expensive.
That old approach is fundamentally broken for modern development. In a world of continuous integration and continuous delivery (CI/CD), where teams deploy changes daily or even hourly, waiting weeks to find a performance issue is a recipe for disaster. It creates a massive bottleneck that slows down innovation and forces a painful choice between speed and stability.
This is where the shift-left movement comes in. It’s a simple but powerful idea: move testing activities, including load and stress testing, much earlier in the development lifecycle—or “to the left” on a project timeline.
Why Testing Earlier Is Better
Shifting left means weaving performance testing directly into the fabric of your development workflow. Instead of acting as a final gatekeeper, it becomes a continuous, automated part of the process. This proactive approach helps teams catch performance regressions and bottlenecks the moment they’re introduced, when they are cheapest and easiest to fix.
By making performance a shared responsibility from day one, you build a culture of quality. Developers get immediate feedback on how their code changes impact the system, empowering them to build more resilient applications from the ground up.
The core principle of shifting left is prevention over cure. It’s about making performance an integral part of the development process, not a final exam to be crammed for.
This cultural shift is supported by a booming market for advanced testing tools. The global Load Testing System market was valued at around USD 1.5 billion in 2023 and is projected to hit USD 2.7 billion by 2032. This growth is fueled by digital transformation and the non-negotiable demand for flawless user experiences. You can find more details about this market growth in recent industry analysis.
Integrating Performance Testing into Your CI/CD Pipeline
Implementing a shift-left strategy isn’t about running a massive, full-scale stress test on every single code commit. That would be overkill. Instead, it involves a smarter, tiered approach:
- Component-Level Tests: Run small, lightning-fast tests on individual components or microservices to check for immediate performance regressions.
- Integration Tests: As services are combined, run automated load tests in a staging environment to see how they interact under realistic traffic.
- Pre-Release Stress Tests: Before a major release, run more intensive load and stress tests to validate the entire system’s stability and find its true breaking points.
This progressive model transforms load and stress testing from a feared, one-time event into a routine, manageable practice. It ensures performance is never an afterthought, protecting your user experience and giving your team the confidence to innovate quickly and safely.
Choosing Your Performance Testing Toolkit
Picking the right tool for load and stress testing is one of those decisions that can make or break your entire strategy. It’s not just about running a test; it’s about trusting the results. Your choice directly shapes how realistic your tests are, how accurate the data is, and ultimately, how much confidence you have in your application’s stability.
The world of performance testing is crowded, but most tools fall into two main camps based on how they generate traffic. Getting a handle on this fundamental difference is the first real step toward building a testing plan that actually works.
And this isn’t a niche concern anymore. The Performance Testing Market was valued at USD 0.93 billion in 2024 and is on track to hit USD 1.39 billion by 2033. This boom is fueled by the massive shift to cloud computing and DevOps, where solid, reliable testing isn’t just a nice-to-have—it’s essential. You can get more details on this market growth from Business Research Insights.
Synthetic Traffic Generation Tools
First up is the traditional approach: synthetic traffic generation. Think of tools like JMeter or Gatling. The basic idea is that you write scripts to simulate what users do—clicking a button, filling out a form, or hitting an API endpoint.
These scripts become the blueprint for your virtual users. You define the exact journey, and the tool spins up hundreds or even thousands of these scripted users to hammer your system. This gives you a ton of control, letting you design very specific, repeatable test scenarios.
This level of control is perfect for a few things:
- API Load Testing: You can isolate specific endpoints and hit them with a precise number of requests per second.
- Component Testing: It’s fantastic for testing a single microservice or a new feature in a vacuum.
- Predictable Scenarios: When you need to test a simple, well-defined user flow, synthetic tools get the job done efficiently.
But here’s the catch: the traffic is “synthetic” for a reason. Real users are chaotic and unpredictable. They don’t follow scripts. This gap between scripted behavior and real-world messiness can leave huge blind spots in your tests.
Real Traffic Replication
The second camp is real traffic replication, a newer and far more realistic approach championed by tools like GoReplay. Instead of trying to guess what users will do, you capture the actual traffic from your production environment and replay it in a safe, controlled test environment.
This means you’re testing with the exact sequence of requests, headers, and user actions that your live app sees every single day. It captures all the messy, random, and complex interactions that synthetic scripts almost always miss.
By using real traffic, you are no longer guessing what your users might do. You are testing against what they actually do, which is the ultimate source of truth for understanding application performance.
Comparing Testing Approaches Synthetic vs Real Traffic
The right tool for you really boils down to what you’re trying to achieve. Synthetic tools give you precision for isolated tests, while real traffic replication delivers unmatched realism for validating your entire system.
This table breaks down the key differences to help you figure out which approach fits your needs.
| Feature | Synthetic Tools (e.g., JMeter) | Real Traffic Replication (GoReplay) |
|---|---|---|
| Traffic Source | Scripted, simulated user behavior | Captured traffic from live production users |
| Realism | Low to medium; can miss complex interactions. | High; an exact mirror of real user patterns. |
| Setup Effort | High; requires extensive scripting and maintenance. | Low; capture and replay traffic with minimal configuration. |
| Best For | API testing, component tests, predictable loads. | Full system load testing, regression testing, stress testing. |
| Primary Advantage | High control over specific test scenarios. | Unmatched accuracy and detection of real-world bottlenecks. |
When it comes down to it, if you want a truly comprehensive load and stress testing strategy, replicating real user traffic gives you the highest fidelity. It ensures you’re prepping your application for the challenges it will genuinely face in the wild, not just the ones you could script.
A Practical Guide to Testing with GoReplay
Theory is great, but let’s get our hands dirty. It’s time to move from concepts to concrete steps and see how you can run incredibly realistic load and stress testing with GoReplay. Instead of guessing what your users might do, you’re about to use their actual behavior to build tests that are second to none.
GoReplay’s approach is brilliantly simple. It “listens” to the network traffic hitting your production application, capturing every single request exactly as it happens. This stream of real-world interactions gets saved to a file, which you can then replay on demand against a staging or test environment. Just like that, you’ve turned chaotic, live traffic into a repeatable, reliable testing asset.
Capturing Real User Traffic
First things first: you need to capture that live traffic. GoReplay acts like a passive observer on your network, watching requests and responses fly by without getting in the way. This is a huge advantage. It has almost no performance impact and poses zero risk to your production environment.
Getting started is refreshingly simple. You just run a gor command, telling it which network port to watch and where to save the captured traffic. For instance, to capture traffic from port 80 and save it to traffic.gor, the command is as straightforward as this:
Capture traffic from port 80 and write it to a file
gor —input-raw :80 —output-file traffic.gor
This command kicks off the capture process, silently recording every incoming request until you decide to stop it. The result? A traffic.gor file that contains a perfect, high-fidelity recording of your users’ actual behavior—the ultimate foundation for realistic load and stress testing.
Filtering and Replaying Traffic for Different Scenarios
Now that you have a recording of production traffic, you’ve got a powerful tool for all kinds of testing scenarios. One of GoReplay’s best features is its ability to manipulate this traffic when you replay it. You can filter out requests you don’t need, tweak headers, and—most importantly—control the replay speed.
This ability to dial the speed up or down is what lets you use the very same traffic file for different kinds of tests:
- Regression Testing (1x speed): Replay traffic at its original pace. This is perfect for checking if recent code changes have introduced any new bugs or performance issues under normal, everyday conditions.
- Load Testing (5x-10x speed): Crank it up! By replaying traffic at five or ten times the original rate, you can simulate how your system handles a Black Friday sale or a viral marketing campaign.
- Stress Testing (20x+ speed): Push your system until it breaks. Replaying traffic at an extreme rate helps you find the true breaking point and see exactly how your system fails—and how gracefully (or not) it recovers.
The command to replay traffic is just as simple. To send your captured file to a test environment at 10 times the original speed, you’d run this:
Replay traffic to a test server at 10x speed
gor —input-file traffic.gor —output-http “http://test-server.com|1000%”
That |1000% is the magic right there. It tells GoReplay to accelerate the traffic by 10x, instantly turning a normal day’s traffic into a potent load test.
Analyzing the Results to Find Bottlenecks
Capturing and replaying traffic is only half the story. The real gold is in the analysis—finding those hidden performance weaknesses. As GoReplay replays traffic, it compares the responses from your test environment with the original responses it recorded from production.
This screenshot from GoReplay’s website gives a great high-level look at how it all works.

The diagram shows the traffic shadowing process in action. Live traffic is sent to both production and staging at the same time, allowing for a direct, side-by-side comparison of how each system behaves.
By digging into these comparisons, you can quickly spot critical issues that only show up under realistic load:
- Rising Error Rates: Are some endpoints suddenly throwing more 5xx server errors on the test server than they do in production?
- Performance Degradation: Are response times for certain requests getting painfully slow when the system is under pressure?
- Response Mismatches: Is your test environment returning different data than production for the exact same request?
The beauty of this approach is its precision. You aren’t just seeing that the system is slow; you are seeing exactly which requests are failing or dragging their feet. This allows your development team to zoom in on the root cause with surgical accuracy.
This approach transforms load and stress testing from a vague, hit-or-miss exercise into a data-driven diagnostic process. It gets rid of the guesswork and gives you actionable insights, empowering you to find and fix bottlenecks long before they ever affect a real user. By using real traffic, you can be confident that your application isn’t just stable in theory—it’s been battle-tested against the real world.
Common Mistakes to Avoid in Load and Stress Testing
Executing load and stress testing is one thing; getting trustworthy, actionable results is another challenge entirely. It’s surprisingly easy for teams to run tests, only to be misled by flawed data. This wastes valuable time and, worse, creates a false sense of security.
Avoiding just a few common mistakes can dramatically improve the value you get from your testing efforts.
Unrealistic User Behavior and Environments
The most frequent error we see is testing with unrealistic user data and behavior. If your tests simulate users following a single, perfect path through your app, you’re not preparing for the real world.
Real users are wonderfully unpredictable. They abandon carts, hammer the back button, and poke at features in ways you never intended. Scripted tests often miss the chaotic, random interactions that actually cause systems to fail.
Another major pitfall is using a test environment that doesn’t accurately mirror production. Testing on a scaled-down server or with different network configurations will produce results that are simply not reliable. Performance bottlenecks that appear on your production hardware might never show up on your test setup, and vice-versa.
Misinterpreting Results and Ignoring Recovery
A successful stress test doesn’t just end when your system falls over. The real value comes from what you learn during and after that failure.
A critical mistake is ignoring system recovery metrics. Knowing your application breaks at 20,000 concurrent users is useful, but knowing it takes 15 minutes to recover and corrupts data in the process is the kind of insight that prevents a real catastrophe.
To sidestep these common errors, you can focus on a few practical solutions:
- Use Realistic Traffic: Instead of guessing with scripts, capture and replay real production traffic. This ensures your tests reflect how actual users behave, giving you far more accurate insights into how your system performs under genuine pressure.
- Create a Production Mirror: Your staging environment should be as close to a 1:1 replica of production as possible. This includes hardware specs, software versions, database size, and network architecture. No cutting corners.
- Analyze the Full Picture: Don’t just focus on the breaking point. Measure recovery time, check for data integrity after a failure, and monitor all your system resources (CPU, memory, disk I/O) to understand why the failure occurred.
Ultimately, the goal of load and stress testing is to build confidence in your system’s resilience. By avoiding these common mistakes, you ensure your tests yield the kind of accurate insights that drive meaningful improvements.
For a deeper dive into these concepts, you can explore our detailed comparison of load vs stress testing and their key differences.
Frequently Asked Questions About Performance Testing
Even with the core concepts down, you’ll always have questions when you start putting load and stress testing into practice. Here are a few of the most common ones we hear, with straightforward answers to help you build out your testing strategy.
What Is the Difference Between All These Tests?
It’s easy to get these terms tangled up, but they each serve a very different purpose. Think of it as a hierarchy.
-
Performance Testing: This is the big-picture category. Any test that measures how your system performs—its speed, stability, or responsiveness—falls under this umbrella.
-
Load Testing: This is a specific kind of performance test. The goal here is to see how the system handles a specific, expected amount of traffic. Think of it as a dress rehearsal for your Black Friday sale. You’re not trying to break anything; you’re just validating that it can handle the anticipated rush.
-
Stress Testing: This is where you push things until they break. A stress test throws more traffic at your system than it was ever designed to handle. The point isn’t just to find the breaking point, but to see how it breaks and, just as importantly, how gracefully it recovers.
To put it simply, performance testing is the overall discipline. Load testing is running a marathon at your goal pace, and stress testing is sprinting until you hit a wall.
How Often Should We Run These Tests?
There’s no magic number here—it really depends on how you build and ship software. A good rule of thumb is to match your testing cadence to your development cycle.
If your team lives and breathes CI/CD, you should automate lightweight load testing. Kicking off smaller tests with every major build or feature merge is a fantastic way to catch performance regressions the moment they’re introduced. This is what people mean when they talk about “shifting left.”
On the other hand, save the big, intensive stress tests for major milestones. You’ll want to schedule these before a huge new release, a significant infrastructure migration, or right before a massive marketing campaign you know will drive a traffic spike.
Can I Test on a Live Production Environment?
This is a tempting idea, but it’s incredibly risky. Running a heavy load or stress test directly against your live production system is a recipe for disaster. At best, you’ll degrade the experience for your real users; at worst, you could cause a full-blown outage that costs you revenue and customer trust.
The gold standard is to use a dedicated staging environment that mirrors production as perfectly as possible. We’re talking identical hardware, software, network setups, and a database of the same scale. This is precisely where tools that replicate real traffic shine. They let you hammer your staging environment with authentic user behavior without ever putting your live service on the line.
Ready to stop guessing and start testing with real-world traffic? With GoReplay, you can capture and replay your actual production traffic to run the most realistic load and stress testing possible. Find and fix bottlenecks before they ever impact a single user. Get started with GoReplay today.