Mastering JMeter Performance Testing

JMeter performance testing is all about analyzing and measuring how well your software holds up under pressure. It’s the process of simulating heavy, real-world user loads to find performance bottlenecks, check response times, and make sure your application stays stable when it matters most.
Why JMeter Is Essential for Modern Performance Testing

Before we jump into the technical nitty-gritty, it’s worth taking a moment to appreciate why Apache JMeter is still a titan in performance engineering. For years, it has been the go-to tool for developers and QA pros who need to know their apps can handle anything from a Black Friday traffic surge to everyday user activity.
At its core, JMeter is more than just a tool—it’s a framework for asking critical business questions. Can our infrastructure actually support that huge marketing campaign we’re about to launch? Will this shiny new feature tank the user experience for everyone else?
This versatility is exactly why it’s so widely used. Apache JMeter commands a massive 11.7% share of the entire software testing tools market. It’s a trusted workhorse in sectors like IT (29% of users), computer software (17%), and even financial services (5%). Its flexibility makes it a fit for businesses of all shapes and sizes, from medium-sized companies (49% of users) to large enterprises (24%). You can dive deeper into the data on JMeter’s market position and see its impact firsthand.
JMeter Core Features at a Glance
So, what really makes JMeter indispensable? It’s the killer combination of powerful features, all wrapped up in a free, open-source package. This table breaks down the core strengths that keep teams coming back.
| Feature | Description | Primary Benefit |
|---|---|---|
| Platform Independence | Built entirely on Java, allowing it to run on Windows, macOS, and Linux without a hitch. | Your team can work in their preferred OS without worrying about compatibility issues. |
| Protocol Support | Goes beyond HTTP/S to support web services (SOAP/REST), FTP, JDBC for databases, LDAP, and much more. | You can test nearly any part of your application stack with a single tool. |
| Open & Extensible | A massive ecosystem of plugins created by the community lets you extend its functionality infinitely. | If you need a specific report or to test a niche technology, there’s likely a plugin. |
| Detailed Reporting | Generates comprehensive test results with graphs, tables, and metrics that can be viewed in real-time. | You get clear, visual data to quickly pinpoint performance problems. |
| GUI & CLI Modes | Offers a user-friendly GUI for test plan creation and a non-GUI (CLI) mode for high-load, automated tests. | It’s easy to get started but powerful enough for complex CI/CD automation. |
This blend of flexibility and power is what makes jmeter performance testing so effective. It lowers the barrier to entry, letting any team implement professional-grade quality assurance.
The real magic of JMeter is its ability to simulate incredibly complex user scenarios with precision. It lets you move beyond simple “hit-and-run” tests and mimic realistic user journeys, giving you data that leads to real performance improvements.
Connecting Technical Tests to Business Value
At the end of the day, performance testing is about protecting the user experience and keeping the business running smoothly. A slow, buggy application has a direct line to lost revenue and a damaged reputation. JMeter gives you the hard data you need to prevent that from happening.
By simulating thousands of virtual users, you can find your system’s breaking points, validate that your infrastructure can scale, and ultimately deliver an experience that keeps users happy. Grasping these capabilities is the first step to making JMeter an indispensable part of your development lifecycle.
Getting Your JMeter Environment Ready for Action
Any serious performance testing effort lives or dies by its environment. If you don’t get the foundation right, you’ll spend more time fighting your tools than you will finding bugs. Trust me, skipping these setup steps is a fast track to skewed results and hours of frustrating troubleshooting.
Before you can even think about building a test plan, you need to lay the proper groundwork.
The first hard requirement is having a compatible Java Development Kit (JDK) installed. JMeter is a pure Java application, so this part is non-negotiable. You’ll need JDK version 8 or higher on your machine, whether it’s Windows, macOS, or Linux.
You can quickly check if you’re good to go by popping open a terminal or command prompt and running:
java -version
If you see a version number, you’re all set. If not, you’ll need to download and install the right JDK for your system before you can move on.
Installing JMeter and the Must-Have Add-Ons
With Java ready, you can grab the latest stable release of JMeter from the official Apache JMeter website. The “installation” is about as simple as it gets—just unzip the downloaded file wherever you want it. No installers, no fuss.
But a fresh JMeter installation is just a starting point. To really get things done, the very first thing you should do after launching JMeter is install the Plugins Manager. This little tool is a lifesaver. It makes adding and managing plugins—which add all sorts of powerful features—an absolute breeze. Just download the manager’s JAR file and drop it into JMeter’s lib/ext directory.
Once you fire it up, you’ll be greeted by the JMeter GUI, which will become your command center for building tests.
The interface is pretty intuitive, with your test plan elements organized in a tree on the left and the configuration for each element on the right.
Tuning JMeter for Heavy-Duty Testing
Right out of the box, JMeter is pretty conservative with its memory usage, usually capping its heap size at around 1GB. That’s fine for tinkering and building small scripts, but it’s a major bottleneck when you start simulating serious traffic. Push it too hard, and you’ll be staring at an OutOfMemoryError.
To avoid this, you need to give JMeter more memory to work with by tweaking its JVM heap settings. You’ll find what you need in the jmeter.bat file (for Windows) or the jmeter script (for macOS/Linux) inside the bin directory.
Look for a line that looks something like this:
HEAP="-Xms1g -Xmx1g"
Go ahead and increase those values. For a machine with 8GB of RAM, a good starting point would be to give JMeter half of that:
HEAP="-Xms4g -Xmx4g"
Pro Tip: Always set the initial heap size (
-Xms) and the maximum heap size (-Xmx) to the same value. This stops the JVM from pausing your test midway through to resize its memory, a little hiccup that can add unwanted noise to your performance results.
Getting your environment configured this way from the start builds a stable foundation. It ensures that when you run a large-scale jmeter performance testing campaign, the only limits you hit are the ones in your application—not your testing tool.
Building a Realistic and Effective Test Plan

With your environment ready to go, it’s time to turn your testing goals into an actual script. In JMeter, this script is called a Test Plan, and it’s the absolute heart of any performance test. Think of it as a detailed blueprint that tells JMeter exactly how to simulate user traffic, what they should do, and how to know if your application is responding correctly.
A classic mistake is just hammering a single URL with thousands of requests. This tells you very little about real-world performance. Users don’t just stare at your homepage; they follow complex, multi-step journeys. A truly realistic test plan mimics these journeys, giving you a much clearer picture of how your system actually behaves under pressure.
Let’s walk through building a practical Test Plan for a classic e-commerce flow: a user logs in, searches for a product, and then looks at the results.
Defining Your Virtual Users with Thread Groups
The very first thing you’ll add to a blank Test Plan is a Thread Group. This is where you define your entire pool of virtual users. Each “thread” represents a single user, and you get granular control over how they all behave.
Inside the Thread Group, you’ll focus on three critical settings:
- Number of Threads (users): This is just what it sounds like—the total count of virtual users you want to simulate. For this example, we’ll start small with 10 users.
- Ramp-Up Period (in seconds): This setting dictates how long JMeter takes to get all your threads active. Setting a ramp-up of 20 seconds for our 10 users means a new user starts their journey every two seconds. This prevents an unnatural, instantaneous spike in traffic.
- Loop Count: This tells each user how many times to repeat the entire test flow. We’ll set this to 5, so each of our 10 users will perform the login-and-search sequence five times, giving us a total of 50 interactions.
This setup simulates a gradual build-up of user activity instead of an unrealistic, all-at-once burst. It’s a crucial detail for spotting how your system handles a scaling load.
A well-configured Thread Group is the foundation of a believable test. By controlling the ramp-up and user count, you can model everything from a slow trickle of morning traffic to a sudden Black Friday rush.
Simulating User Actions with Samplers
Okay, we have our users. Now, what should they do? In JMeter, these actions are defined using Samplers. Since we’re testing a web application, the sampler you’ll use most often is the HTTP Request sampler. Every sampler represents a single request a user’s browser would send to your server.
For our e-commerce flow, we would nest the following HTTP Request samplers inside our Thread Group:
- GET Login Page: The first stop for any user is to load the login page itself.
- POST Login Credentials: Next, the user submits their username and password, which is a POST request containing their form data.
- GET Search Page: Once logged in, they navigate to the main product search page.
- GET Search Results: Finally, the user enters a search query (like “laptop”) and gets the results back.
You’ll need to configure each of these samplers with the correct server name, path, and request method (GET or POST). This sequence of samplers creates a logical user journey that mirrors a real interaction. For a deeper dive into scripting more complex scenarios, especially for APIs, our guide on load testing REST APIs with JMeter has some great advanced examples.
Adding Realism with Config Elements
A real browser does much more than just send basic HTTP requests; it also manages things like headers, cookies, and cache. To make your jmeter performance testing more convincing, you need to simulate this behavior with Config Elements.
There are two essential Config Elements you should add to almost any web test:
- HTTP Header Manager: This element lets you define the HTTP headers sent with every single request. A common one is
User-Agent, which tells the server your “user” is browsing from Chrome, Firefox, or Safari. This can be critical if your site serves different content to different browsers. - HTTP Cookie Manager: This one is absolutely non-negotiable for any application that uses sessions. The Cookie Manager automatically stores any cookies the server sends back (like a session ID after a successful login) and includes them in all future requests. Without it, your virtual users would be logged out immediately after their first action.
By adding these elements at the Thread Group level, they automatically apply to all samplers underneath, ensuring consistent and stateful user sessions across the board.
Validating Responses with Assertions
So how do you actually know if your test is passing? A “200 OK” response code is a decent start, but it doesn’t tell the whole story. The server could be returning a friendly-looking error page that still sends a 200 status code. This is where Assertions save the day.
Assertions validate the server’s response to make sure it’s not just available, but also correct. A simple but powerful one to start with is the Response Assertion. You can configure it to scan the page content for specific text.
For our e-commerce scenario, after a user logs in, we could add a Response Assertion to the next request to check for the text “Welcome, [Username]!” This confirms not only that the server responded, but that the login was successful and the correct page was loaded. It makes your test results far more reliable.
Making Your Tests Dynamic and Lifelike
A test plan that just hammers your server with the same hardcoded values over and over again isn’t a test—it’s a recipe for a false sense of security. Real users are messy and unpredictable. They use different logins, search for unique things, and interact with your app in countless ways. If you want to run a meaningful jmeter performance test, you have to mimic that chaos.
Static tests are notorious for missing critical bottlenecks. Sure, your system might fly when every virtual user requests the same cached data. But what happens when it’s hit with thousands of unique, non-cached queries? It could completely fall over. This is why making your tests dynamic isn’t just a nice-to-have; it’s the only way to get results you can actually trust.
We’re going to dig into the two techniques that turn a rigid, robotic script into a realistic simulation: parameterization and correlation. Getting these right is the secret to uncovering the performance gremlins that only show up under a real, varied user load.
Introducing Parameterization with CSV Data
First up is parameterization. This is simply the process of swapping out those hardcoded values in your script—like a username or a search term—with variables. Instead of one virtual user logging in with user1 and pass1 a hundred times, you can have a hundred different users log in with their own unique credentials.
The most common and frankly easiest way to pull this off in JMeter is with the CSV Data Set Config element. It’s a powerhouse component that reads data from a plain text file, line by line, and stuffs those values into variables your test can use.
Let’s say you have a simple users.csv file that looks like this:
username,password
testuser_01,S3cur3P@ss1
testuser_02,S3cur3P@ss2
testuser_03,S3cur3P@ss3
You just add a CSV Data Set Config to your Thread Group and point it to the file.
- Filename: Path to your
users.csvfile. - Variable Names: The column headers from your CSV, like
username,password.
Now, in your HTTP Request for the login, you replace the static values with ${username} and ${password}. That’s it. Every time a new virtual user thread starts, JMeter grabs the next line from the CSV. This one small change instantly makes your test exponentially more realistic.
Understanding Correlation and Dynamic Data
While parameterization handles the data you send to the server, correlation is all about handling the dynamic data the server sends back. Modern web apps are stateful. When you log in, the server doesn’t just say “OK”; it hands you back a unique session ID. When you load a form, it might sneak in a temporary CSRF (Cross-Site Request Forgery) token for security.
If your script tries to reuse the same static session ID or CSRF token for every single user, the server is going to shut you down. Your test will fail, not because of a performance problem, but because your script isn’t acting like a real browser.
Correlation is the art of capturing a dynamic value from one server response and “playing it back” in a subsequent request. It’s arguably the most critical skill for testing complex, modern applications. Without it, your tests are brittle and will break constantly.
Putting Correlation into Practice
Let’s walk through a classic scenario. A user loads a form, and the server’s response HTML includes a unique csrf_token. To submit that form successfully, you must include that exact token.
This is a job for a Post Processor, an element that runs right after a sampler gets a response. The go-to tool for this is the Regular Expression Extractor.
Here’s how you set it up:
- Add the Extractor: Right-click the HTTP Request that gets the form page (the one with the token) and add a Regular Expression Extractor as a child element.
- Name Your Variable: In the “Reference Name” field, give your captured value a name. Something clear like
extracted_csrfis perfect. - Write the Regex: This is where the magic happens. You need a regular expression to find and grab the token. If the token is in an input field like
<input name="csrf_token" value="abc123xyz">, a good regex would bename="csrf_token" value="(.+?)". The(.+?)part is the capture group—it tells JMeter “grab whatever is inside these quotes.” - Set the Template: Use
$1$in the “Template” field. This tells the extractor you want to use the first value it captured (from the first set of parentheses in your regex).
Once that’s configured, every time a virtual user hits that form, JMeter will automatically snatch the csrf_token, save it to the extracted_csrf variable, and have it ready for the next step. In your form submission request, just use ${extracted_csrf}, and you’ll be sending the correct, dynamic token back every single time. Your test now behaves just like a real user’s browser.
Scaling Your Tests for High-Volume Scenarios
https://www.youtube.com/embed/th28Z-IE
Once you’ve built realistic, dynamic scripts, the next logical move is to see how your application behaves under some real pressure. Let’s be honest, a single machine, no matter how beefy, can only generate so much load. When you need to simulate tens of thousands of concurrent users for a proper jmeter performance testing session, you have to think bigger than one load generator.
This is where we get into the advanced stuff. We’ll walk through two powerful techniques that are non-negotiable for any serious performance engineering effort: distributed testing to crank up the load and CI/CD integration to make performance validation a natural part of your workflow.
Unleashing Massive Load with Distributed Testing
Distributed testing is JMeter’s built-in answer to the scaling problem. Instead of running one JMeter instance, you link a bunch of them together to work in concert. The architecture is refreshingly simple: one master machine calls the shots and gathers the results, while multiple slave (or agent) machines do the actual heavy lifting of generating user load.
This setup lets you multiply your load generation capacity by the number of slaves you throw at the problem. If one machine can handle 1,000 virtual users, five machines can push 5,000. Simple math, powerful results.
Getting this up and running involves a few key configuration steps:
- Consistent Setup: Every machine—master and all slaves—must have the exact same version of Java and JMeter installed. Seriously, any mismatch here will just lead to frustration.
- Network Configuration: The master and slaves need to be able to talk to each other. This usually means poking a few holes in your firewall to allow traffic on specific RMI (Remote Method Invocation) ports.
- Defining Slave IPs: On the master machine, you’ll need to edit the
remote_hostsproperty in yourjmeter.propertiesfile. Just add a comma-separated list of the IP addresses for all your slave machines. - Starting the Agents: On each slave machine, fire up the
jmeter-serverscript. This puts the machine into a listening mode, waiting for instructions from the master.
Once that’s all set, you can kick off the entire distributed test right from the master’s command line. This kind of setup is indispensable for simulating the traffic surges that major e-commerce sites or financial apps see during their busiest hours.
Integrating JMeter into Your CI/CD Pipeline
Performance testing shouldn’t be a once-in-a-blue-moon event you do right before a big release. To catch performance regressions before they become major problems, you need to automate it. The best way to do that is by integrating JMeter into your Continuous Integration/Continuous Deployment (CI/CD) pipeline with tools like Jenkins.
The secret sauce here is running your tests in non-GUI mode. Executing tests from the command line is an absolute must for automation—it uses way fewer system resources and is easy to script.
A typical command to run a test and spit out a nice HTML report looks like this:
jmeter -n -t YourTestPlan.jmx -l results.jtl -e -o ./Dashboard
Let’s quickly break down those command flags:
-n: This tells JMeter to run in non-GUI mode.-t: Specifies the path to your.jmxtest plan file.-l: Points to the JTL file where raw results are logged.-e: Instructs JMeter to generate the HTML Dashboard Report after the test ends.-o: Sets the output directory for that HTML report.
In a Jenkins pipeline, you can set up a stage that runs this command automatically every time new code is pushed. This practice, often called “performance testing as code,” ensures that any change that tanks your application’s performance gets flagged immediately, not discovered by angry users in production.
This diagram shows how dynamic data flows within a single test, where user data from a CSV is used in a request, and then data is extracted from the server’s response for the next step.
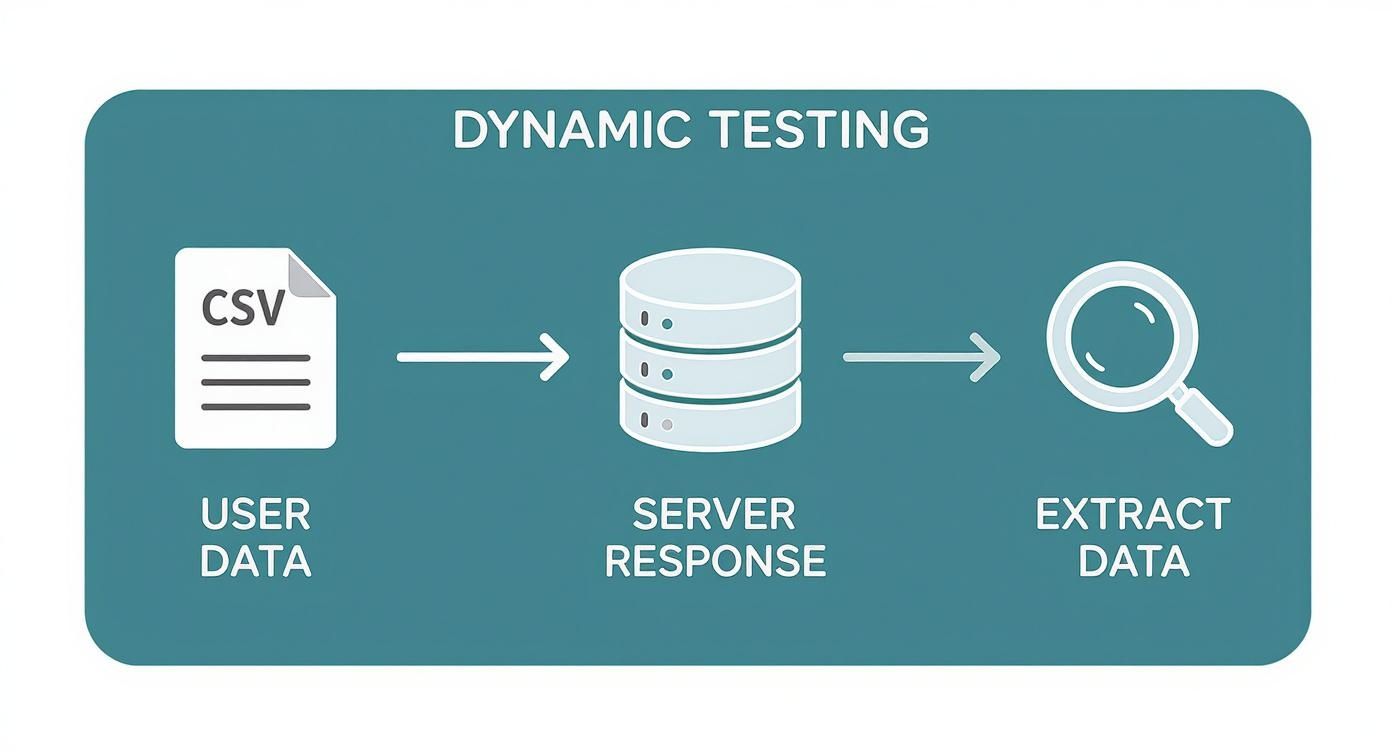 It’s a great visualization of why handling both input data and server-generated data is so crucial for keeping a test realistic and functional.
The global adoption of JMeter speaks volumes. North America, which held a 36.31% share of the performance testing tools market in 2024, is a hotbed for JMeter use. This is largely driven by the presence of hyperscalers, widespread cloud adoption, and mature SRE practices. You can discover more insights about load testing tools and see how JMeter fits into the broader market.
By automating performance checks within your pipeline, you shift quality assurance “left,” making it a proactive part of development rather than a reactive step at the end. This approach is fundamental to modern DevOps and SRE cultures.
Scaling your jmeter performance testing with distributed execution and CI/CD integration turns it from a manual chore into an automated quality gate. It’s what gives you the confidence to deploy changes frequently and reliably, knowing your application can handle whatever your users throw at it.
Turning Test Data into Actionable Insights

Running a big load test is only half the job. Honestly, it’s the easier half.
The real value from any jmeter performance testing comes from what you do with the results—transforming that mountain of raw numbers into a clear story about your application’s health. Without proper analysis, you’ve just collected data. With it, you find the exact weak points that need fixing.
The goal here isn’t a simple pass or fail. You need to diagnose why performance craters under load. Is it a sluggish database query? A poorly written algorithm? Maybe an underpowered server? The answers are all in your test results, but you have to know where to look.
Decoding the JMeter HTML Dashboard Report
Fortunately, JMeter gives you a powerful tool right out of the box: the HTML Dashboard Report. After running your test in non-GUI mode (using the -e -o flags), JMeter spits out a self-contained website packed with charts and stats. This report is your command center for understanding what just happened.
When you first open that dashboard, it can feel a little overwhelming. The trick is to zero in on a few core metrics that tell most of the story.
- APDEX (Application Performance Index): Think of this as a high-level user satisfaction score, ranging from 0 to 1. It buckets response times into “satisfied,” “tolerating,” or “frustrated.” A score near 1.0 is fantastic; anything below 0.5 signals deep trouble.
- Requests Summary: This is your at-a-glance pass/fail count. A high error rate—and I mean anything over 1-2%—is an immediate red flag that demands investigation.
- Statistics Table: This is where the gold is. You’ll find the big three performance metrics here: average response time, median (50th percentile), and the crucial 90th/95th/99th percentiles for every single request in your script.
This is where the real detective work starts. Let’s say the average response time for your “Login” request is a snappy 200ms, but the 99th percentile is a painful 3000ms. That tells you that while most users get in quickly, 1% are stuck waiting for three full seconds. That’s a classic sign of a bottleneck that only shows its face under heavy load.
The most actionable insights often come from comparing percentile data, not just averages. An average can easily hide the painful experience of your unluckiest users, but the 95th and 99th percentiles expose it clearly.
Connecting Metrics to Root Causes
Once you’ve flagged a problematic request from the statistics table, you can dive into the charts to see how it behaved over time. The “Response Times Over Time” graph is perfect for this.
Does the response time for a specific API call start low and then creep up steadily as the test runs? That could point to a memory leak or some other resource exhaustion on the server.
Or maybe the response time suddenly spikes right when the “Transactions per Second” graph flattens out. That’s a strong indicator you’ve hit a hard performance ceiling—the system just can’t process any more concurrent requests. Our essential performance testing metrics guide digs deeper into how these metrics influence each other.
The business impact of this kind of analysis is huge. Good performance testing can lead to a 45% drop in post-deployment issues, a 37% boost in user satisfaction, and even a 23% lift in conversion rates. When you turn raw data into clear action items, you’re not just fixing code—you’re directly improving the bottom line.
By methodically working through the dashboard, you can build a prioritized backlog for your dev team, backed by hard data. You stop saying, “the app feels slow,” and start saying, “the update_cart API call’s 95th percentile response time jumps by 500% when we go over 200 concurrent users.”
That is an actionable insight.
Got Questions About JMeter? Let’s Clear Things Up.
Even the most seasoned performance testers hit a snag now and then. Getting stuck is just part of the process, but spinning your wheels on common problems can kill your momentum. Let’s walk through some of the questions I see pop up all the time.
GUI Mode vs. Non-GUI Mode: When to Use Each?
This is probably the single most important best practice in the JMeter world, so listen up. You should only use JMeter’s GUI mode for scripting, debugging, and validating your test plan. It’s the perfect environment for building out your logic, adding elements, and running a quick sanity check with a single virtual user to confirm everything is firing correctly.
But when it’s time to run the actual load test? You absolutely must use non-GUI (command-line) mode. The GUI is a resource hog—it eats up a surprising amount of CPU and memory. If you run a real test from the GUI, you’re not just limiting the load you can generate; you’re actively contaminating your own results. Running from the command line frees up those resources, ensuring your measurements are accurate and your load generator is running as lean as possible.
What’s the Difference Between a Thread Group and a Sampler?
Let’s use a simple analogy. Think of your test plan as a movie script.
The Thread Group is your cast of characters. It controls how many virtual users (threads) are in the scene, how quickly they show up (the ramp-up period), and how many times they run through their lines (the loop count).
A Sampler is a single, specific action one of those characters takes. For example, an “HTTP Request” Sampler is like a character delivering a specific line—it’s one request sent to the server. The Thread Group holds the users, and the Samplers inside it represent the individual actions those users perform.
A realistic test plan is all about sequencing these Samplers within a Thread Group to mimic a real user’s journey. You might have one Sampler for logging in, another for searching for a product, and a third for adding it to a cart. Each step is its own Sampler.
How Can I Make My JMeter Tests More Reliable?
Nothing’s worse than a “flaky” test that fails randomly. If you’re constantly chasing down inconsistent results, you’re wasting valuable time. To build rock-solid, reliable tests, you need to focus on a few key areas:
- Always Use Assertions: A “200 OK” response doesn’t tell you the whole story. The page could be blank or show an error message. Use Response Assertions to check for specific text or HTML elements, validating that the application is actually behaving as expected under load.
- Handle Dynamic Data: This is a big one. Applications use dynamic values like session IDs, CSRF tokens, and other server-generated data that change with every session. If you hardcode these, your tests are guaranteed to fail. You have to implement correlation using extractors (like the Regular Expression Extractor) to capture these values on the fly.
- Keep Your Environment Clean: Your testing tool should never be the bottleneck. Run your load generators on a stable network connection, and as we covered, always use non-GUI mode. This simple step prevents the test machine itself from skewing your results.
While JMeter is a beast for generating load, crafting test scenarios that truly reflect real-world user chaos is another challenge entirely. This is where a tool like GoReplay comes in. It helps you bridge that gap by capturing and replaying actual production HTTP traffic, letting you feed JMeter with authentic, session-aware user behavior. Learn more about how GoReplay works.