A Developer’s Guide to Generating Test Data from Production Traffic
Let’s be honest: how many times have you pushed a feature that sailed through staging, only to watch it buckle under the chaos of real-world traffic? We’ve all been there. The root of the problem is often the test data itself—simplified, manually created datasets that look nothing like actual user behavior.
The best way to bulletproof your system is to capture and replay real production traffic. This creates a high-fidelity simulation that uncovers the kind of sneaky bugs and performance bottlenecks that synthetic data just can’t find. It’s about testing against reality, not a sanitized version of it.
Why Realistic Test Data Changes Everything
Traditional test data generation often fails because it can’t capture the messy, unpredictable nature of how people actually use your application. It’s easy to script the “happy path,” but real users are anything but predictable. They abandon carts, hammer the refresh button, and submit weirdly formatted inputs.
This is where replaying live traffic becomes a total game-changer. Instead of guessing how users might interact with your system, you’re using a perfect replica of their actual behavior. The level of realism you get is just impossible to fabricate any other way.
The Shortcomings of Old-School Methods
For years, teams have been stuck with a few common methods for creating test data, and frankly, they all have major drawbacks:
- Manual Creation: This is where developers or QA engineers punch in data by hand. It’s painfully slow, riddled with human error, and almost never covers more than the most basic use cases.
- Database Dumps: Taking a copy of the production database and masking sensitive fields is a popular option. But this approach is slow, eats up a ton of storage, and completely misses the dynamic behavior of API calls and user sessions. It’s a static snapshot of data, not a replay of interactions.
- Basic Scripting: Writing scripts to generate data gives you more control, but you’re still just coding your own assumptions. These scripts can’t replicate the concurrency, unexpected inputs, and unique interaction patterns of thousands of users hitting your system all at once.
The real issue here is that these methods only test for conditions you can predict. The most critical, system-breaking bugs almost always hide in the scenarios you never even thought to test.
Traffic Replay: The Modern Approach
Replaying production traffic with a tool like GoReplay completely flips the script. It captures the entire request-response lifecycle, preserving the precise context, timing, and sequence of user actions.
This technique is brilliant at uncovering those subtle, hard-to-find issues that other methods miss, like race conditions, performance degradation under weird load patterns, and bugs triggered by unusual API call sequences.
By simulating reality, you can validate your application’s resilience with a much higher degree of confidence before a single line of code hits production. You stop predicting user behavior and start replicating it. That’s what makes this approach so powerful.
Before we dive into the “how,” let’s quickly compare the old and new ways of thinking about test data.
Test Data Generation Methods Compared
| Aspect | Traditional Methods (Manual, Scripted) | Traffic Replay (GoReplay) |
|---|---|---|
| Realism | Low. Based on assumptions and “happy paths.” | High. An exact replica of real user behavior. |
| Coverage | Limited to what you can predict and script. | Comprehensive. Captures all edge cases and unique user flows. |
| Effort | High. Extremely time-consuming to create and maintain. | Low. Capture traffic once and replay it on demand. |
| Bug Detection | Finds predictable, functional bugs. | Uncovers complex, intermittent issues like race conditions. |
| Performance | Simulates simple load, not realistic usage patterns. | Replicates real-world concurrency, timing, and session behavior. |
The table makes it clear: while traditional methods have their place, they can’t provide the confidence needed for modern, complex systems. Traffic replay isn’t just an incremental improvement; it’s a fundamental shift in how we validate software.
Safely Capturing and Anonymizing Production Traffic
Tapping into production traffic is the absolute fastest way to get realistic test data. But it comes with a huge responsibility: you must protect user privacy. One wrong move can expose sensitive information, landing you in a world of compliance violations and broken user trust.
The secret is to capture and anonymize traffic at the same time. You never want raw, sensitive data to even touch your disk.
GoReplay is built for exactly this. It listens at the network level, completely transparent to your application’s core processes. You can start capturing traffic from a specific port, sanitize it on the fly, and save the clean results directly to a file. This is the foundation of a safe, repeatable testing strategy.
This diagram shows the old, manual way of handling data versus the modern approach of using a live data stream.
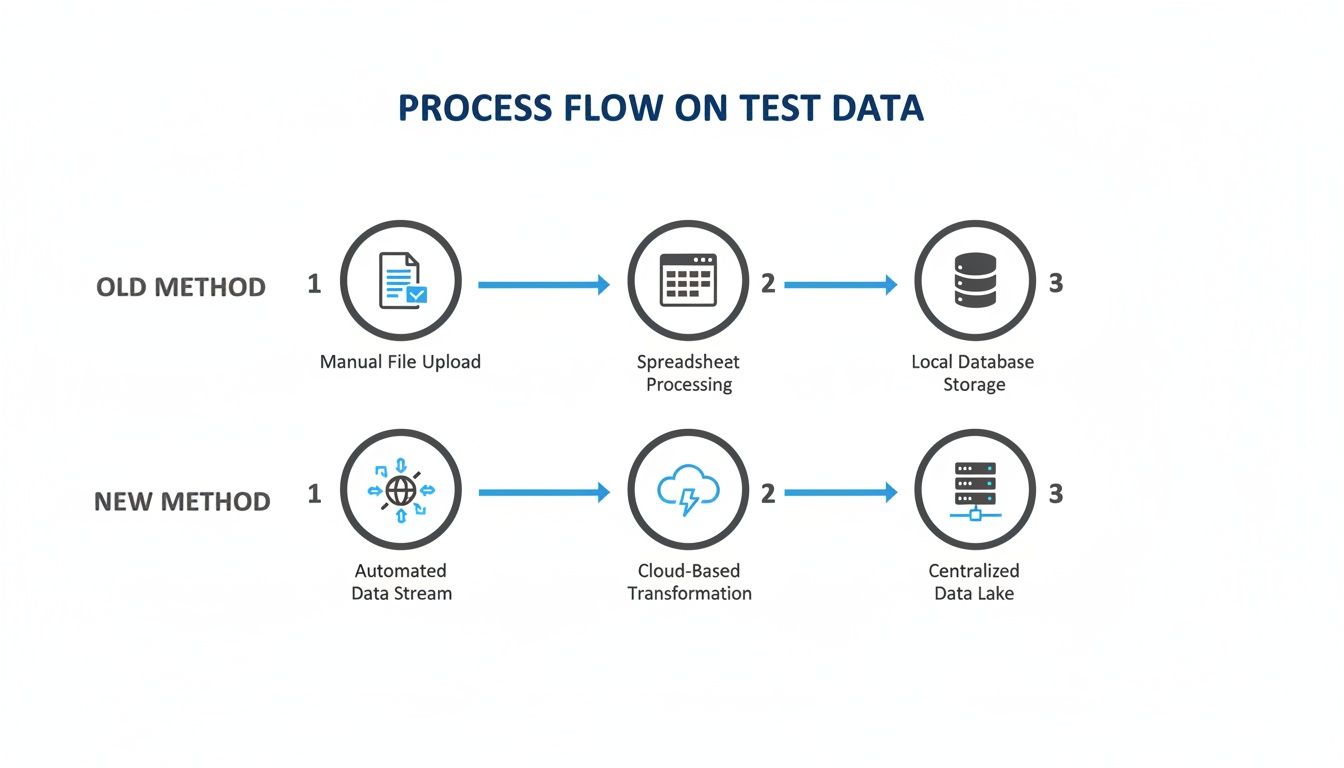
You can see how capturing live traffic cuts out the slow, static steps and creates a dynamic, real-time source for testing.
The Critical Role of Data Masking
Just capturing traffic isn’t enough—you have to aggressively anonymize it. This is where the real magic happens. Personally Identifiable Information (PII) like user IDs, emails, session tokens, and API keys has to be completely scrubbed or replaced.
GoReplay’s rewriting engine is your best friend here. It lets you define rules to modify parts of the HTTP request or response as it’s being captured. We’re not just talking about a simple find-and-replace. This is about systematically transforming sensitive data into meaningless—but structurally valid—placeholders.
The whole point of anonymization is to keep the structure and patterns of the original data without any of the sensitive content. Your test data should look and feel real to your application, even though all private info has been irrevocably changed.
For example, you can use regular expressions to find and hash values like API keys. Hashing is a great technique because it creates a consistent output for the same input. This helps maintain relationships between requests in the same user session without ever exposing the original identifier.
Practical Anonymization Techniques
So, how do you actually do this? The most common places you’ll find sensitive data are in request headers, URL parameters, and the request body itself.
Here’s a quick hit list of what to target:
- Authorization Headers: Any
Authorization: Bearer <token>header needs the token value completely replaced or hashed. - User Identifiers: Fields like
userId,email, orcustomer_idin JSON payloads are non-negotiable. Anonymize them. - Sensitive URL Params: Query parameters holding session IDs or other PII (like
?session=...) have to be rewritten.
For a deeper dive into specific strategies, check out our guide on data anonymization techniques: https://goreplay.org/blog/data-anonymization-techniques/. Getting this right is fundamental for building a dataset that is both realistic and compliant with regulations like GDPR and CCPA.
Building a Safe Data Capture Workflow
Creating a secure workflow is about more than running a few commands. Before you even think about capturing traffic, make sure you have solid protections for your original data, like proper data protection for Office 365.
Here’s a practical approach to structure your process:
- Identify Sensitive Data: First things first, make a comprehensive list of all PII your application touches. Get your development and security teams in a room to make sure nothing gets missed.
- Configure Rewriting Rules: Turn that list into specific GoReplay rewrite rules. Always test these rules on a small, controlled sample of traffic to make sure they’re working exactly as you expect.
- Capture and Anonymize Simultaneously: This is the golden rule. Always run the capture and anonymization steps together. Never write raw, unmasked traffic to a file, not even for a second.
- Store Anonymized Data Securely: Just because the data is anonymized doesn’t mean you can be careless. Treat these files like any other internal asset and store them in a secure, access-controlled location.
Follow these steps, and you can build a rich, realistic dataset that’s completely safe for any development or staging environment. It’s the discipline that lets you harness the power of production traffic without ever putting your users’ data at risk.
Advanced Traffic Replay for Realistic Load Tests
Capturing and replaying raw traffic is a massive leap forward, but let’s be honest—a basic replay often isn’t enough to truly stress-test a modern application. The real magic happens when you start fine-tuning the simulation to mirror the chaos of production with surgical precision.
This is where you move beyond simple error checking and start understanding how your system actually behaves under nuanced, realistic pressure. The goal is to replicate not just the requests, but the complex user journeys and environmental factors that define your live ecosystem.
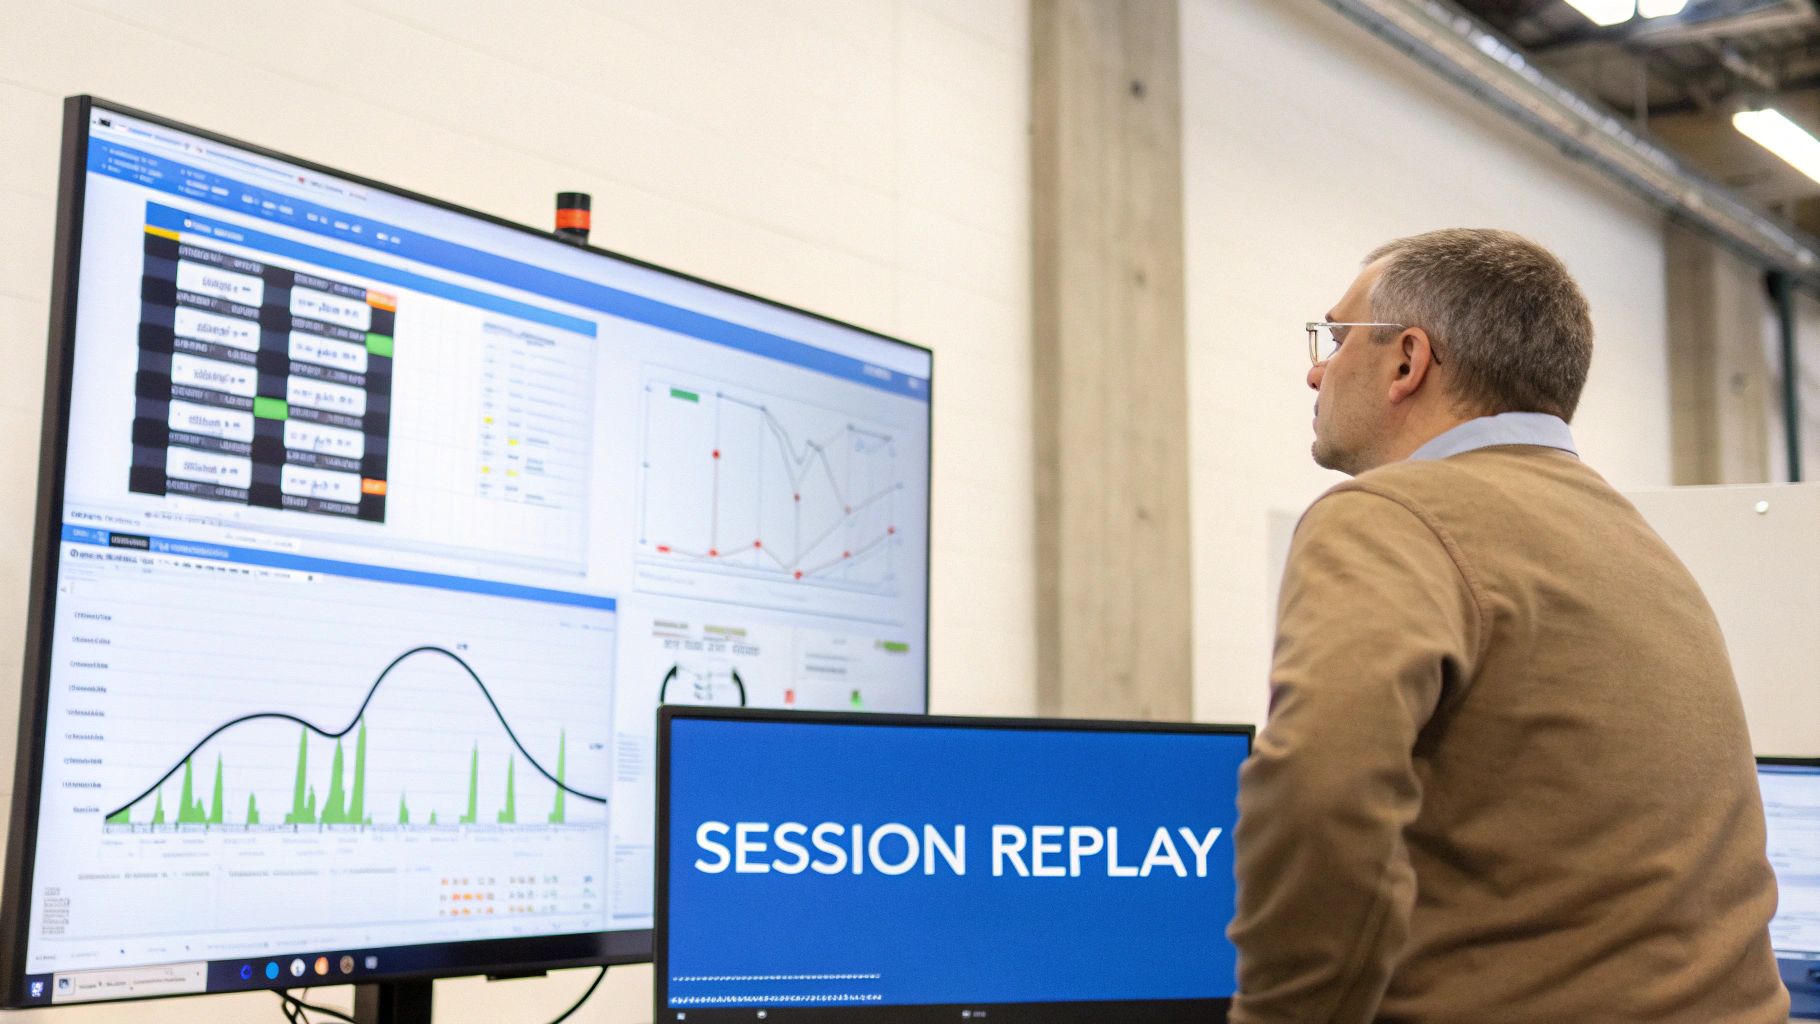
Maintaining State with Session-Aware Replay
For any application that isn’t completely stateless—think e-commerce sites with shopping carts or any app with user logins—a simple, randomized replay is destined to fail. It’s just noise.
Requests that depend on a previous action (like adding an item to a cart before checkout) will generate a flood of errors, creating completely misleading test results. This is precisely why session-aware replay is non-negotiable for generating test data that tells you anything useful.
GoReplay cracks this problem by identifying and tracking user sessions. It ensures that a sequence of requests from a single user is replayed in the correct order, preserving the original context. The tool achieves this by tracking specific headers or cookies that identify a session, like a JSESSIONID or a custom auth token.
You can tell GoReplay which headers to watch by using the --http-allow-header flag. For instance, to track a session based on a custom X-Session-ID header, your command would look something like this:
Capture traffic while recognizing the session header
gor —input-raw :8000 —output-file requests.gor —http-allow-header “X-Session-ID”
Replay traffic, maintaining session integrity
gor —input-file requests.gor —output-http “http://staging-server.com” This one small addition makes your load test dramatically more realistic and valuable by ensuring the replayed traffic respects the logical flow of real user interactions.
Handling Encrypted Traffic and Connections
Virtually all modern applications use TLS/SSL for security, which means your production traffic is encrypted. You can’t just point a capture tool at an encrypted port and expect to see clear HTTP requests. It won’t work.
GoReplay has a straightforward way to handle this: intercept traffic before it gets encrypted. You can do this by running it on the application server itself, listening on a local port where the traffic is still in plaintext.
And when it comes to replaying that traffic against a staging environment that also uses HTTPS? GoReplay handles the TLS handshake automatically. Just point the output to the https:// endpoint and it takes care of the rest.
Pro Tip: Managing network connections efficiently during a high-volume load test is critical. GoReplay’s connection pooling keeps a set of open connections ready to use, which massively reduces the overhead of establishing a new TCP and TLS handshake for every single request. This not only speeds up the test itself but also more accurately simulates how modern clients and servers interact.
Fine-Tuning the Load
Blasting your staging environment with 100% of your production traffic all at once might feel like a good stress test, but in reality, it’s often more of a self-inflicted denial-of-service attack. A much smarter strategy is to control the flow of traffic with precision.
GoReplay gives you several levers to pull here:
- Rate Limiting: You can control the requests per second using a percentage or an absolute number. This is perfect for gradually ramping up the load to find your application’s actual breaking point. For example,
gor --output-http "http://staging.com|200%"instantly doubles the traffic speed. - Traffic Filtering: Not all traffic is created equal. You might want to isolate a specific, problematic API endpoint for a targeted test. GoReplay lets you filter requests based on the URL path, method, or headers.
Here’s a practical example. Let’s say you want to hammer the checkout process. You could isolate all POST requests to your /api/v1/checkout endpoint for a focused stress test like this:
gor —input-file requests.gor
—output-http “http://staging-server.com”
—http-allow-method POST
—http-allow-url /api/v1/checkout
This command replays only the most critical part of your user journey, letting you focus your analysis on a specific feature’s performance without the noise of irrelevant traffic. For more ideas, you might find this article on replaying production traffic for realistic load testing helpful.
By combining these advanced features, you can design sophisticated load tests that provide deep, actionable insights into your system’s true resilience.
Combining Replayed Traffic with Synthetic Data
Replaying production traffic gives you a level of realism that’s frankly unmatched. It’s a perfect mirror of what your users have actually done, showing exactly how your system holds up against known workloads.
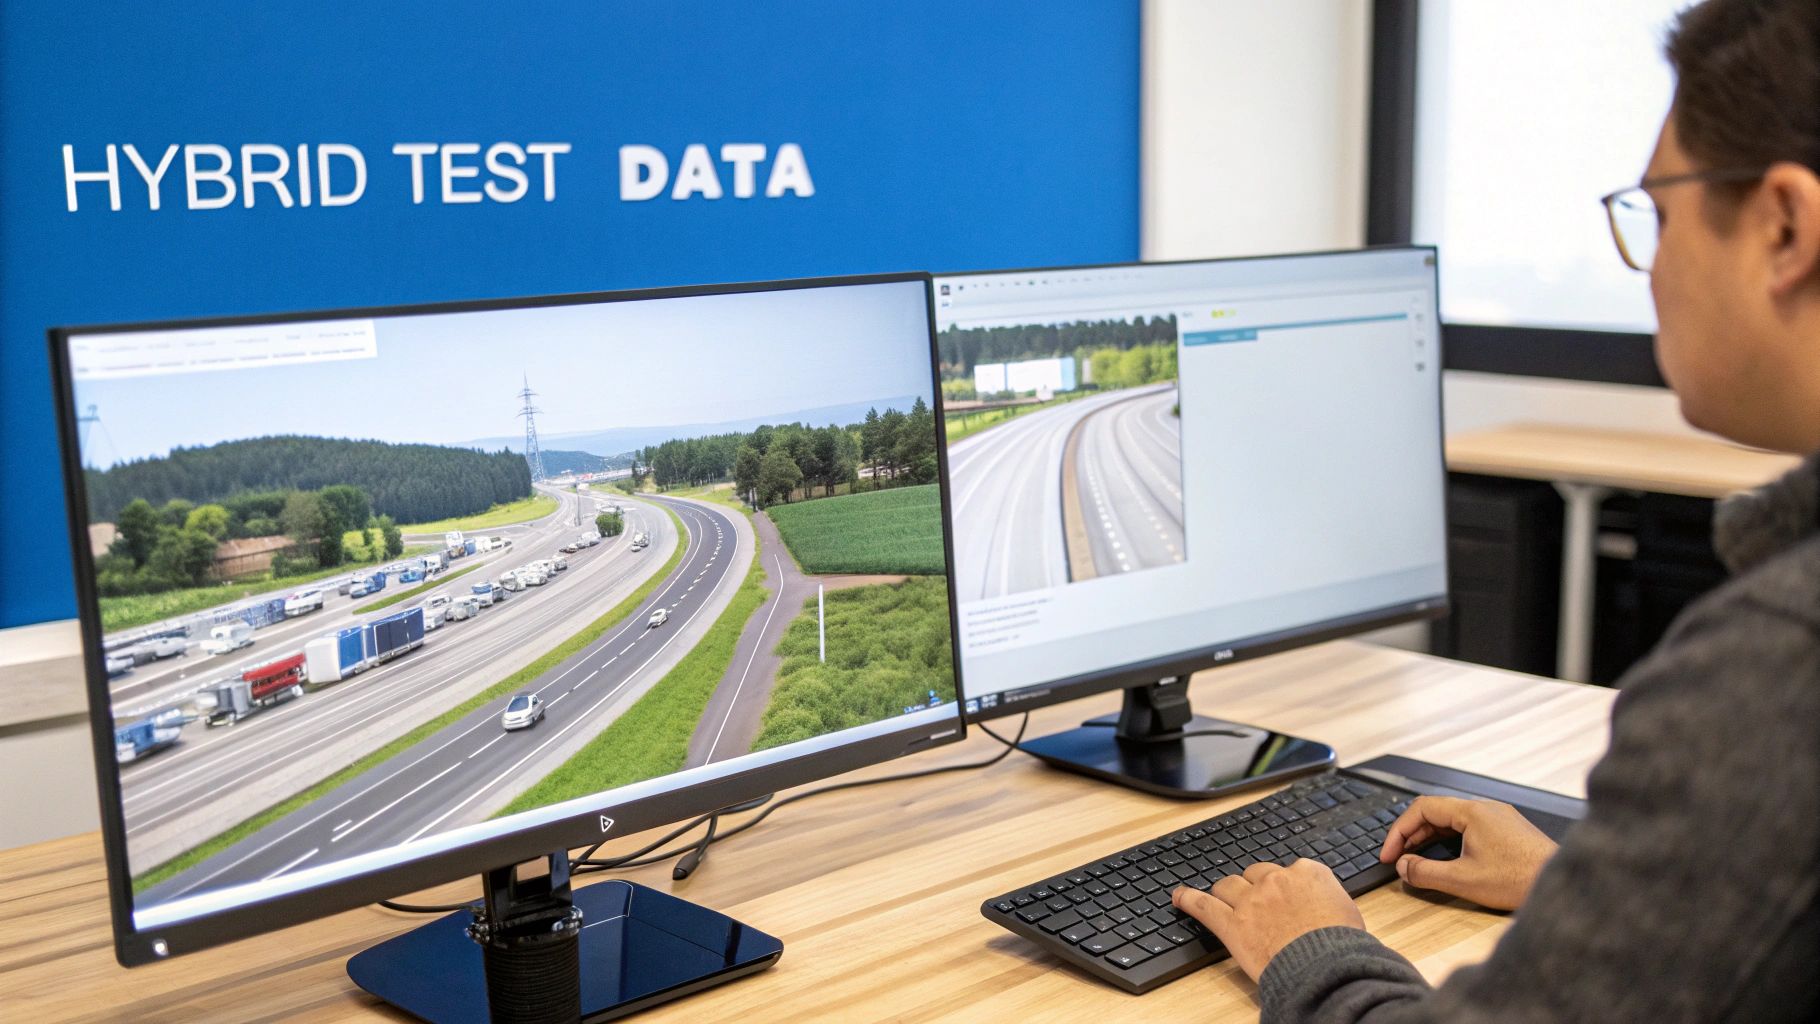
But what about the future? Replayed traffic is, by definition, historical. It can’t tell you how a brand-new API endpoint will perform under pressure or how the system will react to an edge case that’s never happened before. This is where a hybrid strategy becomes a serious game-changer.
By blending the high-fidelity realism of replayed traffic with the forward-looking flexibility of synthetic data, you build a test suite that covers both the known past and the unknown future. It’s about validating today’s system while simultaneously battle-hardening it for tomorrow.
Why You Need Both Data Types
Relying only on replayed traffic can create some serious blind spots. It’s fantastic for regression testing and getting a solid performance baseline, but you’re always limited by what’s already happened. You just can’t replay traffic that doesn’t exist yet.
This is why augmenting your tests with synthetic data is so powerful:
- Testing New Features: You can’t replay requests against an API endpoint that isn’t even live. Synthetic data lets you craft the exact requests you need to test new functionality long before it sees a real user.
- Covering Edge Cases: Production logs might be missing those rare but critical scenarios—think a user with a malformed address or an order with an unusually huge number of items. With synthetic data, you can generate these conditions on demand.
- Security and Fuzz Testing: This is a big one. You can create deliberately mangled or malicious payloads to probe for vulnerabilities. This is the kind of traffic you hope you never see in production, but you absolutely need to be ready for it.
The combination ensures you’re not just confirming past stability but actively fortifying your application against what’s coming next.
The goal is to build a comprehensive test dataset that respects the statistical patterns of your real users while intentionally injecting the specific, targeted scenarios needed to validate new code paths and security postures.
Generating Statistically Similar Synthetic Data
The trick to effective synthetic data is making it believable. Randomly generated strings and numbers won’t cut it; the data has to follow the patterns, correlations, and business logic of your actual system.
Modern tools can analyze your anonymized production traffic to learn these patterns automatically. For example, an AI-powered generator can spot the relationship between a user’s country and the currency they use in a transaction. It then generates entirely new, artificial user profiles that maintain that same logical consistency. This ensures your synthetic data isn’t just noise but a statistically sound extension of your real-world traffic.
This method is also incredibly efficient. Synthetic data generation has slashed data costs by up to 70% for some companies, allowing them to ditch costly masked production snapshots for scalable, privacy-compliant alternatives. In demanding sectors like financial services, organizations have reported a 40-60% cut in model development time by simply bypassing slow data provisioning. You can dig into the full findings on synthetic data cost reduction to see how big of a shift this really is.
A Framework for Hybrid Testing
Integrating these two data sources isn’t about just dumping them into the same test run. It requires a more thoughtful approach, creating distinct scenarios that play to the strengths of each data type.
Here’s a practical framework that I’ve seen work well:
- Baseline with Replay: First, run your captured production traffic against the current version of your application. This gives you a crystal-clear performance baseline for latency, error rates, and resource usage. It’s your source of truth.
- Target with Synthetic: Next, for any new features, create specific suites of synthetic data. These tests should focus exclusively on the new code paths, validating their functionality and performance in isolation.
- Stress with a Mix: Finally, run a combined load test. Blend your replayed traffic with a stream of synthetic data that targets the new features. This simulates a real production environment where old and new functionality are being hammered at the same time.
This layered approach helps you confirm that new features not only work on their own but also don’t introduce performance regressions when thrown into a realistic, mixed-load environment. It’s the ultimate confidence boost before you ship.
Analyzing Test Results and Dodging Common Pitfalls
Running a big load test is just the starting line. The real magic happens when you start digging into the results. Using production traffic gives you an incredibly rich dataset, but knowing how to turn that raw output into actual insights is what separates a successful test from just making a lot of noise.
The goal here is to get past a simple “it passed” or “it failed” and really understand the story your system is trying to tell you. Let’s be honest, a flood of metrics is overwhelming. You need to know what you’re looking for to spot real performance regressions before they sneak into production.
Key Metrics That Tell the Full Story
Once the test wraps up, fight the urge to just glance at the top-line error count. A proper analysis means looking at the whole picture and connecting the dots between several key metrics to find the root cause of any problems.
You should be zeroing in on these areas:
- Application-Level Metrics: This is your front line. Keep a close eye on P95 and P99 latencies—these numbers show you what your slowest users are experiencing. A sudden spike here is usually the first sign something’s wrong. Also, track HTTP error rates (4xx and 5xx codes) to see if the system is buckling under pressure.
- Infrastructure-Level Metrics: Now, look under the hood at your servers. What’s going on with CPU utilization, memory consumption, and I/O wait times? A service might have perfectly fine latency but be redlining its CPU, which tells you it’s one step away from falling over.
- Dependency Metrics: Remember, your application doesn’t live in a bubble. How are your databases, caches, and any third-party APIs holding up? More often than not, a bottleneck that looks like it’s in your app is actually being caused by a downstream service that’s struggling.
The secret sauce is comparing these results against a baseline from a previous test run. Without a baseline, you’re just staring at numbers in a void. A consistent comparison is the only way you can say with confidence whether that new deployment actually introduced a performance regression.
Dodging the Most Common Replay Traps
Replaying production traffic is a powerful technique, but it’s not a magic bullet. I’ve seen a few common pitfalls that can completely invalidate test results or, worse, cause real production headaches. Knowing what they are is the first step to avoiding them.
One of the biggest culprits is environment drift. This is what happens when your staging or test environment isn’t a perfect mirror of production. Tiny differences in hardware, network settings, or even minor software versions can give you totally misleading results. A test that sails through an over-provisioned staging environment might crash and burn in production.
Another classic mistake involves stateful dependencies. If your replayed traffic tries to use something that depends on a specific state—think a one-time-use coupon code—those requests are going to fail. You have to make sure your backend systems are either seeded with the right data or mocked out to handle these kinds of state-dependent calls gracefully.
The most dangerous pitfall is accidentally pointing your test at a live service. Always, always double-check your configuration to ensure your replayed traffic is only hitting your isolated test environment. Accidentally DDoSing a third-party API or even one of your own production microservices is an expensive mistake that is 100% avoidable.
Finally, start thinking about how to get better test coverage than what’s already in your logs. Looking ahead, AI-powered intelligent test data generation is a game-changer in 2026 software testing trends. It can help you cover tons of different scenarios and edge cases with production-like patterns, all while keeping your data private without manual masking. Tools that use AI can analyze historical data to synthesize realistic datasets—perfect for GoReplay users looking to augment their replayed traffic. You can read more about the future of testing trends on testomat.io.
A Practical Troubleshooting Checklist
When a test fails or the numbers just look weird, having a system for troubleshooting will save you hours of pulling your hair out.
Here’s a quick checklist I run through:
- Validate the Test Environment: Is it really identical to production? Check resource allocations (CPU/RAM), software versions, and network ACLs.
- Inspect Error Patterns: Are the errors all coming from one specific API endpoint? That’s a huge clue that can help you isolate the broken part of your code.
- Correlate Spikes: Did that latency spike happen at the exact same time as a surge in CPU usage or a bunch of database connection errors? Connecting these dots often points you right to the bottleneck.
- Review the Replay Logs: Check the GoReplay output itself for any errors during the replay. Sometimes the problem is with the test setup, not your application.
By approaching your analysis with this kind of discipline, you can turn a mountain of test results into a clear roadmap for improvement and make sure your application is truly ready for prime time.
Frequently Asked Questions About Test Data Generation
When you start looking at replaying live traffic to generate test data, a few practical questions always come up. It’s completely normal to have concerns about performance, security, and the tricky, dynamic nature of modern apps.
Let’s walk through some of the most common ones to clear the way.
What’s the Performance Hit from Capturing Traffic?
The thought of adding any new process to a live production server is enough to make an engineer sweat. But tools like GoReplay are built from the ground up to be incredibly lightweight. They work at the network level, passively sniffing packets without getting in the middle of your application’s request-response cycle.
On most modern systems, the CPU and memory footprint is tiny. Think of it as a silent observer, not an active participant.
That said, you should always monitor your system resources during the initial setup just to be sure. It’s just good practice. For servers handling massive amounts of traffic, you can isolate the capture process entirely by running it on a dedicated network tap or a mirrored port. This drops the overhead to virtually zero.
How Do I Keep Sensitive Data Out of My Test Environment?
This is probably the biggest hurdle, especially for teams in regulated industries like finance or healthcare. The absolute safest way to handle this is to never store the raw data in the first place. You do this with real-time rewriting and forwarding.
Instead of capturing traffic and saving it to a file, you process it on the fly.
GoReplay’s middleware lets you grab a request, mask any sensitive data, and immediately forward the now-anonymized request straight to your test environment. This “on-the-fly” processing means PII like API keys or user passwords never even touches a disk. It’s a solid solution for environments with strict data policies like GDPR or HIPAA, since the sensitive info is only handled ephemerally.
By processing traffic in-memory and forwarding it directly, you eliminate the entire category of risk associated with storing raw production data. It’s the most secure way to leverage live traffic for testing.
How Does This Handle Dynamic Tokens?
Ah, the classic replay problem: dynamic tokens and expiring sessions. Replaying a request with a stale auth token is a guaranteed failure, which just creates a ton of noise in your test results. You need a smarter strategy here.
For some tokens, like certain JWTs, you might be able to extract and reuse them with session-aware replay. But for single-use or time-sensitive credentials, like CSRF tokens, you have to get programmatic.
This is where GoReplay’s middleware is your best friend. You can write a small script that intercepts a replayed request, pings your test environment’s auth service to get a fresh token, and then injects that new token into the request before it’s sent. This dynamic token replacement makes sure every replayed request is properly authenticated and valid. It turns what is often a complete blocker into a solvable engineering problem.
Ready to stop guessing and start testing against reality? With GoReplay, you can safely capture and replay production traffic to uncover critical bugs before they impact your users. Get started with GoReplay today and ship more resilient applications with confidence.