
Cloud Platform Testing: Types, Roadmap and Pitfalls

You’ve just moved a service off a fixed server and onto the cloud, and your old test plan suddenly feels thin. The staging run passed, yet production autoscaled late, a managed database failed over in a way you’d never rehearsed, and nobody could say whether the slowdown was your code or a noisy neighbor. That’s the gap cloud platform testing closes. It doesn’t replace functional testing. It checks whether your application still behaves when compute, storage, networking and managed services change underneath it, and whether you can prove that behavior with thresholds written before the run.
Defining Cloud Platform Testing and Why It Differs
Think of a hotel whose rooms are added and removed by the hour to match bookings. Testing a fixed building can’t show you whether that hotel copes when a conference doubles demand overnight.
Cloud platform testing verifies that an application and the cloud services it depends on, including compute, storage, networking, managed databases, queues and identity, behave correctly, perform under load and recover when infrastructure changes. You’re not only testing code. You’re testing provisioning, scaling, isolation and metering as part of the product.
Five characteristics, five tests
The vocabulary comes from NIST SP 800-145, published in September 2011, which defines five essential characteristics of cloud computing. Each one maps to a test you can write:
- On-demand self-service: Provision a new instance, database or bucket through the same API your pipeline uses, and confirm it’s ready, correctly configured and reachable without manual help.
- Broad network access: Call the service from every real client type, browser, mobile app and partner API, and check authentication, TLS and error handling on each path.
- Resource pooling: Run two tenants side by side and confirm neither can read the other’s data, exhaust shared quotas or see the other’s traffic.
- Rapid elasticity: Ramp load up and down and measure how quickly capacity follows, plus whether latency stays acceptable while it does.
- Measured service: Replay a known workload and compare metered storage, processing, bandwidth or active accounts against what you sent.
Who owns which layer
NIST also names three service models, IaaS, PaaS and SaaS, and four deployment models, private, community, public and hybrid. The model decides your test surface. On IaaS you own the operating system and runtime, so you test patching, kernel settings and your own scaling logic. On PaaS the provider runs that layer, so you focus on deployment behavior, configuration and service limits. On SaaS you don’t test the vendor’s internals at all. You test integration, data flows, permissions and what happens when that service is slow or unavailable.
Start by listing which of the five characteristics your product relies on. If you autoscale aggressively, elasticity tests come first. If you bill by usage, metering accuracy comes first. That dependency list decides your first test, not a generic checklist.
Cloud Testing Types, Goals and Metrics
| Test type | Goal | Metrics to track | Example |
|---|---|---|---|
| Functional tests | Confirm features behave on cloud services | Pass rate, error rate | Checkout API returns correct status codes after a managed database failover |
| Load tests | Verify capacity at expected peak | Throughput, p95 latency, error rate | Replay the busiest weekday at 1x speed |
| Stress tests | Find the breaking point | Maximum throughput, saturation point | Push traffic to 2x and 3x peak |
| Soak tests | Detect leaks and drift over time | Memory use, latency trend, error trend | Run a 48-hour replay and watch memory and p95 latency drift |
| Elasticity tests | Check scale-out and scale-in behavior | Time to scale, latency during scaling | Ramp replayed traffic from 1x to 3x and time how long new instances take to serve |
| Fault injection and resilience tests | Measure degradation under faults | Throughput under fault, tail latency, recovery time | Add 200 ms latency between app and database during a replay |
| Failover and recovery tests | Prove recovery targets are met | RTO, RPO | Remove one availability zone during a load test |
| Metering and cost tests | Confirm usage is measured and billed correctly | Metered units vs. replayed requests, cost per replay | Replay a fixed workload and compare meter readings |
| Security and access tests | Confirm tenant and role isolation | Unauthorized requests blocked, token reuse rejected | Reuse a session token from another tenant |
| Portability and exit tests | Prove the workload can leave the provider | Restore time, data loss, verified deletion | Timed restore on a second cloud |
Read the table in launch order. Run load and failover tests before you ship, because they answer whether the service survives a normal peak and a normal failure. Add soak, elasticity and metering tests once real traffic arrives, because those need realistic duration, scaling patterns and usage to mean anything.
What the metrics mean in plain terms
Throughput is completed requests per second. p95 latency is the response time that 95% of requests beat, and p99 latency is the same idea at 99%, so they show the slow tail your unluckiest users feel. Error rate is failed requests as a share of all requests. Time to scale runs from the scaling trigger to new capacity serving traffic. Recovery time objective, or RTO, is how long recovery may take, and recovery point objective, or RPO, is how much data you may lose, expressed as time.
Practical rule: Write the pass threshold for each metric before you run the test, so the result decides the release instead of starting a debate.
Soak tests earn their keep by exposing what short runs hide. A 20-minute load test won’t show a slow memory leak or gradual latency drift, while a 48-hour replay will. The strongest version compares builds directly. One customer puts it plainly: “We soak test our new and old versions of our web service and the compare their metrics to discover bugs. Great stuff!” That quote is from Sahil at videologygroup.com, and the method is sound. Run old and new versions through the same soak replay and compare p95 latency and the memory trend side by side. A leak then appears as a measured gap between two lines, not as a hunch during an incident.
If you can only pick three tests first, pick load, failover and one that matches your biggest dependency from the previous section. Add the rest as your traffic and contract commitments grow.
Availability Budgets That Set Your Test Thresholds
An availability target isn’t an aspiration. It’s a downtime budget you can spend on failures, bad deployments and slow recoveries, and once it’s gone, you’ve broken your promise.
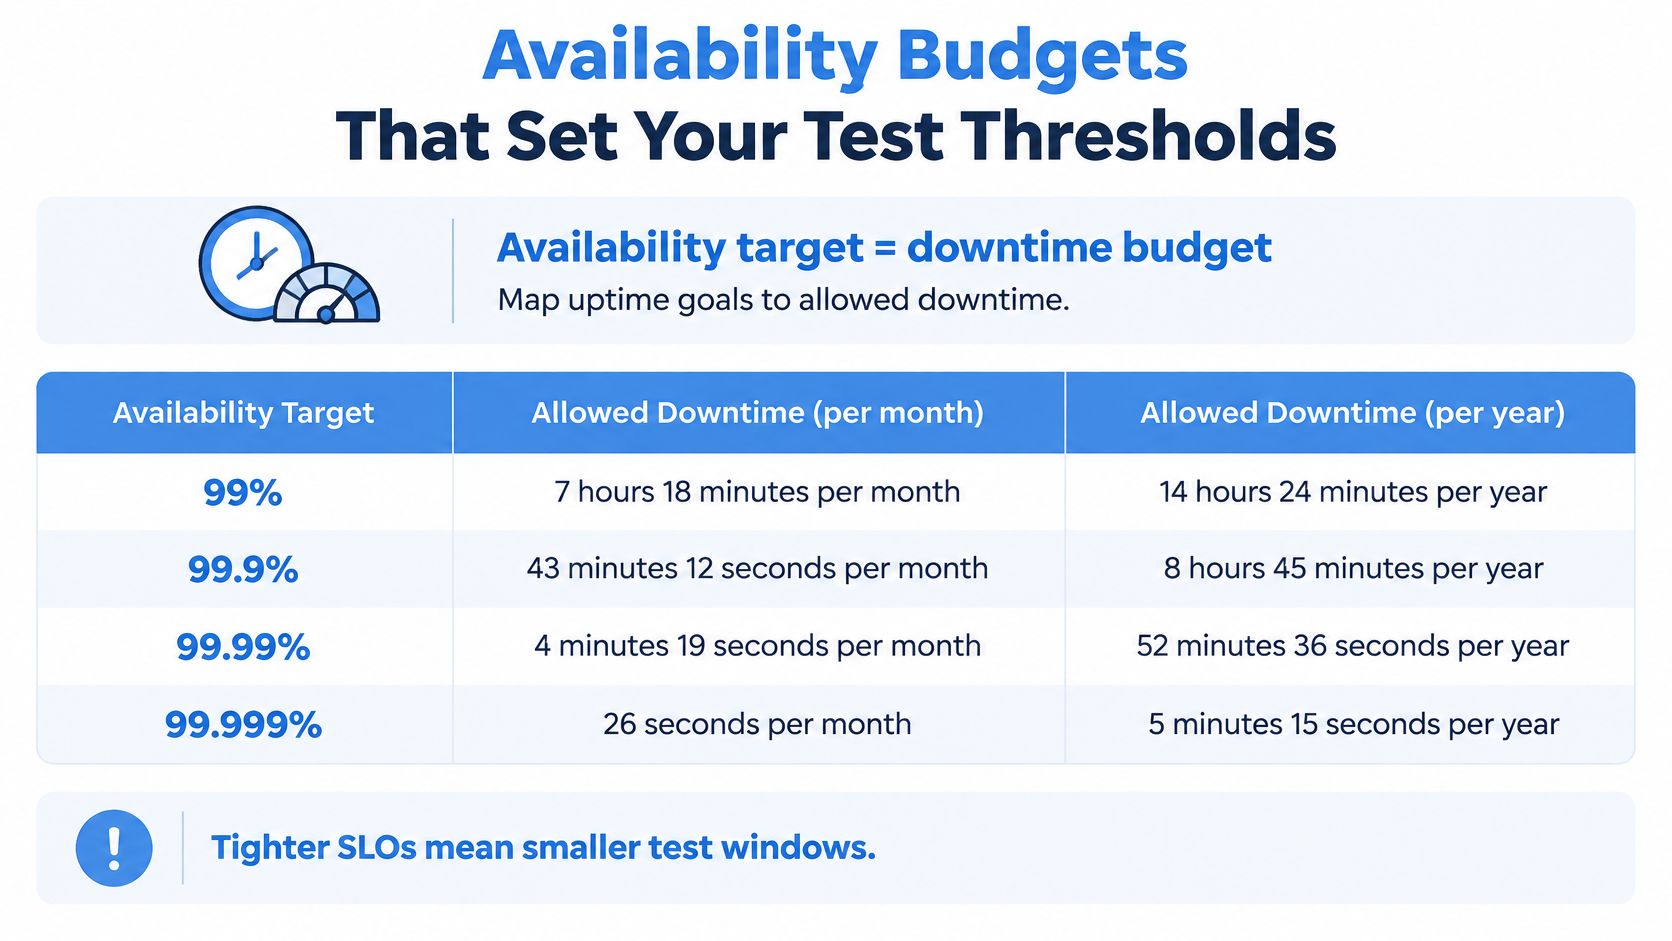
Google’s Site Reliability Engineering availability table makes the trade-off concrete. At 99%, you’re allowed 3.65 days per year, 7.2 hours per month, or 14.4 minutes per day. At 99.9%, that falls to 8.76 hours per year and 43.2 minutes per month. At 99.99% it’s 52.6 minutes per year and 4.32 minutes per month, and at 99.999% it’s only 5.26 minutes per year.
| Availability target | Downtime per year | Downtime per month | Downtime per day |
|---|---|---|---|
| 99% | 3.65 days | 7.2 hours | 14.4 minutes |
| 99.9% | 8.76 hours | 43.2 minutes | 1.44 minutes |
| 99.99% | 52.6 minutes | 4.32 minutes | 0.144 minutes |
| 99.999% | 5.26 minutes | 0.432 minutes | 0.0144 minutes |
Turning minutes into pass and fail lines
Say your contract promises 99.9%. Your monthly budget is 43.2 minutes, so a single failed deployment that takes 45 minutes to roll back breaks the target for that month on its own. Moving from 99.9% to 99.99% cuts the annual allowance from 8.76 hours to 52.6 minutes, which removes roughly 95% of the budget. Small regressions stop being rounding errors at that point.
Use the same minutes inside your tests:
- Load test: It passes only if error rate and latency, projected over a month of real traffic, keep you inside the budget.
- Failover test: It passes only if recovery finishes well within the minutes you have left, not merely if recovery eventually happens.
- Deployment test: Plan the release window against remaining budget. If you’ve already spent most of it, a risky change waits.
Take the availability figure from your customer contract or service-level objective, convert it to minutes per month, and write that number into every test plan. A test without that number can tell you the system got slower. It can’t tell you whether you’re allowed to ship.
Architectures and Environments to Test Against
| Environment | What it validates | Main risk | Typical use |
|---|---|---|---|
| Single-region staging | Application logic and configuration | Capacity differs from production | Feature and regression tests |
| Multi-region replica | Failover and data replication | Replication lag hidden by small tests | Resilience and disaster recovery |
| Shadow environment | Behavior under real requests without user impact | Side effects reaching live systems | Migrations and service rewrites |
| Canary slice | Live behavior on a small share of users | Small sample hides rare errors | Release decisions |
| Ephemeral branch environment | Isolated changes before merge | Missing realistic data and scale | Pull request checks |
| Parallel migration target | Capacity and compatibility on the new provider | Hidden provider-specific dependencies | Provider moves |
These environments layer rather than compete. Single-region staging checks logic and configuration cheaply. A multi-region replica checks replication and failover, which staging can’t. A shadow environment receives copies of live requests while users only see production responses, so you get realistic input with no user risk. A canary slice then exposes a small share of real users when you need live behavior, accepting that rare errors may not appear in a small sample.
Cloud noise will fool a single run
Multi-tenant infrastructure varies from run to run, and that variation can be large. An empirical study spanning AWS, Google Compute Engine and Microsoft Azure found benchmark variability with coefficients of variation ranging from 0.03% to above 100%, depending on workload and instance type. The same study found that running test and control experiments on the same instances, in randomized order, enabled reliable detection of slowdowns of 10% or less, with the Wilcoxon rank-sum test performing particularly well for small regressions.
So don’t judge a candidate from one run against a baseline recorded last week. Pair them in the same region, on the same instance family, under the same autoscaling policy and workload mix. Report medians, tail latency, confidence intervals and error rates, not just averages, because an average can stay flat while the tail gets much worse.
Averages hide the users who are suffering. Distributions show them.
This matters most during migrations. ResDiary used GoReplay to validate infrastructure requirements and ensure a smooth migration from RackSpace to Azure, and successfully migrated its UK and Australia regions. As Lewis at ResDiary said, “Using GoReplay, we were able to accurately estimate our infrastructure requirements and highlight the flaws in our prospective setup.”
Picture a hypothetical team doing the same move. It replays captured traffic against both its current baseline and a parallel migration target, and the target hits a database connection limit that small staging tests never reached. That’s not a reported case, but it shows why realistic volume on the target beats a tidy staging pass.
How to Replay Production Traffic Step by Step
Synthetic load is clean and predictable, which is exactly its weakness. Real users send odd payloads, retry at the worst moment and follow journeys your scripts don’t. Replaying production traffic keeps that messiness, but only if you govern privacy, authorization and spend. That pressure is rising fast, since coverage of 2025 software testing trends citing Sysdig reports a 500% year-over-year increase in workloads running AI or machine-learning packages, while the share of AI workloads publicly exposed to the internet fell 38% in eight months.
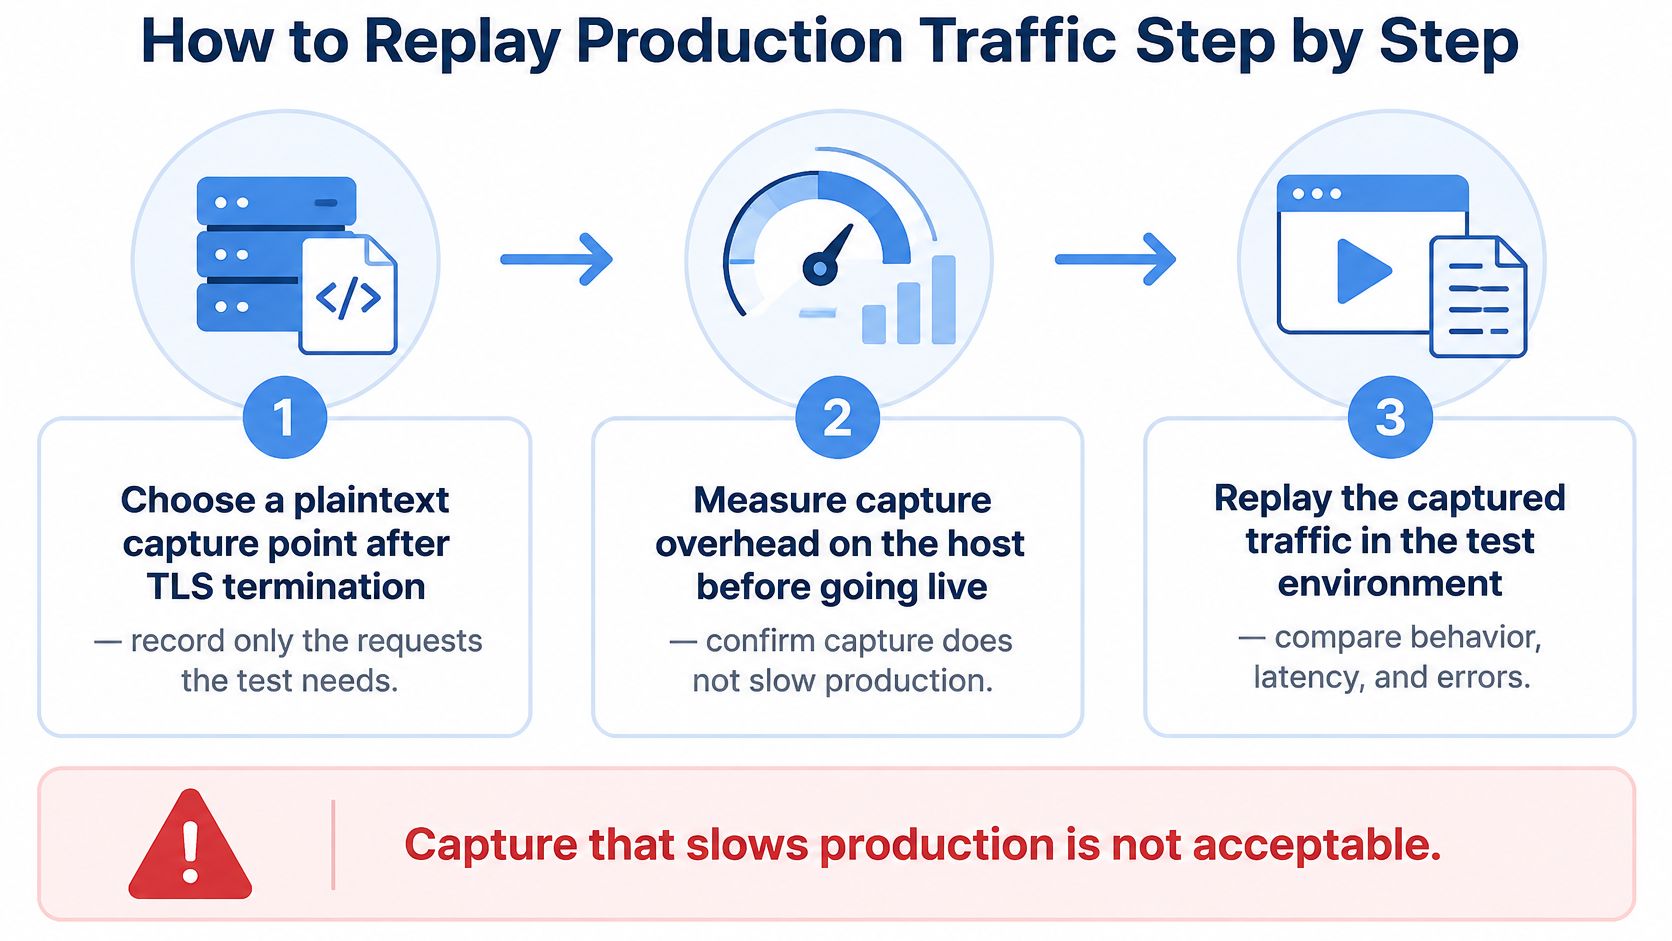
The diagram below summarizes the capture and replay flow before the detailed steps.
The six steps
-
Choose a plaintext capture point after TLS termination. Record only the requests the test needs, and measure capture overhead on the host before going live. Capture that slows production invalidates the test and harms users. Slip: Turning on full capture in production without an overhead check first.
-
Clean and rewrite the sample. Remove unsuitable requests, mask personal data and credentials, and rewrite the trace for an isolated target with external side effects switched off. An unmasked trace leaks secrets into a less protected environment. Slip: Replaying against a target that can still send real email or charge real cards.
-
Record a baseline on the current build. Use the same region, instance family and autoscaling policy you’ll use for the candidate. Otherwise you’re comparing infrastructure, not releases. Slip: Comparing a candidate in one region against a baseline from another and blaming the code.
-
Replay the candidate at a chosen speed. Start at 1x to mirror reality, then raise speed for capacity questions. Capture responses, latency, errors, session behavior and authorization results, because a fast answer to the wrong tenant is still a failure. Slip: Replaying requests without preserving session boundaries, so journeys break in ways production never would.
-
Compare distributions and outcomes. Compare median, p95 and p99 latency, error rate and confidence intervals between baseline and candidate. A clean replay alone doesn’t establish correctness, so also compare application state and business outcomes such as orders created and payments settled. Slip: Declaring success because status codes matched while order totals diverged.
-
Make it a CI/CD gate. Fail the pipeline when regression exceeds an agreed threshold, for example a 10% slowdown in p95 latency or any rise in error rate. For AI-enabled services, add token and inference-cost budgets per replay, so a spend regression fails the gate too. Slip: Running replay as an occasional manual check that nobody’s release depends on.
A passing run means the candidate matches the baseline within threshold on every compared metric, including cost. Our deeper walkthrough on replaying production traffic for realistic load testing covers capture options and speed controls in more detail.
The short video below shows the capture and replay workflow in action.
Fault Injection and Test Data Safeguards
Here’s the result that surprises teams used to fixed servers. In experiments on an OpenStack cloud-management platform, injected network faults reduced application throughput in line with fault intensity and duration, and under the highest congestion and exposure configuration throughput fell to approximately half of the no-fault level. Related fault-injection testing found that 4% to 34% of functional test cases could not handle injected faults, and failures in one virtual-network segment propagated to other segments despite redundancy.
Redundancy on a diagram doesn’t guarantee isolation in practice. You have to break things on purpose and measure what happens.
Build a fault matrix
Cross fault types with intensity settings instead of running one dramatic failure:
- Fault types: Added latency, packet loss, congestion, network partition and process crash.
- Variables: Duration, intensity, request rate and concurrency, each at more than one level.
- Measurements: Throughput, response time, tail latency, availability and recovery time for every combination.
Drive these experiments with representative HTTP sessions rather than uniform synthetic traffic. Sessions preserve endpoint proportions, request dependencies and burst patterns, so a fault hits your checkout flow and your search flow in realistic proportions. Uniform traffic spreads pain evenly and can hide the one endpoint that collapses.
Protect the data you replay
- Confirm idempotency: Check that replaying an order or payment request can’t create a duplicate, normally through idempotency keys or unique constraints.
- Use synthetic seed data for destructive paths: Deletes, refunds and account closures run against seeded records you can rebuild, never against copied live records.
- Refresh state before each run: Rebuild target data, rotate test tokens and reset rate-limit counters so each fault run starts from the same known condition.
- Mask before replay: Personal data and credentials come out during sample preparation, before the trace reaches any fault environment.
Our guide to running a chaos experiment shows how to structure hypotheses and blast-radius limits for this kind of work.
Completion rule: A fault test isn’t finished when the system survives. It’s finished when recovery time has been measured and checked against your availability budget.
Timed Exit Rehearsal and Portability Tests
A workload that performs well in two regions of the same provider hasn’t proven it can leave that provider. Infrastructure-as-code doesn’t prove it either. Your templates may rebuild servers quickly while your data export takes days, your identity provider has no equivalent elsewhere, or a proprietary queue API is woven through every service. Portability is only real when you’ve rehearsed the exit against the clock.
Treat the timed exit rehearsal as a required release test, with thresholds written before it runs.
Five steps of the rehearsal
-
Extract a representative dataset. Pull production-like data through the provider’s real export path and record its size, format and extraction time. Don’t use a hand-copied sample, because the export path itself is under test.
-
Restore on replacement infrastructure. Build the workload on a different provider or a provider-neutral target and time the full restore against your recovery target.
-
Measure data loss. Compare record counts and checksums between source and restored copy. Any gap gets counted and explained, not waved away.
-
Verify deletion by the original provider. Use the provider’s deletion records, then run an access check after the wipe to confirm the data is gone.
-
Map hidden dependencies. List identity, queues, DNS, observability and proprietary APIs, and mark each one as replaced, rebuilt or unresolved. An unresolved item is a failed test result, not a footnote.
Run the rehearsal in the last quarter before a contract renewal or migration decision, when the findings can still change your negotiating position. Repeat it whenever the architecture changes materially, because each new managed service can add a fresh dependency.
Sovereignty and regulatory access rules differ by jurisdiction, so record where data sits during the rehearsal and who can reach it at each stage. A restore that works technically but moves regulated data into the wrong jurisdiction hasn’t passed in any useful sense.
Report the outcome as pass or fail against three thresholds set in advance, restore time, data loss and unresolved dependencies. If the rehearsal fails, you haven’t got a portability problem to fix someday. You’ve got a release blocker with a measured size.
Pitfalls and Pre-Release Checklist
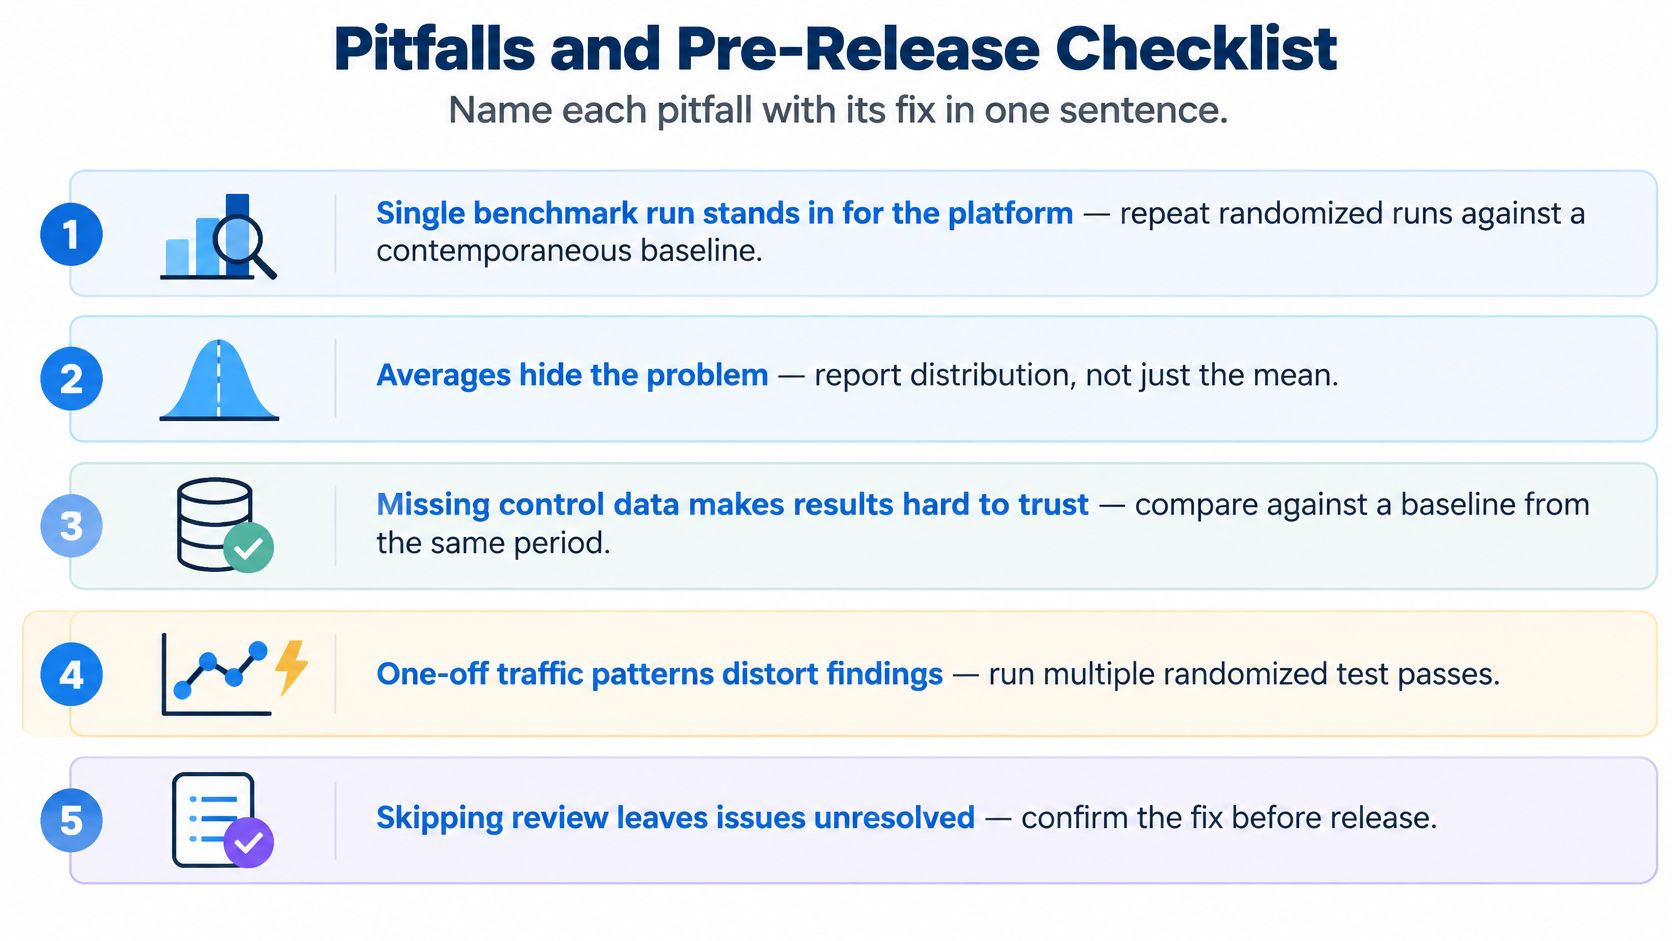
Most cloud testing failures come from a short list of habits. A single benchmark run stands in for the platform, so repeat randomized runs against a contemporaneous baseline. Averages hide the problem, so report medians, tail latency and error rates. Failover is mistaken for portability, so run the timed exit rehearsal instead. Synthetic load overstates reliability, so replay masked production sessions. Naïve replay exposes secrets and spend, so mask traces and set token and inference-cost budgets.
Portability deserves extra skepticism because the tooling is immature. Computer Weekly coverage of cloud sovereignty notes organizations still rely heavily on audits and manual assessments to determine where data moves, who can access it and which suppliers create dependency. If you’re planning that work as part of a wider program, a modernization guide for technical leaders from Software Modernization Intelligence is useful context for sequencing providers, dependencies and migration decisions.
Run this before release
- Availability budget recorded: Each test plan states the monthly downtime budget in minutes.
- Matching environments: Baseline and candidate ran in the same region, instance family and scaling policy.
- Fault coverage: The fault matrix covers at least three fault types at more than one intensity.
- Data safeguards checked: Test data is masked and endpoints are verified for idempotency.
- Exit rehearsal timed: A rehearsal ran in the last quarter with restore time and data loss recorded.
- Gate enforced: CI/CD fails the build when agreed latency, error or cost thresholds are exceeded.
A build ships only when every gate passes, and the team records each threshold, result and owner in the release ticket. To start capturing and replaying traffic, the GoReplay Open Source edition includes HTTP traffic capture and replay, request filtering, rewriting and middleware, a command-line interface and community support.
Start your next release cycle by capturing one real production session, masking it, and replaying it against your candidate build with latency, error and cost gates in place. GoReplay captures live HTTP traffic and replays it into isolated test environments, so you can run load, soak and migration checks with the requests your users send. Visit GoReplay to download the open-source edition and run your first replay before your next deployment.