
Big Data Analytics with Hadoop: Real-World Implementation

The popular advice is simple: benchmark the Hadoop job, confirm that throughput looks acceptable, and deploy. That advice is incomplete. A pipeline can process a clean test dataset quickly and still corrupt session relationships, mishandle late events, or fail when production traffic arrives in bursts.
Big data analytics with Hadoop succeeds when teams validate the behavior of the entire data path, not just the speed of a batch calculation. That means testing ingestion, schemas, partitioning, aggregation, failure handling, privacy controls, and downstream results with traffic that resembles what real users and applications generate.
Hadoop’s history explains why this matters. Google’s MapReduce paper established a model for processing very large datasets across commodity servers, while Hadoop evolved from distributed-processing work in the Nutch crawler project into a general analytics platform. The first Apache Hadoop release followed in September 2007, and the project’s architecture still reflects its original strengths, parallel processing, distributed storage, and tolerance for node failure. InformationWeek’s Hadoop history provides the key milestones.
Why Benchmarking Is Not Enough
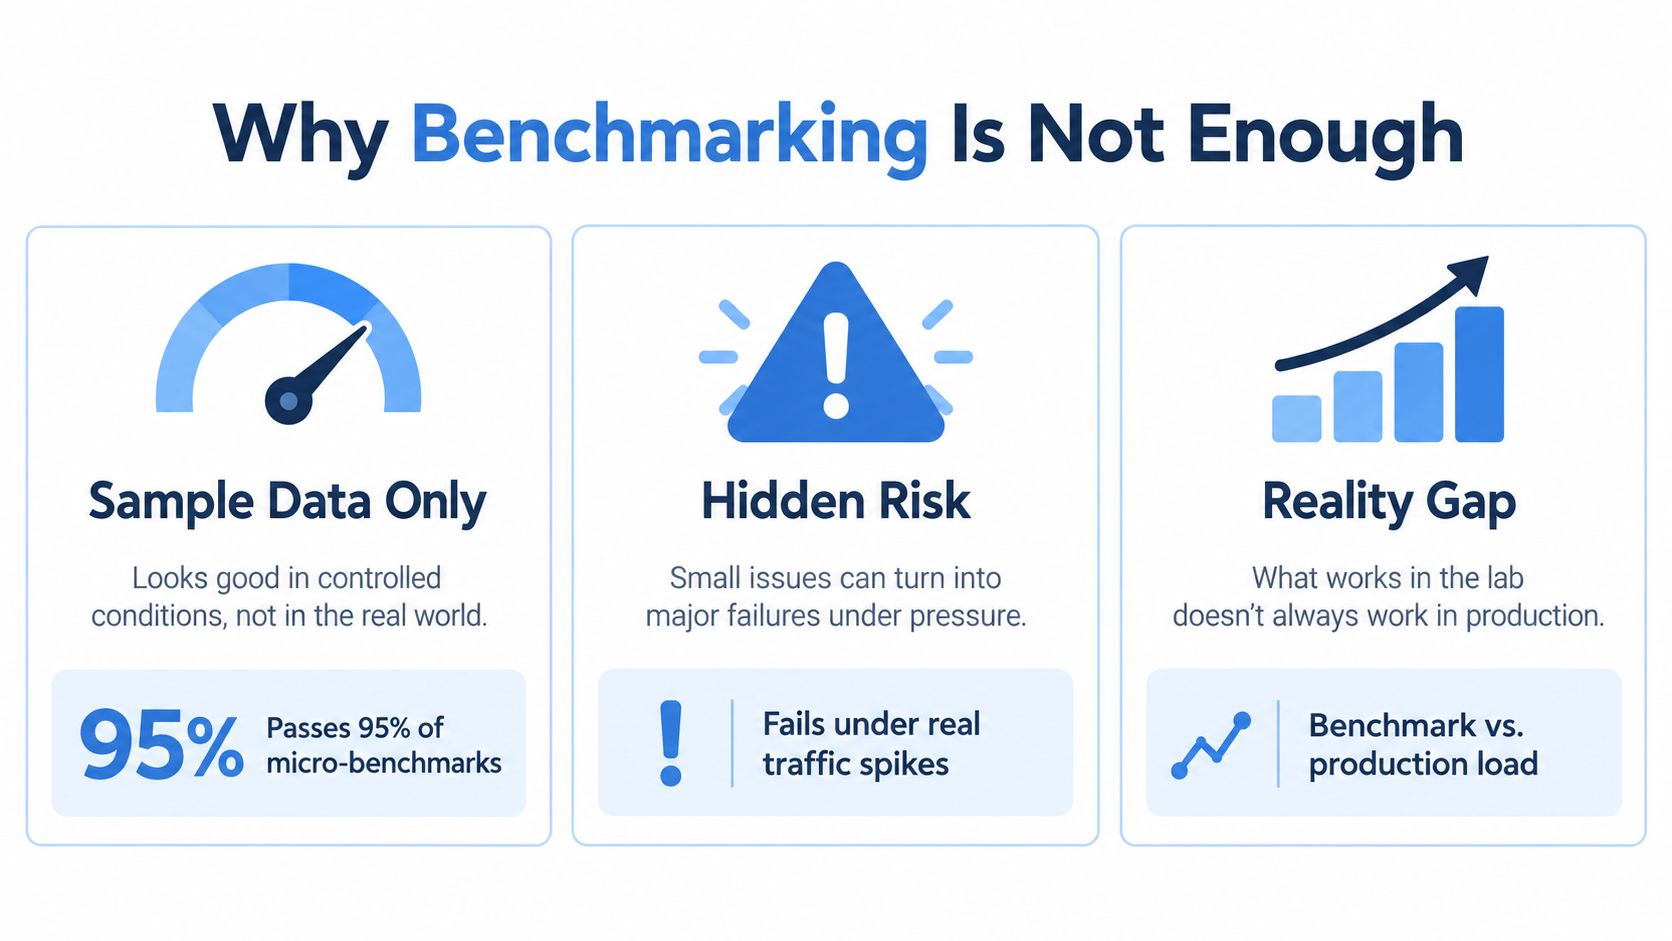
A cluster benchmark answers a narrow question: how quickly can this environment process this dataset under these controlled conditions? It doesn’t answer whether the pipeline behaves correctly when users retry requests, sessions overlap, schemas evolve, records arrive out of order, or traffic suddenly concentrates on a small set of partitions.
That distinction is easy to miss because benchmark output looks authoritative. A job completes, resource consumption stays within limits, and the result matches an expected aggregate. Yet the test may contain uniform records, predictable timing, no malformed payloads, and no dependency between requests. Production contains all of those complications at once.
The risks hidden by clean data
Enterprise Hadoop adoption has never been only a compute problem. Respondents cited staffing concerns at 25%, implementation concerns at 22%, and operations concerns at 9% in the referenced enterprise analysis, while data quality, governance, stewardship, and metadata management were often neglected. The TDWI Hadoop enterprise report places those concerns in the wider operational context.
A synthetic test usually removes the very conditions that expose those weaknesses:
- Event ordering: A login, purchase, and cancellation may arrive in an order different from the order in which the user performed them.
- Session continuity: A later request may rely on a token, cookie, tenant context, or identifier established earlier.
- Bursty load: A steady request rate doesn’t reproduce sudden campaigns, retries, or uneven customer activity.
- Edge-case records: Empty fields, unexpected encodings, duplicate events, and partially migrated schemas can change aggregates without causing a job failure.
- Data governance: A technically valid replay may still expose sensitive payloads to a test environment.
Practical rule: A faster job isn’t a successful release if it produces different business results for the same customer behavior.
Test behavior, not just capacity
I separate validation into two questions. Capacity testing asks whether the cluster can sustain a workload. Behavioral validation asks whether the application and pipeline produce the right records, relationships, and outcomes while sustaining it.
The second question requires representative traffic. Hadoop-based systems commonly process clickstream events, fraud signals, customer interactions, and machine-generated logs. Those records come from real application paths, so the test should preserve the relationships between requests rather than flattening them into unrelated rows.
A production-like validation cycle therefore captures representative requests, masks sensitive content, replays controlled sessions, and compares the candidate pipeline with a trusted baseline. Throughput still matters, but it becomes one signal among several, alongside event completeness, ordering, partition distribution, output accuracy, and recovery behavior.
Choosing Your Hadoop Stack
Hadoop is a platform, not a single processing engine. Its storage, resource management, execution engines, query layers, and specialized services each introduce different operating costs. Choose the stack from the workload’s shape, data-access pattern, latency requirement, and failure behavior, rather than from a framework preference.
HDFS provides distributed storage, while YARN allocates cluster resources among applications. MapReduce remains a sensible option for durable, predictable batch transformations, especially when work divides cleanly into independent map and reduce stages. Its costs are higher latency and more development friction. Intermediate results are written between stages, which can make iterative or interactive workloads pay for work they do not need.
Spark fits iterative transformations, sessionized analysis, and pipelines that combine SQL with application code. It can keep working data in memory when the workload permits, but memory alone does not guarantee better performance. Poor partitioning, oversized shuffles, skewed keys, and insufficient executor memory can still control runtime. Spark also adds its own deployment and monitoring surface. Replacing MapReduce without comparing equivalent outputs only transfers the risk to a different engine.
Match the engine to the job
| Workload | Practical fit | Main trade-off |
|---|---|---|
| Historical batch transformation | MapReduce or Spark | Predictable execution versus development and tuning complexity |
| Clickstream aggregation | Spark with Hive-compatible tables | Fast iteration, but shuffle and skew need close monitoring |
| Fraud detection features | Spark for feature preparation, with a separate serving layer when needed | Batch analytics may not satisfy low-latency decisions |
| Customer segmentation | Spark or Hive for repeatable analytical queries | Interactive convenience can hide expensive scans |
| Key-based operational lookups | HBase | Low-latency access, but more schema and cluster-operational complexity |
Hive gives analysts and engineers SQL access to distributed data. It improves accessibility without removing physical design decisions. Partition pruning, file format, table statistics, and join strategy still determine whether a query reads a useful subset or scans far more data than expected.
YARN requires explicit capacity rules. Its ResourceManager and NodeManagers let several application types share a cluster, but that sharing creates contention. A long-running Spark application can disrupt scheduled batch work unless queues, priorities, memory limits, and preemption policies match business requirements.
Treat architecture as a validation decision
A design can look efficient on a diagram and fail under real traffic. Clickstream events may concentrate on one tenant, fraud signals may arrive in bursts, and segmentation queries may compete with ingestion. Validate these interactions together, not only in isolated engine benchmarks.
Use session-aware replay before deployment. Capture representative request flows, mask sensitive payloads, replay controlled sessions with GoReplay or an equivalent tool, and diff candidate outputs against a trusted baseline. Compare event completeness, ordering, partition distribution, aggregate results, and recovery behavior alongside throughput. This exposes failures that a clean batch fixture can hide, including retries, uneven traffic, and correlated requests.
Market estimates put enterprise Hadoop processing above 50 petabytes by 2024, with framework use reported at over 72% of Fortune 500 companies (the referenced Hadoop market analysis). These figures indicate broad adoption and scale. They do not establish that a particular combination of HDFS, YARN, Spark, Hive, or HBase will suit your workload. That decision belongs to production-shaped validation.
Building the Ingestion and Storage Layer
Most Hadoop failures blamed on “slow analytics” begin earlier, in ingestion and storage. The job is forced to scan badly shaped files, interpret unstable fields, compensate for duplicates, or process millions of tiny objects. No execution engine can fully repair a weak storage layout.
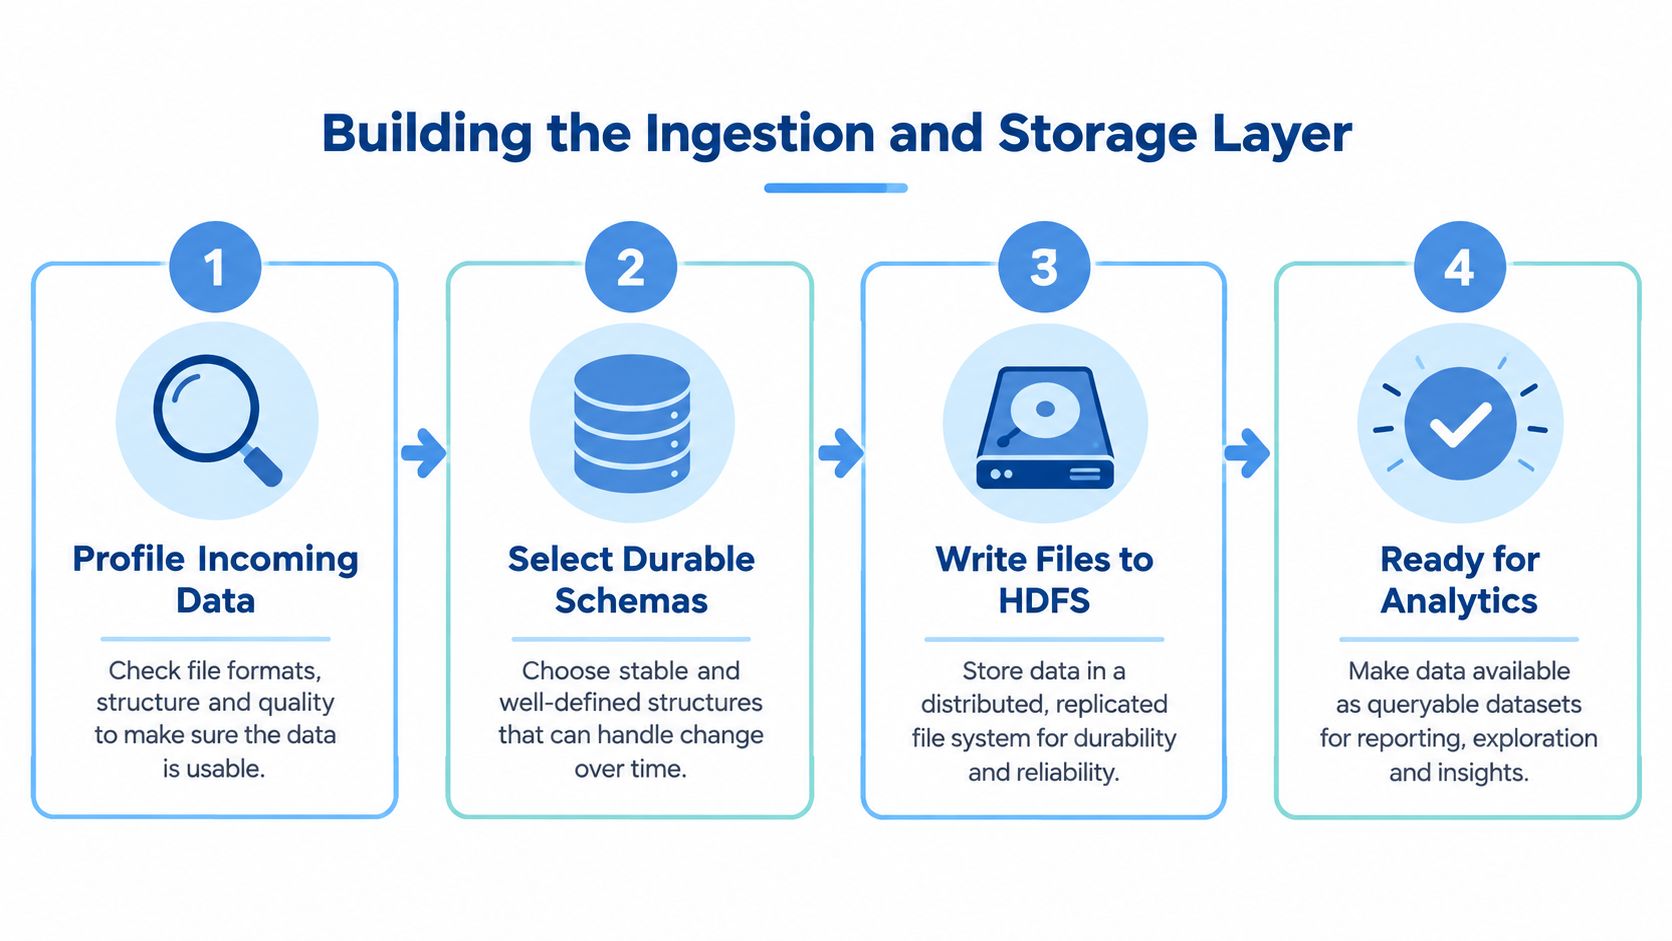
Start by profiling incoming data. Record field types, null behavior, timestamp formats, event identifiers, tenant distribution, duplicate patterns, and schema variations. The profile should describe actual payloads, not only the documented contract. A producer may claim to send an integer while a legacy client sends an empty string, and that difference will surface later as a parsing or aggregation defect.
Establish a durable layout
Choose a schema that can evolve without making historical data unreadable. Keep raw input available when governance permits, but create a curated representation with explicit types, normalized timestamps, stable identifiers, and clear handling for unknown fields.
Partition by dimensions that queries commonly filter, such as event date, tenant, or geography. Don’t partition by every field that looks useful. Excessive partitioning creates many directories and small outputs, while a poor partition key produces large scans or hot partitions.
Use Parquet or ORC when the query engine supports them. Columnar storage lets analytical queries read selected columns instead of loading every field, and it works especially well when combined with sensible partitioning. The practical differences between row-oriented and column-oriented formats are discussed in this guide to Parquet versus Avro for data pipelines.
Write files with HDFS in mind
HDFS distributes files as blocks across DataNodes. Current Hadoop documentation identifies 128 MB as the typical block size, while block size and replication factor remain configurable per file. The HDFS design documentation explains the relationship between blocks, DataNodes, and replication.
A practical sequence looks like this:
- Profile before transformation. Keep a representative sample of malformed, delayed, duplicate, and partial records.
- Normalize into durable files. Write typed, compressed Parquet or ORC files rather than relying on a large number of tiny raw objects.
- Partition deliberately. Start with event date or tenant when those dimensions match access patterns.
- Inspect the filesystem. Use filesystem reports to verify block distribution, file sizes, and storage consumption before launching heavy jobs.
- Baseline the pipeline. Measure ingestion time, map time, reduce time, shuffle volume, output size, and query behavior.
The small-file problem deserves special attention. Millions of files can burden NameNode metadata and create task-launch overhead even when their combined byte volume is modest. Compaction should be a planned pipeline stage, not an emergency response after query performance deteriorates.
Replication also requires judgment. Higher replication improves availability but increases storage and write traffic. Apply stronger durability to hot or business-critical datasets, and use a lower setting for reproducible intermediate outputs when the recovery objective allows it.
Traditional Testing vs Production Simulation
Traditional QA usually tests endpoints independently. A script sends a request, checks a response, and moves to the next case. That approach works for contract validation, but it doesn’t reproduce the way an application generates a connected stream of records.
A Hadoop pipeline may receive a user journey as several dependent events. A session starts, a token changes, a request retries, a user updates a cart, and a later operation depends on the earlier state. If a test sends those operations out of order or removes their identifiers, the pipeline can pass while its real session logic remains untested.

What conventional tests miss
Synthetic records are useful for boundary conditions and repeatable unit tests. They’re less useful when the defect depends on how records relate to one another or how traffic changes over time.
| Test approach | What it proves | What it leaves uncertain |
|---|---|---|
| Unit tests | A transformation handles defined inputs | Whether real payload combinations reach that transformation |
| Contract tests | Services follow an interface | Whether sessions and retries preserve expected relationships |
| Fixed load tests | The system handles a planned request pattern | Whether bursty, uneven traffic changes partition or queue behavior |
| Batch benchmark | A job completes within a measured runtime | Whether output remains equivalent under realistic event ordering |
| Production-like replay | The candidate handles representative interactions | Whether the captured sample covers every rare business path |
Traffic replay isn’t a replacement for unit or integration testing. It adds a missing layer. Real application traffic carries the heterogeneity that downstream analytics must handle, including optional fields, client differences, repeated requests, and timing relationships.
Preserve the shape of behavior
The most valuable replay fixture isn’t necessarily the largest capture. It’s a representative collection of sessions that includes ordinary journeys, retries, delayed operations, malformed-but-accepted payloads, and high-value edge cases. Preserve the sequence and relevant identifiers while removing sensitive content.
A useful comparison should examine more than HTTP success. Compare the records entering the pipeline, the partition assignments, aggregate outputs, rejected events, processing latency, and resource behavior. If the new pipeline returns the same status code but drops a late event, endpoint testing will miss the defect while result diffing will expose it.
The purpose of realistic replay is not to imitate production perfectly. It is to make the important failure modes observable before production has to find them.
Validating Pipelines with Traffic Replay
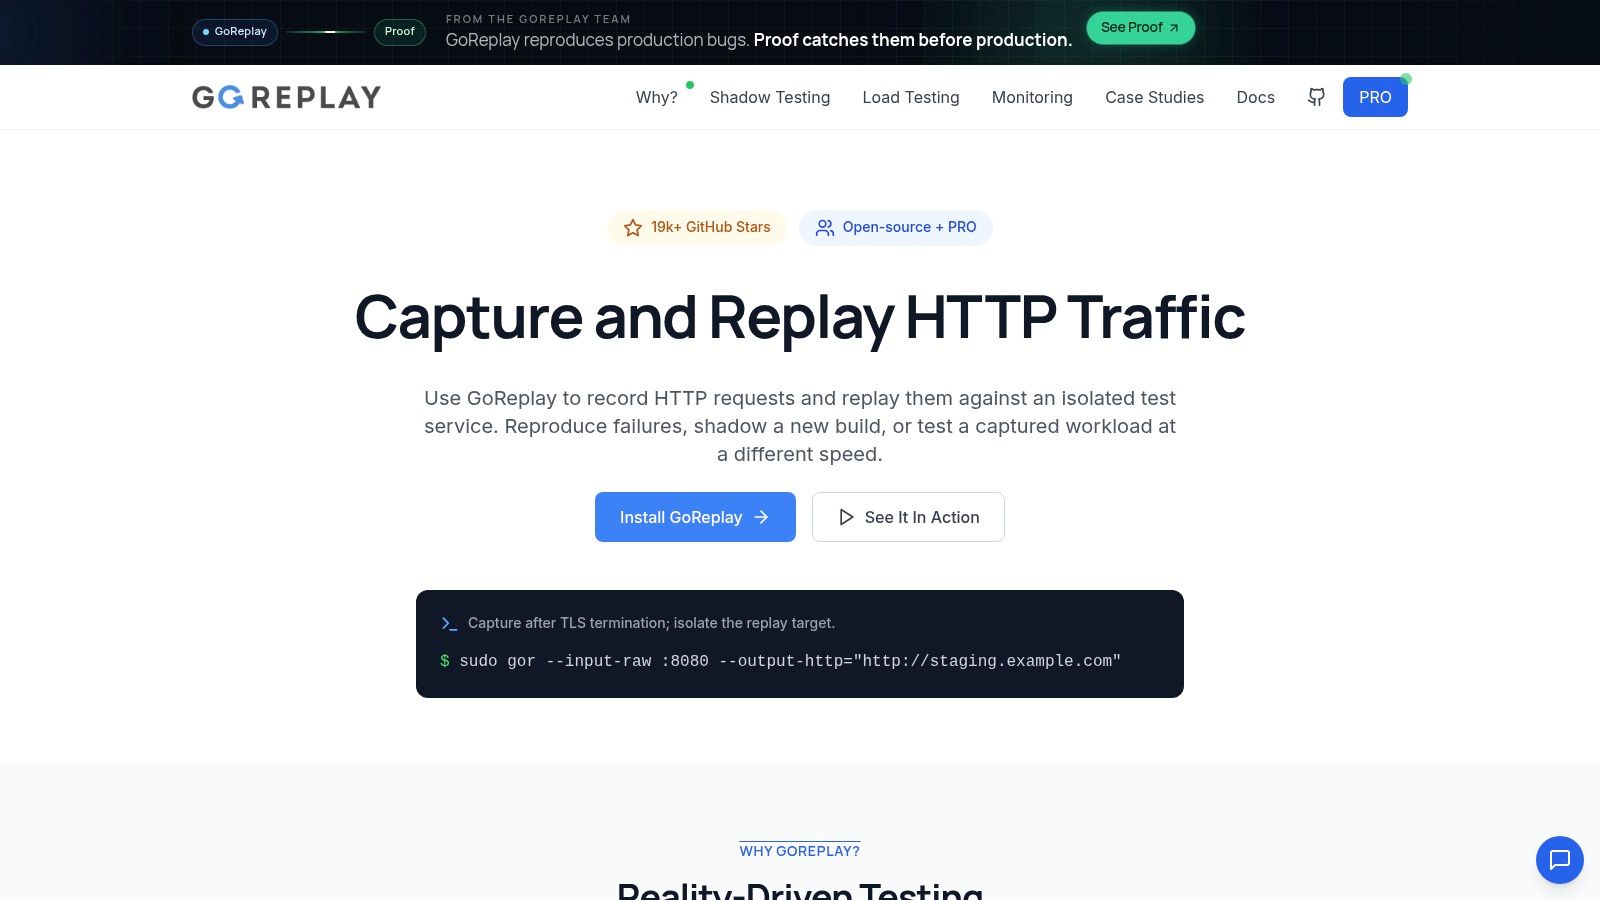
A practical workflow begins at the application boundary, where user-driven requests generate the data that Hadoop later stores and analyzes. Capture representative HTTP traffic in a controlled manner, remove or mask sensitive values, and route the replay toward an isolated candidate environment.
Session awareness matters because independent request replay destroys context. A session-aware tool can preserve relationships between requests so that authentication, identifiers, retries, and dependent operations reach the candidate in a meaningful order. That gives the ingestion layer records that resemble the ones created by real application behavior.
A controlled replay workflow
Use a staged process rather than sending an unrestricted capture into a test cluster:
- Define the boundary. Identify which service receives the requests and which downstream jobs consume the resulting records.
- Capture representative sessions. Include ordinary traffic, retries, delayed events, and known edge cases.
- Mask sensitive payloads. Replace personal, financial, authentication, and tenant-specific values while retaining field types, lengths, relationships, and timing where possible.
- Replay at controlled intensity. Start with a small fixture, then increase concurrency and burstiness while watching queues, ingestion lag, and partition distribution.
- Persist candidate outputs. Store raw records, curated records, aggregates, rejected events, and operational metrics for comparison.
- Diff against a baseline. Compare counts, keys, timestamps, aggregates, status codes, payloads, errors, and latency distributions.
- Investigate differences by session. A row-level mismatch is easier to explain when engineers can trace it back to the request sequence that created it.
The masking step shouldn’t turn every value into an unrelated placeholder. If every tenant becomes the same token, partition skew disappears. If timestamps are all normalized to one instant, ordering defects disappear. Preserve the characteristics that affect behavior while protecting the underlying identity.
After the first replay, inspect the Hadoop side. Did the candidate create unexpected small files? Did one tenant dominate a partition? Did late events land in a different output path? Did a schema change convert valid values into nulls? These questions connect application behavior to storage and computation.
A short visual demonstration can help teams understand how capture and replay fit into an existing test process.
Make result diffing release evidence
The strongest release report combines three dimensions:
- Behavioral equivalence: The same session produces equivalent accepted, rejected, and transformed events.
- Analytical equivalence: Aggregates, joins, feature values, and partition-level counts match the approved baseline within explicitly defined rules.
- Operational acceptability: Runtime, shuffle, storage growth, queue wait, ingestion lag, and failure recovery remain within the team’s limits.
Not every difference is a defect. A new engine may reorder physically stored rows while preserving the aggregate. A corrected parser may intentionally reject records that the old pipeline accepted. The review process should classify differences as expected, explainable, or release-blocking.
This approach also catches defects that cluster benchmarks cannot. A pipeline may be faster because it disregards malformed records. It may use less storage because a nullable field is being dropped. It may reduce latency by processing a subset of sessions. Result diffing forces performance improvements to remain accountable to correctness.
Tuning for Performance and Reliability
Tune Hadoop from measurements, not folklore. Start with a baseline that records separate map and reduce task time, queue wait, shuffle volume, network consumption, output size, failed attempts, and end-to-end latency. Without that breakdown, engineers often increase memory when the underlying problem is skew, poor partitioning, or excessive serialization.
Find the dominant cost
If map tasks are slow, inspect input format, decompression, parsing, object creation, and input locality. If reduce tasks dominate, inspect key distribution, join strategy, reducer count, and shuffle volume. A few oversized keys can create stragglers even when the average partition looks healthy.
For Spark workloads, inspect executor memory pressure, spill behavior, partition sizes, and shuffle reads. SQL functions can make transformations readable, but readability doesn’t guarantee efficient execution. The practical behavior of common operations is covered in this guide to Spark SQL functions.
YARN queues should reflect workload classes. Keep interactive or time-sensitive applications from competing indiscriminately with large historical jobs, and set resource limits that prevent one application from consuming the cluster. Queue policy is part of performance engineering because an efficient job can still have unacceptable latency if it waits behind an uncontrolled workload.
Validate every tuning change
Change one meaningful variable at a time and replay the same representative fixture. Compare output correctness alongside runtime and resource consumption. A shorter job that produces a different aggregate isn’t an optimization.
Check locality and file sizing before changing execution parameters. Oversized or badly distributed inputs can create network traffic that no reducer setting will fix. Likewise, indiscriminate replication can increase storage and write traffic without improving the availability of data that can be regenerated.
Use replication according to recovery objectives. Business-critical, frequently accessed datasets may justify stronger durability, while temporary outputs may not. Monitor DataNode health, NameNode pressure, queue saturation, failed tasks, and ingestion lag continuously, then retain the measurements that explain why a release was accepted.
Deciding What Stays and What Moves
Keep sovereignty-bound tables on HDFS when residency rules, existing operations, or predictable batch costs outweigh cloud flexibility. Move elastic feature computation to managed services when demand changes sharply or cloud-native data products reduce administration. A hybrid design is often cleaner than forcing one platform across every dataset.
Make the boundary explicit. A table stays when it contains regulated records, feeds tightly coupled HDFS jobs, or would incur costly transfers at its source. A workload moves when its inputs can be masked, recomputed, and transferred without breaking lineage or latency targets. Retain raw, authoritative data where governance requires it; move derived features and repeatable aggregates when elasticity matters.
For example, keep customer identity and transaction tables on HDFS, while moving a bursty recommendation-feature job to a managed service. Use GoReplay to replay masked, session-aware traffic and diff results before switching consumers, rather than trusting batch benchmarks alone.
Apache’s Apache Hadoop release history documents ongoing releases, while Hadoop market analysis provides deployment context. GoReplay supplies controlled traffic evidence for the cutover.