Why Application Performance Testing Actually Matters

Today’s users expect websites and applications to be fast and responsive. A slow or unreliable application can frustrate users and lead them to abandon your platform. This directly impacts a company’s bottom line. Think about your own online experiences. How long do you wait for a page to load before giving up?
This is where application performance testing becomes essential. It’s a critical business strategy, not just a technical box to check.
The Real Cost of Poor Performance
Poor application performance can manifest in several ways, each with negative consequences. A slow-loading e-commerce site, for example, can result in abandoned shopping carts, directly affecting sales.
An application that crashes during peak traffic can damage brand reputation and customer loyalty. Internal applications with performance issues can also hinder employee productivity, reducing overall efficiency. These scenarios illustrate how performance problems lead to lost revenue and missed opportunities.
The increasing importance of software quality is evident in the growth of the application testing services market. The market is expected to reach $48.16 billion in 2025 and grow to $85.24 billion by 2029. This substantial growth highlights the significant investments companies are making in ensuring their applications perform flawlessly. For a deeper dive into these statistics, check out this analysis: Application Testing Services Market Analysis
Turning Performance Testing into a Competitive Advantage
Smart organizations understand that application performance testing is more than just preventing disasters. It’s about creating a competitive advantage.
By proactively identifying and fixing performance bottlenecks, companies can offer a superior user experience. This improved experience leads to increased customer satisfaction, stronger brand loyalty, and higher revenue. Robust performance testing can also streamline operations, boost employee productivity, and reduce operational costs.
Beyond the Basics: Moving from Reactive to Proactive
Many organizations still take a reactive approach to application performance testing, addressing issues only after they’ve impacted users. A proactive approach, however, integrating performance testing throughout the development lifecycle, offers much better results.
This shift-left approach, incorporating performance testing early and often, enables developers to identify and resolve bottlenecks before they reach production. This saves time and resources, preventing costly performance issues in the long run. By shifting from reactive to proactive, organizations can harness the power of application performance testing to create robust, high-performing applications that meet and exceed user expectations.
Finding Your Perfect Application Performance Test Mix
Not all performance tests are created equal. Choosing the wrong one can waste resources and miss critical issues. Understanding which test type best suits your needs is key to successful application performance testing. Let’s explore how effective teams select the right tests to optimize their applications.
Understanding the Different Types of Application Performance Testing
Selecting the right application performance test often hinges on your application’s specific goals and anticipated challenges. For instance, load testing reveals how your application handles expected user traffic. Stress testing, on the other hand, pushes your system past its limits to pinpoint breaking points and bottlenecks.
Other essential performance tests include endurance testing, which assesses long-term stability, and scalability testing, which determines how well your application manages growing user loads. Choosing the right test lets you proactively address potential performance issues before they impact users.
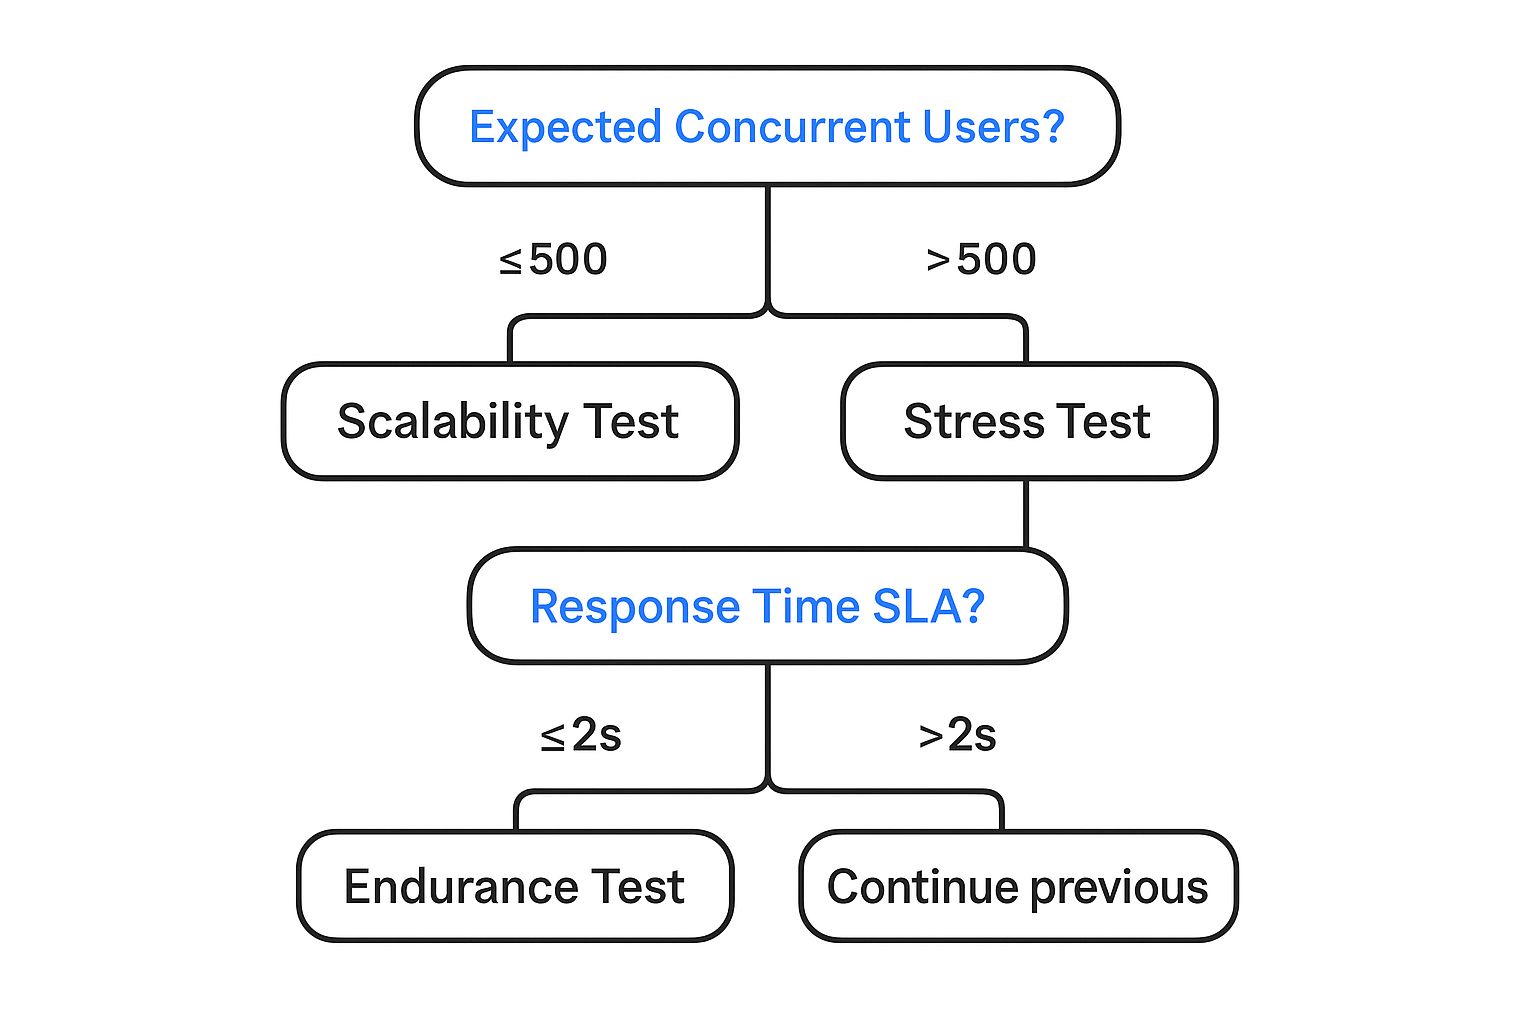
This infographic provides a simplified decision tree for selecting between scalability and stress testing based on expected concurrent users and response time SLAs (service level agreements). As shown, applications anticipating fewer than 500 concurrent users often benefit most from scalability testing. Applications expecting more users should prioritize stress testing. If your response time SLA is under 2 seconds, consider an endurance test, regardless of concurrent user expectations.
To further clarify the various test types, let’s examine this comparison table:
This table compares different types of performance tests, highlighting their key characteristics, use cases, and benefits.
| Test Type | Primary Purpose | When to Use | Key Metrics Measured | Typical Duration |
|---|---|---|---|---|
| Load Testing | Determine system behavior under normal load | Before major releases, during peak seasons | Response time, throughput, resource utilization | Hours to days |
| Stress Testing | Identify system breaking points and bottlenecks | Before major releases, after significant code changes | Maximum concurrent users, error rates, response time degradation | Hours to days |
| Endurance Testing | Evaluate long-term system stability | After major releases, before prolonged usage periods | Resource leaks, performance degradation over time | Days to weeks |
| Scalability Testing | Assess how system handles increasing load | During capacity planning, when anticipating growth | Response time under increasing load, resource utilization trends | Hours to days |
This table provides a quick reference for understanding the nuances of each performance test type. Choosing the right test is crucial for effective performance optimization.
Building a Balanced Testing Strategy
A balanced application performance testing strategy requires understanding your business risks. This includes identifying potential bottlenecks and performance problems specific to your application and industry. For example, an e-commerce site might prioritize load testing during peak shopping seasons for smooth checkouts. A gaming platform might focus on stress testing to prevent server crashes during high-traffic launches.
This targeted approach ensures efficient resource allocation and valuable insights. A balanced strategy avoids unnecessary complexity by focusing on tests relevant to your specific needs and risks, maximizing value with minimal overhead.
Realistic Implementation and Expected Outcomes
Understanding the practical implications of each test is crucial. Each test type has different implementation timelines and resource needs. Load testing, for example, might require less setup and specialized resources than stress testing, which often involves simulating extreme conditions.
Each test also yields different insights. Load testing provides data on response times and resource utilization under normal conditions. Stress testing reveals breaking points and system behavior under extreme pressure. Understanding this helps prioritize and schedule tests effectively, ensuring you gather the right information. GoReplay can be helpful in facilitating these different tests, leveraging real production traffic for realistic simulations.
Optimizing Your Approach with GoReplay
GoReplay can greatly enhance your application performance testing strategy. By capturing and replaying live HTTP traffic, it enables realistic load and stress testing scenarios. This lets you test against actual user behavior, identifying potential issues before they impact real users.
GoReplay’s features, like session-aware replay and TLS optimization, further contribute to accurate and efficient performance testing. By simulating real-world conditions, GoReplay helps proactively optimize your application, ensuring a smooth user experience even under heavy load. Consider using GoReplay to gain insights and ensure flawless performance in production.
Performance Metrics That Actually Drive Decisions
Effective application performance testing hinges on choosing the right metrics. Instead of drowning in data, focus on the metrics directly linked to your business goals. This means understanding the vital numbers for your application and establishing realistic thresholds that reflect actual user expectations. You might find this helpful: Essential Performance Testing Metrics Guide.
Key Metrics for Application Performance Testing
Several key metrics offer valuable insights into how your application performs. Average response time, for instance, measures how long users wait for a request to complete. This directly affects user satisfaction. Error rate tracks how often errors occur, pointing to potential bugs or system instability. Throughput measures the number of transactions processed per unit of time, reflecting application capacity and efficiency.
Peak response time shows the longest response time during a test, helpful for identifying worst-case scenarios. The Apdex score (Application Performance Index) gives a standardized measure of user satisfaction based on response time thresholds. Understanding these metrics is vital for effective application performance testing.
Setting Meaningful Thresholds and Communicating with Stakeholders
Setting meaningful thresholds that reflect real user expectations is crucial for interpreting performance data. A two-second average response time might be acceptable for loading a web page, but a 0.5-second response time might be the expectation for an in-app action.
The demand for seamless user experiences is driving growth in the web performance testing market. The market is projected to reach $910.6 million by 2025, growing at a 16.6% CAGR until 2033. More detailed statistics can be found here: Web Performance Testing Market Research.
Communicating these technical findings to non-technical stakeholders requires clear visualizations. Dashboards, charts, and graphs can translate complex data into understandable narratives about application health. This ensures everyone, from developers to business leaders, understands the impact of performance problems and can work together on solutions.
Prioritizing Metrics and Building Effective Dashboards
Prioritization is essential when dealing with numerous metrics. If an application faces scalability challenges, throughput might take priority over peak response time initially. This focused approach enables efficient problem-solving.
Effective dashboards provide a clear picture of application performance. They highlight key metrics, trends, and potential issues. By presenting data visually, these dashboards empower teams to make informed decisions and proactively address performance bottlenecks. This proactive approach prevents performance issues from affecting users, ensuring a smooth and dependable experience.
Selecting Tools That Enhance Your Testing (Not Complicate It)
The right application performance testing tool can significantly improve your testing strategy. With so many options, choosing the best one for your needs can be daunting. This section helps you navigate the world of performance testing tools, focusing on practical aspects instead of marketing hype.
Key Considerations for Tool Selection
Don’t just choose a tool based on its features. Focusing solely on a long list of capabilities can lead to a complicated and inefficient testing process. Instead, consider your team’s skills, your existing infrastructure, and your testing goals. A tool with a steep learning curve might not be suitable for less experienced teams. Similarly, tools requiring extensive setup may be impractical for smaller organizations.
For example, if your team is proficient in scripting languages, a tool offering customization might be beneficial. Think about your current workflows and how well the tool integrates with your current systems. Smooth integration minimizes disruptions and boosts team efficiency. Don’t forget hidden costs like training, maintenance, and licensing fees. These costs can add up quickly.
Evaluating Tools Based on Real-World Performance
How a tool performs in real-world scenarios is essential. Reviews and testimonials from users who’ve used the tool in production environments provide valuable insights. These offer a more balanced perspective than information from vendors. They often highlight both strengths and weaknesses.
One tool might excel at generating high loads but lack detailed performance analysis. A user-friendly interface could hide limitations in the tool’s capabilities. Look for tools that deliver on their promises and simplify your testing. The best tools help your team identify and resolve performance bottlenecks efficiently.
A Comparison of Leading Performance Testing Tools
To help you make an informed decision, the following table compares popular application performance testing tools. It focuses on key features, pricing, and ideal use cases.
To help you choose the right performance testing tool, the following table, “Performance Testing Tools: The Real-World Comparison,” offers a detailed comparison highlighting key features, pricing models, and ideal use cases.
| Tool Name | Type | Key Features | Pricing Model | Best For | Limitations |
|---|---|---|---|---|---|
| Apache JMeter | Open-source | Highly extensible, supports various protocols | Free | Teams comfortable with scripting and customization | Steeper learning curve |
| k6 | Open-source/Commercial | Developer-centric, scripting in JavaScript | Free (core)/Commercial (cloud features) | DevOps and CI/CD integration | Limited protocol support compared to JMeter |
| LoadRunner | Commercial | Comprehensive enterprise-grade features, extensive protocol support | Commercial | Large-scale performance testing and complex scenarios | Can be expensive, higher learning curve |
| Gatling | Open-source/Commercial | Scala-based DSL, detailed reports | Free (open-source)/Commercial (enterprise features) | Teams familiar with Scala, detailed performance analysis | Scala expertise required for advanced usage |
| GoReplay | Open-source/Commercial | Real-world traffic replay, session-aware testing | Free (standard)/Commercial (pro) | Realistic load and stress testing | Best suited for HTTP traffic replay |
This table offers a starting point. Deeper research into each tool is crucial based on your specific requirements before making a final decision.
GoReplay: Leveraging Real User Traffic for Accurate Testing
GoReplay enables realistic application performance testing using actual production traffic. This replicates real user behavior, making it easier to identify potential bottlenecks before they impact your users. This proactive approach allows you to optimize your application for real-world scenarios, not just theoretical ones.
GoReplay offers features like session-aware replay, TLS optimization, and advanced analytics. These features make it a valuable tool for accurate and efficient performance testing. By simulating real traffic, GoReplay helps you focus on the most impactful performance issues and prioritize important changes. Choosing the right tool is an investment. It contributes to a smoother, more efficient testing process. Explore the GoReplay blog for real-world use cases and best practices. Focus on practical aspects, not just features, to select tools that genuinely enhance your testing.
Integrating Application Performance Testing Into DevOps

Performance testing shouldn’t be an obstacle. It should be a fundamental part of your delivery pipeline. This means integrating application performance testing directly into your DevOps processes. Let’s explore how.
Automating Performance Checks Without Bottlenecks
Automated performance checks within the CI/CD pipeline offer constant feedback. But poorly designed automated tests can create slowdowns. The solution? Balance.
Implement lightweight performance tests early, focusing on quick checks for major regressions. More thorough tests can be scheduled overnight or before releases. This tiered approach ensures regular feedback without impacting development speed.
For example, quick API response time checks can run with every commit. Full load tests can happen less frequently. This targeted strategy provides valuable data without disrupting the development flow.
Creating Realistic Test Environments and Data
Accurate performance testing demands environments that reflect real-world conditions. This is often a challenge because production infrastructure and data can be complex. One effective solution is using containerization with tools like Docker to build consistent and scalable test environments.
Realistic test data is equally critical. Using anonymized or synthetic data that mirrors production data patterns makes your tests more accurate. This involves mimicking data volume, variety, and speed. By reflecting production, you’ll have more confidence in your results and identify performance problems that truly impact users.
Establishing Performance Baselines and Guardrails
Setting performance baselines provides a standard for measuring future performance. These baselines, combined with clear performance goals, act as guardrails. They prevent performance regressions and allow for continuous delivery.
For example, setting a limit for average page load time and tracking it constantly allows you to identify and address performance problems before they affect users.
The software testing market continues to grow, emphasizing the significance of application performance testing. By 2025, this industry is projected to reach $58.6 billion in revenue. Want to learn more? Find more detailed statistics here.
Implementing Parallel Testing for Faster Feedback
Parallel testing drastically speeds up the testing process. By running multiple tests at the same time, you receive feedback faster, maintaining pipeline velocity. This is particularly useful for complex applications with many tests.
Running load tests on different browser versions simultaneously reduces the overall testing time. This ensures comprehensive testing without slowing down development, catching potential issues early. Parallel testing also optimizes resource use.
GoReplay: Strengthening Your DevOps Pipeline
GoReplay simplifies incorporating realistic application performance testing into your DevOps pipeline. By replaying actual production traffic, you can create load tests that accurately reflect user behavior.
GoReplay integrates seamlessly with CI/CD tools, automating these tests and providing constant performance feedback. Its ability to filter and adjust traffic adds flexibility, strengthening your DevOps pipeline. This helps identify real-world performance issues before they affect your users.
Application Performance Testing Strategies That Actually Work
Let’s move beyond theory and explore practical application performance testing strategies that deliver tangible results. We’ll examine proven methods used by performance engineering teams to optimize high-traffic applications across diverse industries.
Crafting Realistic Test Scenarios
Effective application performance testing hinges on realistic scenarios. Instead of focusing on idealized user workflows, your tests should mirror actual user behavior. This involves understanding how users interact with your application.
Consider common usage patterns, peak traffic times, and potential bottlenecks. For example, when testing an e-commerce site, simulate users browsing products, adding items to their carts, and completing purchases.
Also, factor in network conditions, device limitations, and third-party dependencies. Simulating slow network speeds or testing on various devices ensures your application performs well for all users. Accounting for third-party API response times prevents unforeseen performance hiccups. For a deeper dive, check out this article on How to master performance testing.
Navigating Common Pitfalls
Even with meticulous planning, performance testing can present challenges. Creating production-like testing environments is often complex. Mirroring production data, infrastructure, and configurations requires significant effort.
Managing test data also poses difficulties. Generating realistic test data while ensuring data privacy demands careful attention. Another common oversight is neglecting thorough analysis of test results.
Simply running tests isn’t sufficient. Analyzing metrics, identifying bottlenecks, and implementing solutions are crucial for successful performance optimization. This often requires close collaboration between developers and performance engineers.
Progressive Load Testing and Bottleneck Isolation
Progressive load testing is a valuable technique. It involves gradually increasing the load on your application to efficiently identify breaking points. This helps determine the maximum load your application can handle before performance degrades.
Starting with a low load and incrementally increasing it helps pinpoint the exact threshold where performance begins to suffer. Isolating performance bottlenecks in complex systems can be tricky.
Profiling tools and performance monitoring solutions, like New Relic, can help pinpoint specific code segments or infrastructure components causing slowdowns. This targeted approach simplifies problem-solving and allows for focused solutions.
GoReplay: Simplifying Real-World Testing
GoReplay is a powerful tool in your performance testing toolkit. Its ability to capture and replay real HTTP traffic allows you to create test scenarios based on actual user behavior. This provides valuable insights into how your application responds to real-world traffic patterns. You might find this article helpful: How to master real-world traffic replay.
Features like session-aware replay and TLS optimization ensure accurate simulations. By simulating real-world conditions, GoReplay helps you proactively identify and address performance bottlenecks. Understanding these strategies and using tools like GoReplay empowers you to build high-performing applications. This leads to meeting user expectations and providing a seamless experience.
The Future of Application Performance Testing
The world of application performance testing is constantly changing. To stay competitive, organizations must understand emerging trends. These trends influence how top companies validate performance. Two key trends are AI-powered anomaly detection and real-user monitoring (RUM). These are becoming essential parts of testing strategies.
AI-Powered Anomaly Detection: The Next Frontier
Traditional performance tests often use pre-set thresholds and simulated scenarios. Modern applications, however, are complex and need better methods. That’s where AI comes in. AI-powered anomaly detection finds unusual patterns in performance data. It can even find patterns missed by traditional methods. This lets teams fix performance bottlenecks quickly, keeping users happy.
Imagine AI detecting a spike in database queries during off-peak hours. This signals a possible problem that needs attention, preventing small issues from becoming major incidents.
Real-User Monitoring (RUM): Bridging the Gap
Simulated tests are important, but they don’t always reflect real user interactions. RUM collects data directly from user interactions in production. This fills the gap left by simulated tests. RUM provides real-time information about actual user experiences. Combining RUM with traditional testing gives a complete picture of performance. This helps teams constantly improve their applications.
For example, RUM might show slow loading times for users on certain devices or networks. This reveals improvement areas missed by simulations.
Adapting to Modern Architectures
Applications are becoming more distributed. Architectures like microservices, serverless, and edge computing are common. Traditional performance testing struggles with these setups. They require strategies that account for interactions between independent components. This means moving from single system tests to a more distributed testing approach.
Testing individual microservices separately, then checking their combined performance helps identify issues. These issues often arise from inter-service communication or dependencies.
Embracing the Challenges of Tomorrow
The future holds exciting developments. These include immersive experiences like virtual reality (VR) and augmented reality (AR), and the growth of the Internet of Things (IoT). These need performance testing strategies that handle large data streams, low-latency needs, and various devices.
This could involve testing across different VR headsets with different capabilities. IoT device testing needs to consider low-power limits and data from many sensors.
The Evolution of Application Performance Testing
Traditional testing methods that don’t adapt are losing effectiveness. Maintaining performance requires modern solutions. These include AI-driven testing, shift-right performance monitoring, and chaos engineering. These build resilience in distributed systems.
Successful teams are already incorporating performance testing throughout development. They use automated testing and focus on performance. GoReplay captures and replays real user traffic. This bridges the gap between testing and production. It creates realistic test scenarios that mirror real-world user activity. This makes it easier to anticipate and address performance challenges.
Want to improve your performance testing and future-proof your applications? Explore GoReplay. Discover more about GoReplay.