Unlocking Peak Performance: A Deep Dive into Today’s Top APM Tools
Slow applications frustrate users and impact revenue. Finding the right application performance monitoring (APM) tools is crucial for maintaining speed, reliability, and a positive user experience. This guide dives deep into 12 leading APM tools, offering practical insights based on real-world usage. We’ll explore the strengths and weaknesses of each, examining features, pricing, and ideal use cases. This detailed analysis will empower you to select the perfect APM solution for your specific needs in 2025, regardless of your organization’s size.
This listicle provides a comprehensive comparison of the following APM tools:
- Dynatrace
- New Relic
- AppDynamics
- Datadog
- SolarWinds AppOptics
- Splunk APM
- Elastic APM
- Instana
- Prometheus
- Raygun
- Site24x7
- LogicMonitor
We’ll go beyond simple feature lists and marketing hype. Expect practical implementation guidance and honest assessments, including limitations. You’ll gain insights into which tool excels in specific scenarios, helping you optimize your application performance effectively. Let’s get started.
1. Dynatrace
Dynatrace stands out among application performance monitoring (APM) tools for its robust AI-powered analytics. It offers full-stack observability, allowing you to visualize performance bottlenecks from the frontend user experience down to the backend database. This makes it an excellent choice for complex, cloud-native applications where pinpointing issues quickly is critical. I’ve found its automated root cause analysis to be particularly helpful in production incidents, significantly reducing troubleshooting time.
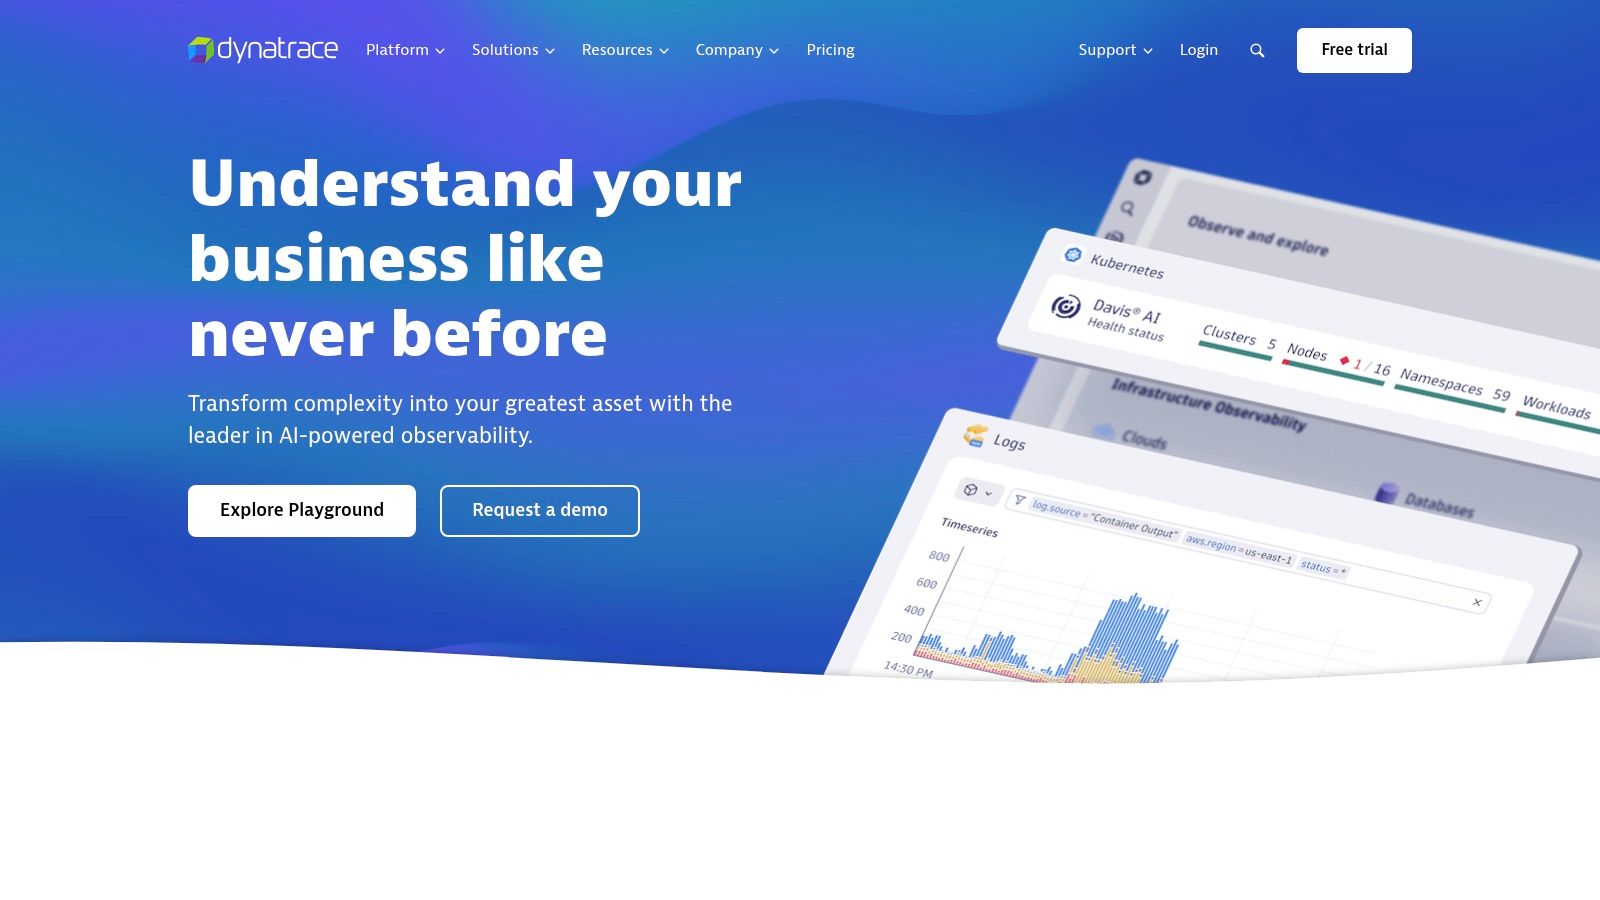
Dynatrace excels at automatically discovering and instrumenting services, minimizing manual configuration. This automation is a significant advantage in dynamic, microservices-based environments. While Dynatrace supports hybrid cloud environments, its strength lies in monitoring cloud-native architectures on platforms like AWS, Azure, and Google Cloud.
Key Features and Benefits
- AI-driven Root Cause Analysis: Dynatrace automatically analyzes anomalies and pinpoints the root cause, reducing MTTR (mean time to resolution).
- Real-time User Monitoring: Capture real user experience data to identify and address performance issues impacting customers.
- Automated Instrumentation: Reduces manual setup and ensures comprehensive coverage across your application landscape.
Pros and Cons
Pros:
- Fast and accurate problem identification: The AI engine excels at quickly isolating performance bottlenecks.
- Comprehensive full-stack visibility: Monitor everything from user interactions to backend database queries.
- Seamless cloud integration: Easily integrate with major cloud providers.
Cons:
- Cost: Dynatrace’s premium pricing might be prohibitive for smaller organizations or projects with limited budgets.
- Complexity: Fully utilizing all features can be challenging due to the platform’s depth and breadth. There is a learning curve involved.
Implementation and Considerations
Implementing Dynatrace typically involves installing OneAgent, a lightweight agent, on your hosts. It automatically discovers and instruments your applications. While the initial setup is relatively straightforward, mastering the advanced features requires some investment in training and exploration. Consider Dynatrace if your application landscape is complex, relies heavily on cloud-native technologies, and requires fast, automated problem resolution. Visit their website for more details: https://www.dynatrace.com/
2. New Relic
New Relic is a comprehensive observability platform providing detailed performance metrics and diagnostics. It offers full-stack monitoring across various environments, making it a solid choice for organizations seeking a unified view of their application performance. From my experience, New Relic’s strength lies in its customizable dashboards and alerting capabilities, enabling you to tailor the platform to your specific needs.
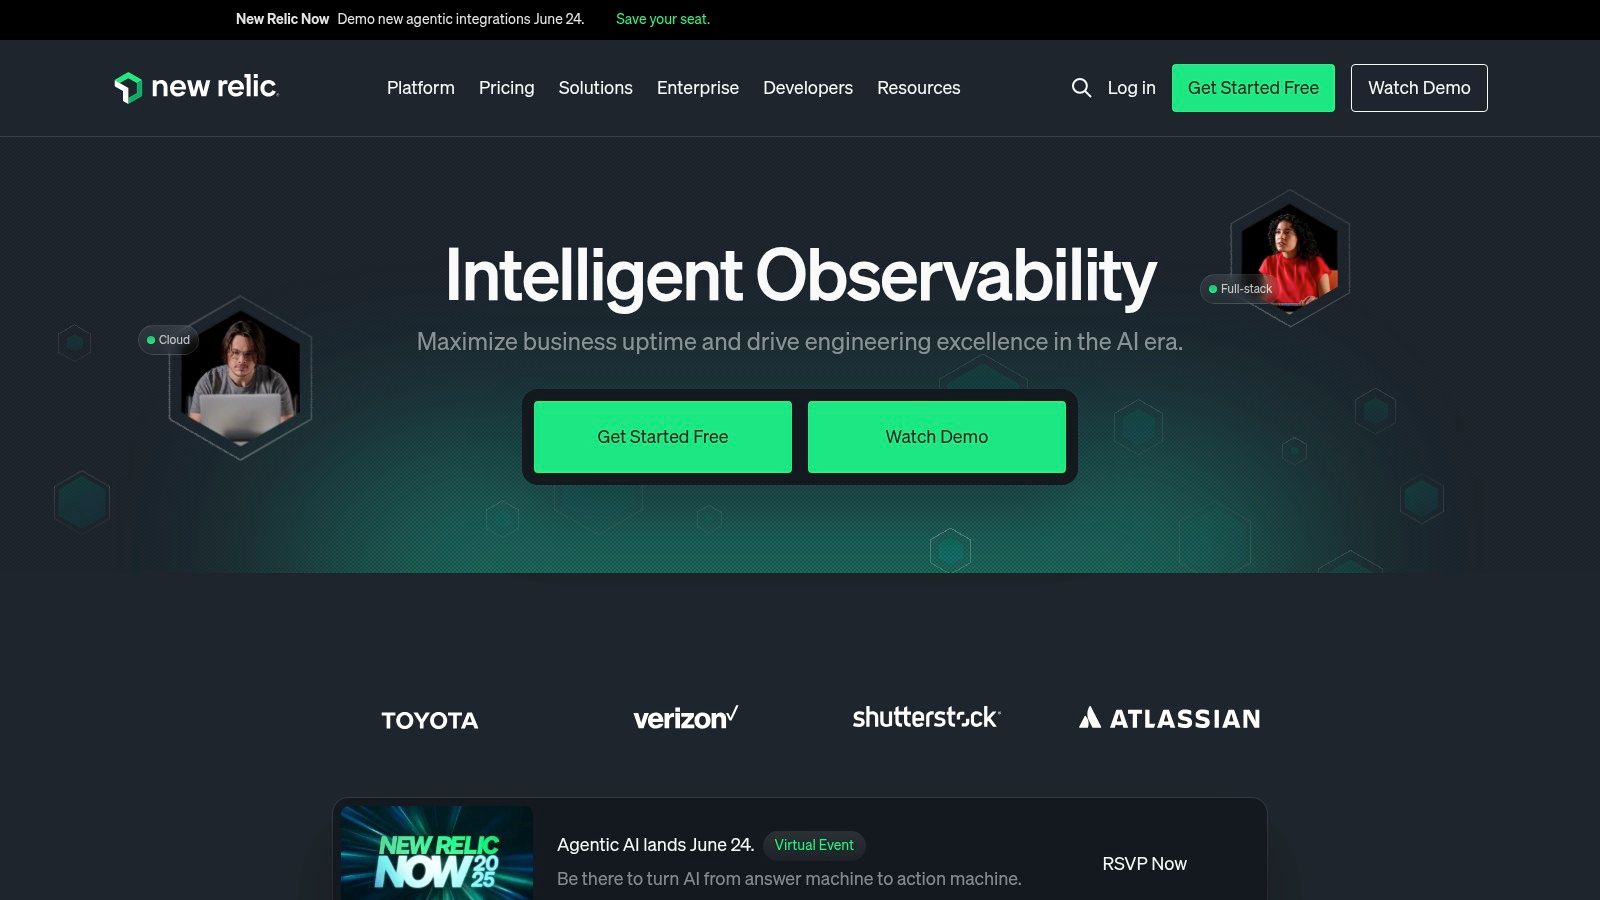
New Relic excels at providing granular insights into application performance. Its distributed tracing capabilities are particularly helpful in understanding complex transaction flows across microservices. While New Relic offers a generous free tier, managing costs can become challenging as data volumes increase. Its pricing model is usage-based, which can lead to unpredictable expenses.
Key Features and Benefits
- Real-time Performance Monitoring: Observe application performance metrics in real time, allowing for immediate identification of issues.
- Detailed Transaction Tracing: Follow transactions across services to pinpoint bottlenecks and optimize performance.
- Customizable Dashboards and Alerts: Create tailored dashboards and alerts to focus on critical metrics and receive timely notifications.
Pros and Cons
Pros:
- Broad Feature Set: Offers a comprehensive suite of tools for full-stack observability.
- Effective Monitoring: Provides detailed insights into application performance.
- Extensive Integrations: Integrates with a wide range of cloud providers and third-party tools.
Cons:
- Complex Setup: Configuring New Relic can be initially challenging, requiring careful planning and execution.
- Unpredictable Pricing: Usage-based pricing can lead to unexpected cost increases with growing data volumes.
Implementation and Considerations
Implementing New Relic usually involves installing agents on your application servers. These agents collect performance data and send it to the New Relic platform. While the initial setup can be complex, New Relic provides extensive documentation and support. Consider New Relic if you need a powerful observability platform with customizable dashboards and alerting, but be mindful of the potential cost implications as your data usage grows. Visit their website for more details: https://newrelic.com/
3. AppDynamics
AppDynamics, acquired by Cisco, is a robust application performance monitoring (APM) tool focused on correlating application performance with business outcomes. It provides deep insights into transaction flows, user experience, and infrastructure health, making it particularly valuable for organizations that need to understand how performance impacts their bottom line. I’ve used AppDynamics to identify performance bottlenecks that directly affected conversion rates and revenue, allowing for targeted optimizations with measurable ROI.

AppDynamics excels at business transaction monitoring. It automatically discovers and maps business transactions, allowing you to track their performance from end to end. This is crucial for understanding how different components of your application contribute to overall business goals. While it supports various deployment models, its strengths are most apparent in complex enterprise environments where understanding the business impact of performance is paramount.
Key Features and Benefits
- Business Transaction Monitoring: Track and analyze the performance of key business transactions across your application.
- Dynamic Baselining: Automatically establishes performance baselines and detects anomalies, simplifying performance monitoring.
- Real-time Business Performance Correlation: Correlate application performance with business metrics to understand the impact of technical issues on revenue and other key indicators.
Pros and Cons
Pros:
- Strong focus on business impact: Directly links application performance to business outcomes.
- Robust analytics and reporting: Provides comprehensive dashboards and reports for performance analysis and trend identification.
- Excellent integration with Cisco infrastructure: Seamlessly integrates with other Cisco networking and security tools.
Cons:
- Cost: Can be expensive, particularly for organizations requiring advanced features or extensive monitoring coverage.
- Complexity: The platform can be complex to navigate and manage, requiring dedicated training and expertise.
Implementation and Considerations
Implementing AppDynamics involves installing agents on your application servers. The platform then automatically discovers and instruments your applications, mapping business transactions. While the initial setup is relatively straightforward, mastering the advanced features and reporting capabilities can involve a learning curve. Consider AppDynamics if your organization needs to deeply understand the relationship between application performance and business outcomes, particularly if you already utilize Cisco infrastructure. Visit their website for more details: https://www.appdynamics.com/
4. Datadog
Datadog is a popular cloud-native application performance monitoring (APM) tool known for its real-time monitoring, analytics, and extensive cloud platform integrations. It provides comprehensive visibility into applications, infrastructure, and logs, making it a strong choice for organizations heavily invested in cloud environments. From my experience, Datadog’s strength lies in its breadth of integrations and the ability to correlate metrics from various sources to get a holistic view of system performance.
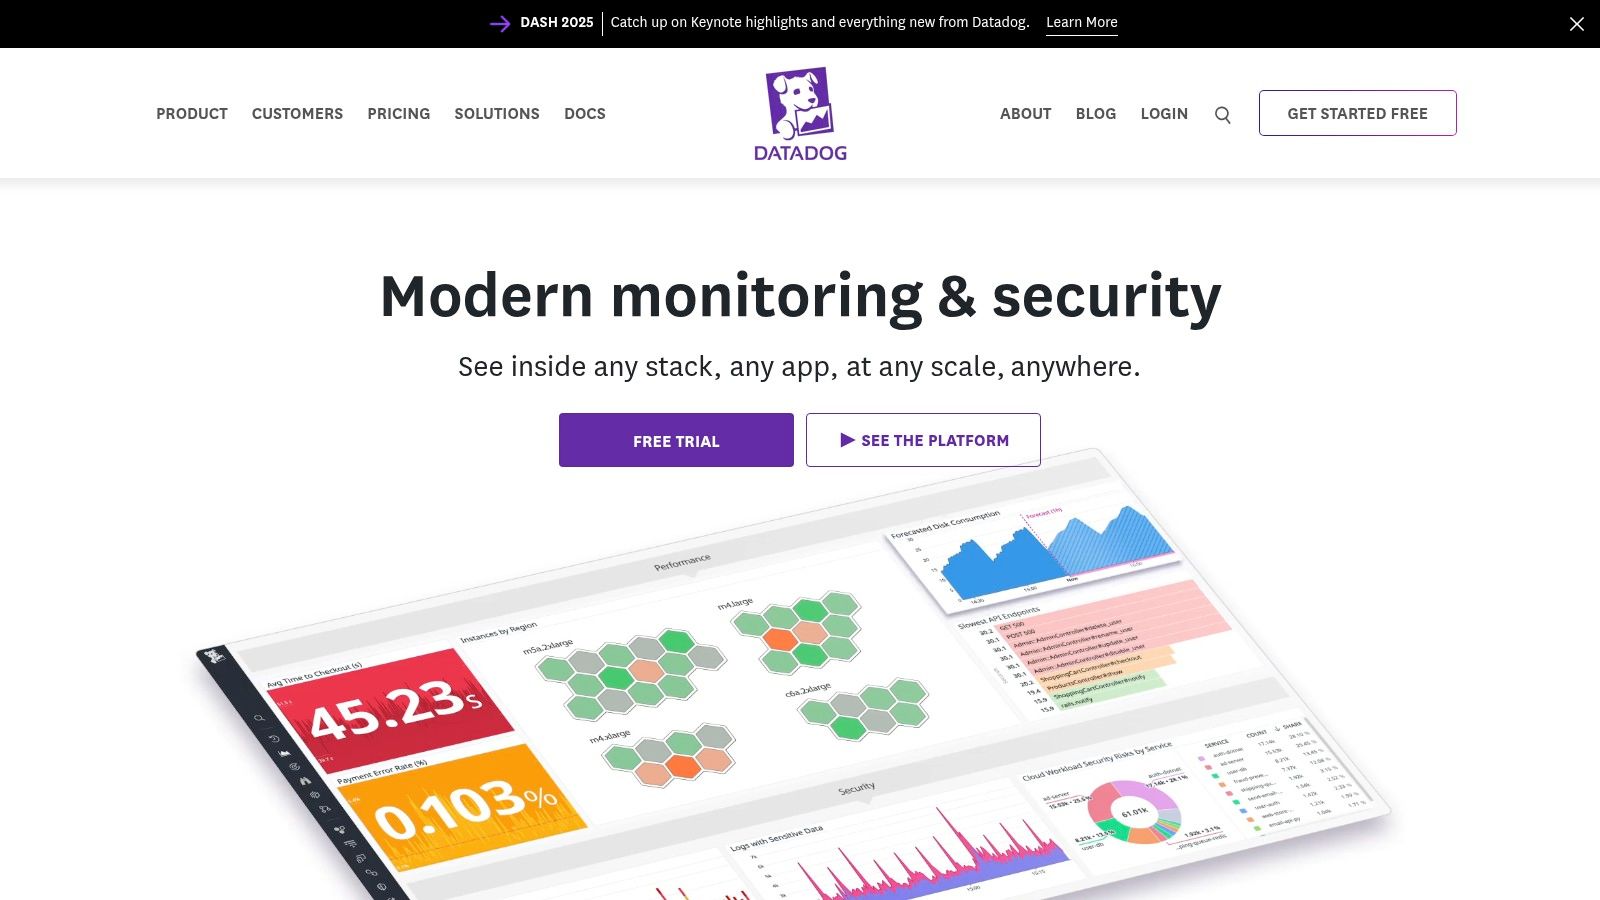
Datadog excels in dynamic, microservices-based architectures. It automatically discovers and instruments services, simplifying the monitoring setup. This automation is crucial in fast-paced cloud environments where infrastructure changes frequently. While Datadog’s pricing can be a concern, its robust features and ease of use often justify the cost, especially for organizations seeking a comprehensive application performance monitoring solution. Learn more about Datadog and how it fits in the wider world of API monitoring.
Key Features and Benefits
- Real-time Monitoring and Analytics: Datadog offers real-time insights into application performance, infrastructure health, and log data.
- Cloud-Native Integrations: Seamlessly integrates with major cloud providers like AWS, Azure, and Google Cloud Platform.
- Anomaly Detection and Alerting: Automatically detects anomalies and triggers alerts, enabling proactive issue identification.
Pros and Cons
Pros:
- Extensive Integrations: Supports a wide range of technologies and platforms, providing comprehensive visibility.
- Intuitive Dashboards: Create custom dashboards to visualize key performance indicators and track trends.
- Scalability: Designed to handle large volumes of data from complex, distributed systems.
Cons:
- Pricing: Can become expensive as data ingestion and usage increase, especially for larger organizations.
- Customization Complexity: While dashboards are customizable, achieving advanced configurations can require some effort.
Implementation and Considerations
Implementing Datadog typically involves installing agents on your hosts and configuring integrations with your applications and services. The setup process is generally straightforward. However, fine-tuning dashboards and alerts to meet specific monitoring needs may require some time and experimentation. Consider Datadog if you prioritize real-time visibility, cloud-native integration, and extensive monitoring capabilities, and are prepared for the associated costs. Visit their website for more details: https://www.datadoghq.com/
5. SolarWinds AppOptics
SolarWinds AppOptics offers a balanced approach to application performance monitoring (APM), combining robust features with user-friendly design. It shines in its ability to provide comprehensive visibility into both application and infrastructure performance, helping teams quickly identify and resolve issues. In my experience, AppOptics is particularly well-suited for small to medium-sized businesses (SMBs) seeking a cost-effective yet powerful APM solution. Its intuitive interface makes it easy to get started without a steep learning curve.
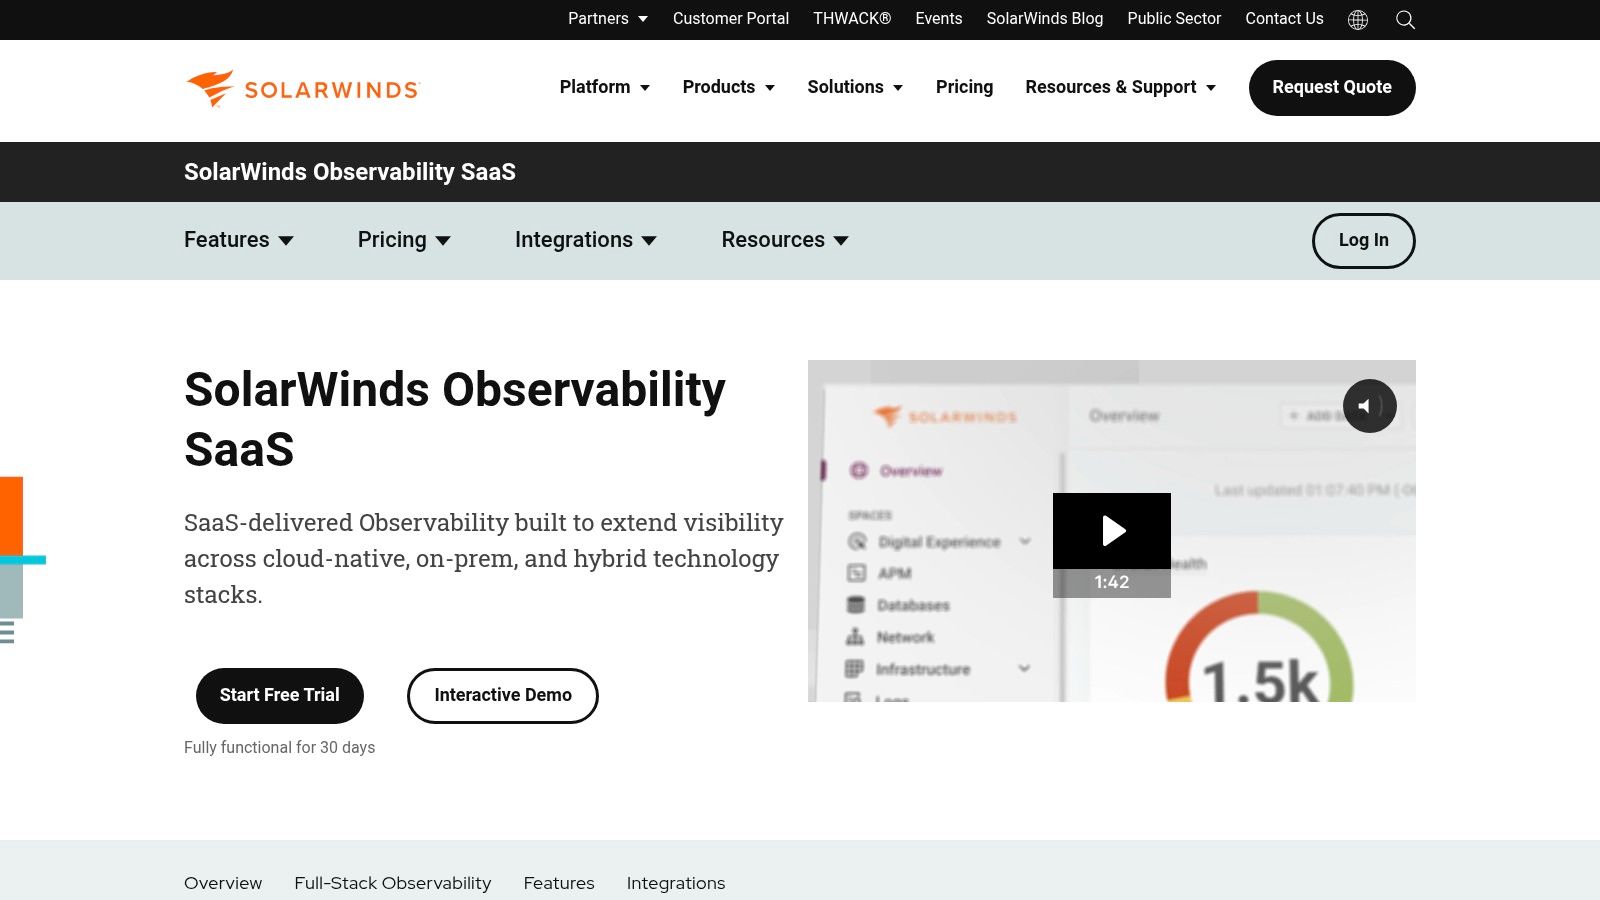
AppOptics excels in hybrid environments, supporting both cloud and on-premise deployments. While it may not offer the same depth of AI-driven analysis as some enterprise-grade APM tools, its customizable dashboards and alerting system provide valuable insights into application health and performance. The integration with other SolarWinds tools is a bonus for organizations already within the SolarWinds ecosystem.
Key Features and Benefits
- Unified Monitoring: Gain a single view of your entire application stack, from infrastructure to application code.
- Customizable Dashboards: Tailor dashboards to specific needs and track key metrics.
- Distributed Tracing: Follow transactions across distributed services to pinpoint performance bottlenecks.
Pros and Cons
Pros:
- Easy to Use: The intuitive interface allows for quick onboarding and easy navigation.
- Affordable Pricing: AppOptics offers competitive pricing accessible to SMBs.
- Solid Feature Set: Provides a good balance between features and usability.
Cons:
- Limited Advanced Features: May lack some of the advanced AI and automation capabilities of higher-priced competitors.
- Scalability: Might not be the ideal solution for extremely complex, large-scale enterprise environments.
Implementation and Considerations
Implementing AppOptics is relatively straightforward, typically involving installing agents on your servers and configuring application instrumentation. The platform offers flexible deployment options, supporting various cloud providers and on-premise infrastructures. If you’re looking for an easy-to-use, comprehensive APM tool with a reasonable price point, SolarWinds AppOptics is definitely worth considering. Visit their website for detailed pricing and a free trial: https://www.solarwinds.com/appoptics
6. Splunk APM
Splunk APM goes beyond basic application performance monitoring, offering deep insights into your application’s health and performance by correlating metrics, traces, and logs. Its strength lies in providing a unified view of your entire infrastructure, enabling you to quickly identify and resolve performance bottlenecks and troubleshoot complex issues. I’ve found its service mapping capabilities particularly useful for visualizing dependencies and understanding the impact of performance issues across different services.
Splunk APM excels in distributed tracing, providing code-level visibility that helps pinpoint the exact lines of code causing performance degradation. This granular level of detail is invaluable when optimizing complex applications. While Splunk’s robust features are a significant advantage, the initial setup and configuration can be challenging, requiring a deeper understanding of the platform.
Key Features and Benefits
- Service Mapping: Automatically discovers and maps service dependencies, providing a clear view of your application architecture.
- Distributed Tracing: Follow requests across multiple services, gaining insights into performance bottlenecks at each step.
- Code-Level Visibility: Drill down to specific lines of code impacting performance, simplifying debugging and optimization efforts.
Pros and Cons
Pros:
- Comprehensive monitoring: Offers a holistic view of application performance across your entire infrastructure.
- Real-time insights: Analyze data in real-time to quickly identify and address performance issues.
- Powerful analytics: Leverage Splunk’s powerful analytics engine to gain deeper insights into application behavior.
Cons:
- Complexity: The platform’s breadth of features can make initial setup and configuration complex.
- Resource intensive: Splunk can be resource-intensive, especially for organizations with large data volumes.
Implementation and Considerations
Implementing Splunk APM involves installing agents and configuring data sources. While the setup can be challenging, the resulting insights are invaluable for optimizing application performance. Consider Splunk APM if your application landscape is complex, requires deep code-level visibility, and you need the ability to correlate data from multiple sources. Visit their website for more details: https://www.splunk.com/
7. Elastic APM
Elastic APM, a component of the Elastic Stack, provides robust application performance monitoring with a focus on distributed tracing and powerful search analytics. It’s particularly well-suited for organizations already invested in the Elastic ecosystem, offering seamless integration with Kibana for visualization and Elasticsearch for log analysis. In my experience, its strength lies in troubleshooting complex microservices architectures where understanding transaction flows is critical.
Elastic APM automatically generates service maps, visualizing the dependencies between different services, which is incredibly valuable for understanding the impact of performance issues. While its distributed tracing capabilities are excellent, the initial setup and configuration can be more involved compared to some other APM tools. This complexity is often offset by the rich insights gained once the system is properly configured.
Key Features and Benefits
- Distributed Tracing: Follow transactions across multiple services to identify performance bottlenecks and latency issues.
- Real User Monitoring (RUM): Capture client-side performance data to understand user experience and identify frontend issues.
- Integration with Elastic Stack: Leverage the power of Kibana for visualization and Elasticsearch for log analysis and correlation.
Pros and Cons
Pros:
- Powerful search and analytics: Quickly find and analyze performance data using Elasticsearch queries.
- Open-source flexibility: Benefit from the open-source nature of the Elastic Stack, allowing for customization and community support.
- Excellent for microservices: The distributed tracing and service mapping capabilities are ideal for complex, distributed applications.
Cons:
- Steeper learning curve: Setting up and configuring Elastic APM can be more complex compared to some other APM tools.
- Resource intensive: Elasticsearch can be resource-intensive, especially for organizations with high data volumes.
Implementation and Considerations
Implementing Elastic APM typically involves installing agents in your application code and configuring them to report data to an Elasticsearch cluster. Familiarity with the Elastic Stack is beneficial for effectively utilizing the platform. Consider Elastic APM if you’re already using the Elastic Stack and need powerful distributed tracing capabilities for complex application architectures. Visit their website for more details: https://www.elastic.co/apm
8. Instana
Instana stands out among application performance monitoring (APM) tools for its automation and real-time insights, specifically designed for the complexities of microservice architectures. It automatically discovers, instruments, and monitors your services, providing a deep understanding of performance bottlenecks across your entire application stack. I’ve found its automated root cause analysis and real-time dashboards incredibly valuable in quickly identifying and resolving production issues in dynamic, containerized environments.

Instana excels in highly dynamic environments where manual instrumentation would be a nightmare. Its agent automatically adapts to changes in your infrastructure, adding and removing monitoring as needed. While Instana supports various platforms, its strength lies in monitoring containerized and cloud-native applications, especially those built on Kubernetes.
Key Features and Benefits
- Automated Instrumentation: Instana requires minimal manual configuration, automatically discovering and instrumenting services as they deploy.
- Real-time Monitoring: Observe metrics and traces in real time, allowing for immediate identification of performance degradations.
- AI-powered Analysis: Instana utilizes machine learning for anomaly detection and root cause analysis, accelerating troubleshooting.
Pros and Cons
Pros:
- Rapid Issue Resolution: Real-time monitoring and AI-powered analysis enable quick identification and resolution of performance problems.
- Effortless Setup: Automated instrumentation drastically reduces manual configuration efforts.
- Comprehensive Observability: Gain deep insights into your application performance, infrastructure health, and user experience.
Cons:
- Cost: Instana’s pricing can be substantial for smaller organizations or projects with limited budgets.
- Feature Richness: While beneficial, the extensive feature set can sometimes feel overwhelming for new users.
Implementation and Considerations
Implementing Instana is generally straightforward, typically involving deploying a single agent on your host or within your containerized environment. The agent automatically handles the discovery and instrumentation of your applications. While the initial setup is simple, maximizing the platform’s capabilities might require some exploration and training. Consider Instana if you have a dynamic, microservices-based architecture, need real-time visibility, and prioritize automated problem resolution. Visit their website for more details: https://www.instana.com/
9. Prometheus
Prometheus shines as an open-source application performance monitoring (APM) tool specifically designed for cloud-native environments. Its focus on customizable time-series data collection and robust alerting makes it a powerful choice for teams comfortable with a more hands-on approach. I’ve found it particularly effective for monitoring Kubernetes clusters and microservices architectures, where its dynamic service discovery truly excels.
Prometheus’ strength lies in its flexibility and deep integration with the cloud-native ecosystem. Its pull-based model, where Prometheus scrapes metrics from instrumented applications, aligns perfectly with the ephemeral nature of containers and microservices. While its built-in visualization is basic, integration with Grafana unlocks powerful and customizable dashboards.
Key Features and Benefits
- Time-series Data: Prometheus stores metrics as time-series data, enabling powerful analysis and trend identification.
- Kubernetes Integration: Seamlessly integrates with Kubernetes for automated service discovery and monitoring.
- Alerting: Robust alerting capabilities allow you to define thresholds and receive notifications for critical performance issues.
Pros and Cons
Pros:
- Customization: Highly configurable to meet specific monitoring needs.
- Cloud-Native Focus: Excellent support for Kubernetes, Docker, and other cloud-native technologies.
- Open-Source: Free to use and modify, fostering community support and extensibility.
Cons:
- Technical Expertise: Requires a deeper understanding of system administration and monitoring principles for effective setup and management.
- Limited Visualization: Basic built-in visualization; Grafana integration is often necessary for advanced dashboards.
Implementation and Considerations
Implementing Prometheus involves deploying the Prometheus server and configuring it to scrape metrics from your target applications. You’ll need to instrument your applications to expose metrics in a format Prometheus understands. While the initial setup can be more involved than SaaS solutions, the level of control and customization is unmatched. Consider Prometheus if you have a cloud-native environment, require highly tailored monitoring, and have the technical expertise to manage an open-source solution. Visit their website for more details: https://prometheus.io/
10. Raygun
Raygun offers a robust suite of tools for monitoring application performance, focusing heavily on error, crash, and real-user monitoring for both web and mobile applications. I’ve found it especially helpful for quickly identifying and diagnosing issues that directly impact end-users, allowing for faster resolution and improved customer satisfaction. Its detailed diagnostics and session replay capabilities provide invaluable context for understanding the root cause of problems.
Raygun integrates seamlessly with various application stacks and offers comprehensive support for both web and mobile environments. This broad compatibility makes it a versatile choice for organizations with diverse technology landscapes. While its strength lies in front-end performance monitoring, its capabilities extend to backend monitoring as well.
Key Features and Benefits
- Real-User Monitoring (RUM): Capture real user experience data, including performance metrics and session details, to understand how users interact with your application.
- Crash Reporting: Receive detailed reports on application crashes, including stack traces and device information, for faster debugging.
- Session Replay: Replay user sessions to see exactly what actions led to an error or crash, providing invaluable context for troubleshooting.
Pros and Cons
Pros:
- Fast Integration: Raygun is known for its easy and rapid integration with various platforms and frameworks.
- Comprehensive Reporting: The level of detail provided in crash and error reports is excellent, facilitating effective troubleshooting.
- User Experience Focus: Raygun’s focus on real user experience monitoring helps prioritize and address issues that directly affect customers.
Cons:
- Front-End Focus: While backend monitoring is offered, Raygun’s primary strength lies in front-end performance monitoring. This might make it less suitable for organizations primarily concerned with server-side performance.
- Privacy Considerations: Session replay, while extremely useful, can raise privacy concerns if not implemented and managed carefully. Ensure you comply with relevant data privacy regulations.
Implementation and Considerations
Implementing Raygun typically involves adding a lightweight SDK to your application. The SDK automatically captures performance data and error reports. While the initial setup is straightforward, configuring advanced features like session replay might require additional planning. Consider Raygun if your priority is understanding and improving real-user experience, and if your organization values detailed diagnostic information for fast and effective troubleshooting. Visit their website for more details: https://raygun.com/
11. Site24x7
Site24x7 provides a comprehensive monitoring solution combining application performance monitoring (APM), infrastructure, and website monitoring into a single unified view. This makes it a practical choice for organizations seeking a holistic understanding of their web application performance. I’ve found its integrated approach particularly valuable for correlating performance issues across different layers of the application stack, from the end-user experience to the underlying server infrastructure. It allows you to quickly pinpoint whether a slowdown originates from the application code, the database, or the network.
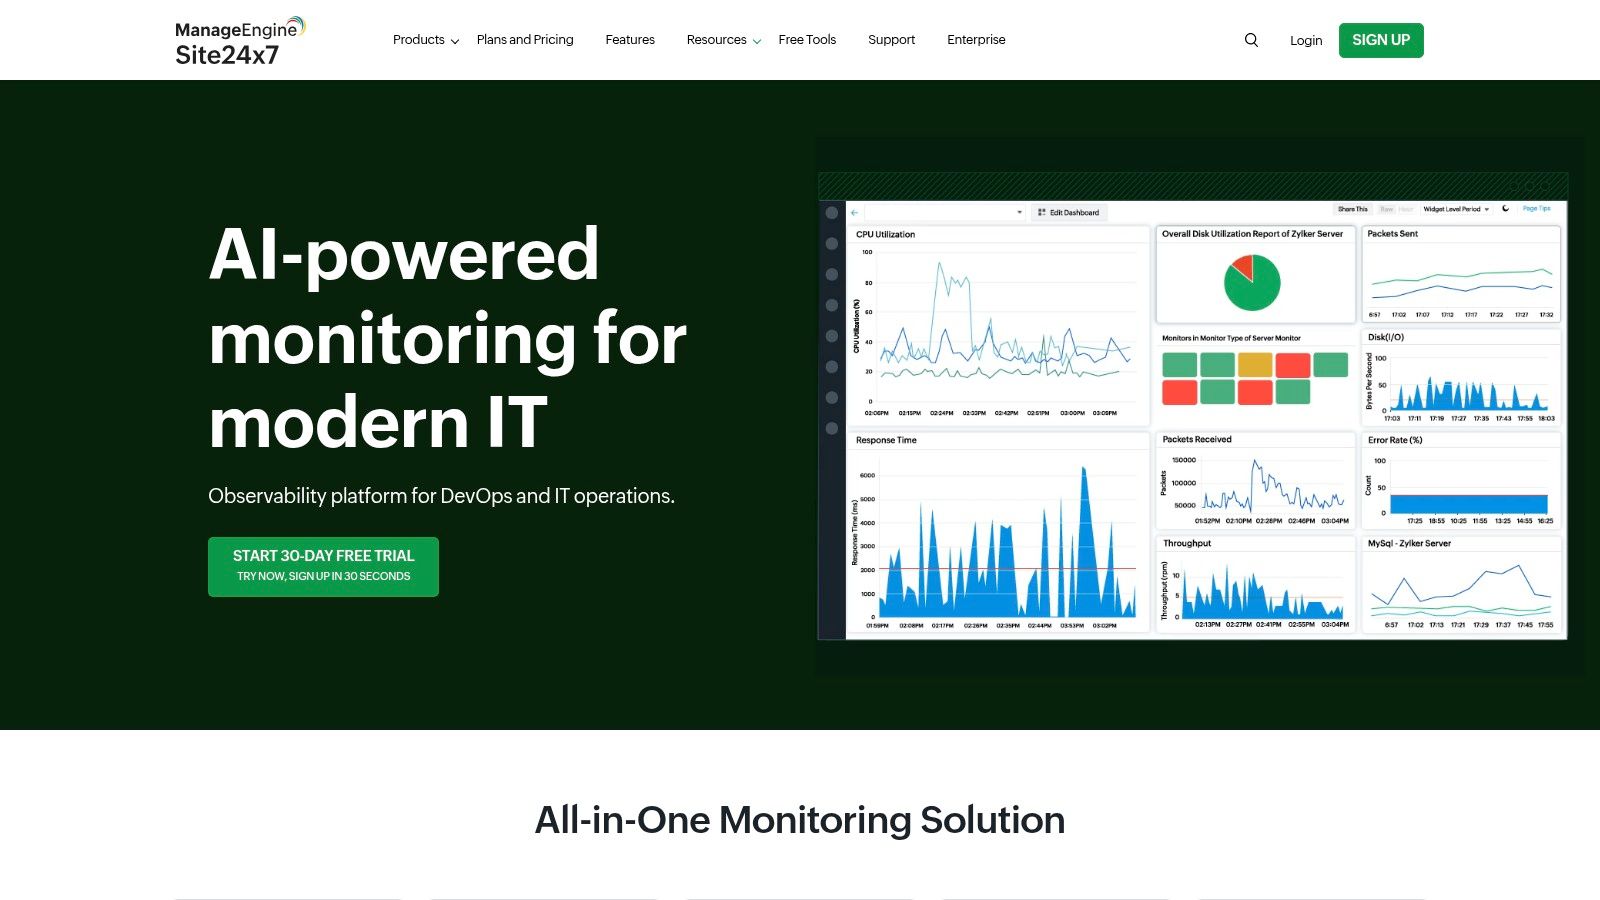
Site24x7 excels at providing a broad overview of your entire IT environment. While it might not offer the same depth of APM insights as specialized tools like Dynatrace, its strength lies in its breadth of coverage. It’s particularly well-suited for organizations that want to monitor both the performance and availability of their applications and infrastructure from a single platform. You can delve into application code performance, track server metrics, and monitor website uptime all within the same dashboard. For a deeper understanding of load testing and boosting application performance, you might find this article on load testing beneficial: Learn more about Site24x7.
Key Features and Benefits
- Synthetic Monitoring: Simulate user interactions to proactively identify performance issues before they impact real users.
- Real User Monitoring (RUM): Capture real user experience data to understand how performance varies across different geographies, devices, and browsers.
- Custom Dashboards: Tailor dashboards to visualize the metrics that matter most to your business.
Pros and Cons
Pros:
- Comprehensive Monitoring: Covers APM, infrastructure, and website monitoring in a single platform.
- Customizable Dashboards: Create personalized views to focus on key performance indicators.
- Effective for Monitoring Performance and Availability: Gain insights into both the speed and uptime of your applications.
Cons:
- Setup and Customization: Configuring the platform for your specific environment can take time.
- Cost: The pricing model might be challenging for smaller organizations with limited budgets.
Implementation and Considerations
Implementing Site24x7 typically involves installing agents on your servers and configuring monitoring for your applications and websites. While the initial setup requires some effort, the platform’s intuitive interface makes it relatively easy to manage once configured. Consider Site24x7 if you need a comprehensive monitoring solution that covers both application performance and infrastructure health, and are comfortable investing some time in the initial configuration process. Visit their website for more details: https://www.site24x7.com/
12. LogicMonitor
LogicMonitor is a cloud-based application performance monitoring (APM) tool that provides comprehensive visibility into your entire IT infrastructure. From applications and servers to network devices and cloud resources, LogicMonitor offers real-time monitoring with advanced anomaly detection and impressive scalability. I’ve found its customizable dashboards particularly useful for creating tailored views relevant to different teams, from operations to development. This allows for focused monitoring and faster identification of performance bottlenecks.
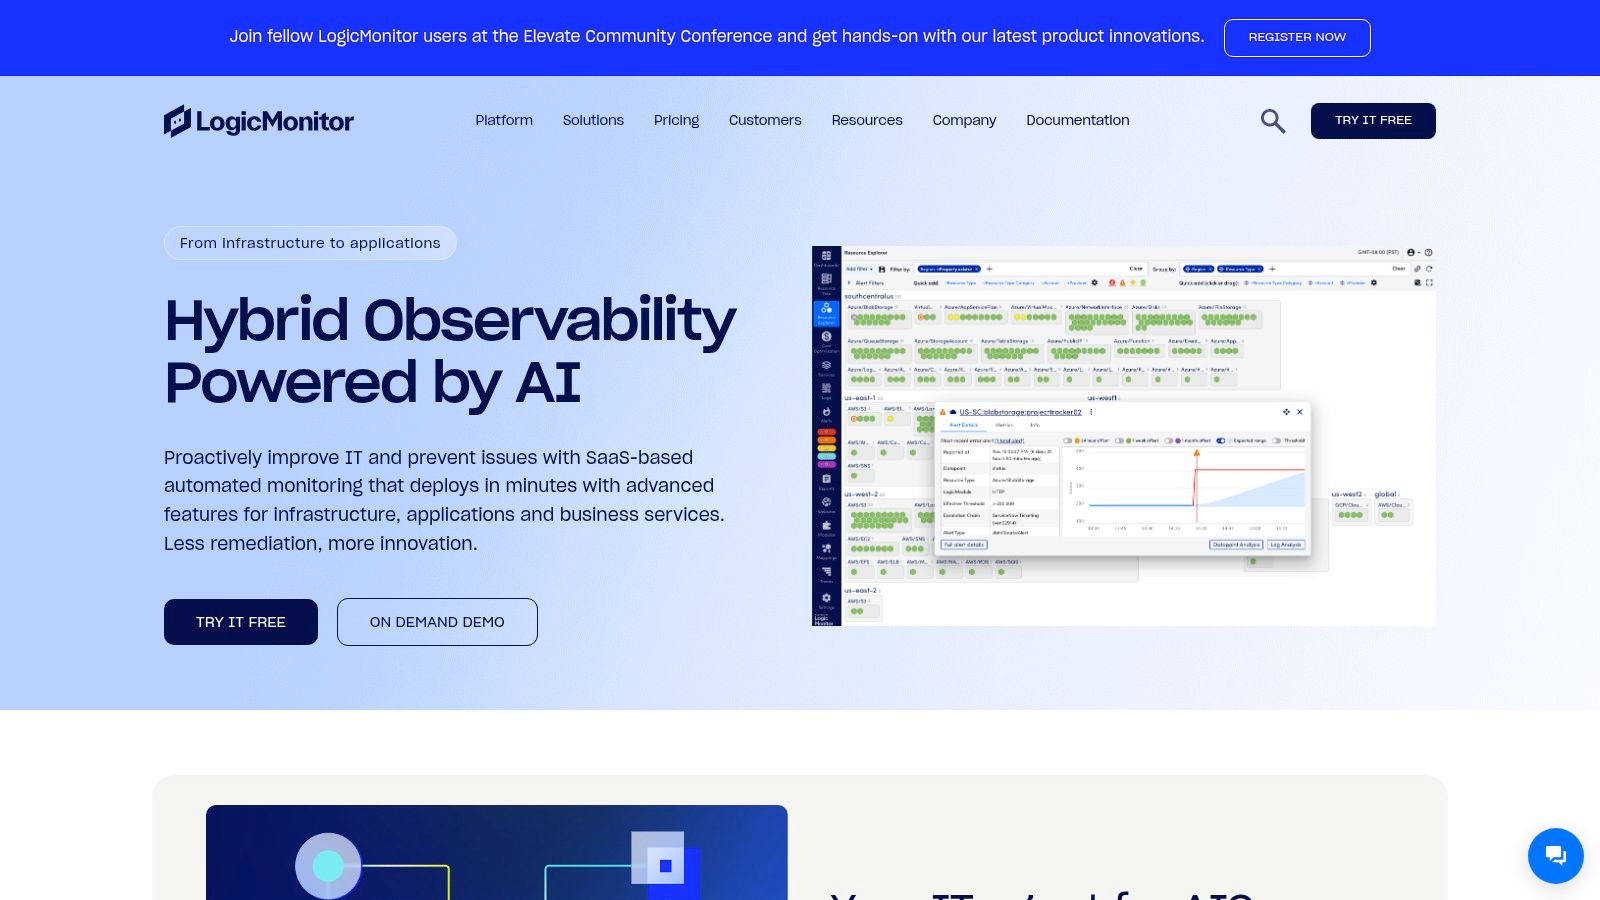
LogicMonitor excels at automatically discovering and monitoring devices and services across hybrid and cloud environments. Its agent-based and agentless monitoring capabilities offer flexibility in how you instrument your systems. This adaptability makes LogicMonitor suitable for organizations with complex, evolving infrastructures. While it has broad capabilities, LogicMonitor stands out in its robust support for Kubernetes and microservices monitoring, which is crucial in today’s cloud-native landscape.
Key Features and Benefits
- Full-Stack Observability: Monitor everything from user experience to infrastructure health in a single platform.
- Automated Discovery and Monitoring: Minimize manual configuration with automatic discovery and instrumentation.
- Advanced Anomaly Detection: Leverage machine learning to identify unusual behavior and proactively address potential issues.
Pros and Cons
Pros:
- Highly Scalable: LogicMonitor can adapt to growing infrastructure needs without performance degradation.
- Customizable Dashboards and Alerts: Tailor your monitoring views and notifications to specific requirements.
- Excellent Customer Support: Receive responsive and knowledgeable assistance from LogicMonitor’s support team.
Cons:
- Steep Learning Curve: Mastering all of LogicMonitor’s features and configurations can require some effort.
- Cost: Pricing can be substantial for smaller organizations, especially as you scale your monitored resources.
Implementation and Considerations
Implementing LogicMonitor typically begins with deploying Collectors, which gather data from your infrastructure. The platform then automatically discovers and begins monitoring your systems. While the initial setup is relatively straightforward, be prepared to invest time in customizing dashboards and configuring alerts to meet your specific needs. Consider LogicMonitor if your organization requires a highly scalable and customizable APM solution with strong support for hybrid cloud and containerized environments. Visit their website for more details: https://www.logicmonitor.com/
Top 12 APM Tools Feature Comparison
| Tool | Core Features ★✨ | User Experience ★ | Value Proposition 💰 | Target Audience 👥 | Unique Selling Points 🏆 | Price Points 💰 |
|---|---|---|---|---|---|---|
| Dynatrace | AI-driven analytics, root cause analysis ✨ | Comprehensive full-stack monitoring ★★★★ | Fast problem resolution with AI 💰 | Enterprises, cloud-native teams 👥 | Automated instrumentation, cloud integration 🏆 | Premium, higher cost 💰 |
| New Relic | Real-time monitoring, customizable alerts | Broad observability, user-friendly dashboards ★★★ | Extensive integrations, full-stack coverage 💰 | Medium to large businesses 👥 | Detailed transaction tracing, flexible alerts 🏆 | Variable, can be costly 💰 |
| AppDynamics | End-to-end APM, business transaction focus | Strong analytics, business correlation ★★★ | Deep insights on business impact 💰 | Enterprises, Cisco environments 👥 | Business performance correlation, Cisco tools 🏆 | High cost enterprise 💰 |
| Datadog | Real-time analytics, 400+ integrations | Cloud-native focus, customizable dashboards ★★★★ | Scalable cloud monitoring 💰 | DevOps teams, cloud users 👥 | Extensive cloud & tech integrations 🏆 | Costly at scale 💰 |
| SolarWinds AppOptics | App & infrastructure monitoring, ease of use | Simple setup, good insights ★★ | Affordable and scalable for SMBs 💰 | SMBs, growing teams 👥 | Easy to use, SolarWinds ecosystem support 🏆 | Budget-friendly 💰 |
| Splunk APM | Service mapping, code-level visibility | Real-time intelligence, detailed insights ★★★ | Powerful analytics for complex data 💰 | Large enterprises, data teams 👥 | Code-level trace, diverse data integration 🏆 | Premium, enterprise-grade 💰 |
| Elastic APM | Distributed tracing, Elastic Stack integration | Fast search & monitoring, open ecosystem ★★★ | Open-source flexibility 💰 | Devs, open-source advocates 👥 | Powerful analytics & distributed tracing 🏆 | Free core, premium support 💰 |
| Instana | Auto instrumentation, microservices support | Real-time alerts, comprehensive visibility ★★★ | Automated root cause analysis 💰 | Microservices teams, enterprises 👥 | ML-based trace analytics 🏆 | Premium pricing 💰 |
| Prometheus | Time-series data, Kubernetes support | Highly customizable, open-source ★★★★ | Free and extensible 💰 | Cloud-native, advanced users 👥 | Open-source, strong alerting capabilities 🏆 | Free & open-source 💰 |
| Raygun | Error & crash monitoring, real-user monitoring | Rapid integration, detailed diagnostics ★★ | Improves end-user experience 💰 | Developers, mobile/web apps 👥 | Session replay, crash reporting ✨ | Mid-range pricing 💰 |
| Site24x7 | Synthetic & real-user monitoring, dashboards | Unified web & infra monitoring ★★ | Comprehensive and customizable 💰 | SMBs, educational institutions 👥 | Combined APM + infrastructure monitoring 🏆 | Affordable with tiers 💰 |
| LogicMonitor | Full-stack visibility, anomaly detection | Scalable, customizable dashboards ★★★ | Enterprise-grade monitoring & support 💰 | Large enterprises, cloud-native 👥 | Strong Kubernetes & microservices monitoring 🏆 | Premium pricing 💰 |
Choosing the Right APM Tool: A Strategic Approach
This in-depth exploration of leading application performance monitoring tools has provided a comprehensive overview of their features, strengths, weaknesses, and ideal use cases. From established players like Dynatrace and New Relic to open-source options like Prometheus and Elastic APM, the landscape offers a solution for every need and budget. Remember, the best tool for you depends on your specific circumstances. There is no one-size-fits-all answer.
Key Considerations for APM Tool Selection
Choosing the right application performance monitoring tools can feel overwhelming. To simplify the process, focus on these key aspects:
- Scalability: Can the tool handle your current and future application traffic? Consider the growth potential of your application and choose a tool that can scale accordingly.
- Integration: Seamless integration with your existing tech stack is crucial. Look for tools that offer integrations with your preferred logging platforms, CI/CD pipelines, and other monitoring solutions.
- Ease of Use: A complex and cumbersome tool can hinder your team’s productivity. Prioritize tools with intuitive interfaces and easy-to-understand reporting.
- Cost: Evaluate the pricing models of different tools and consider your budget. Some tools offer tiered pricing based on usage, while others have fixed subscription fees.
- Alerting and Reporting: Effective alerting is essential for proactive performance management. Look for customizable alerting options that can notify you of critical issues in real time. Robust reporting features are also crucial for analyzing trends and identifying areas for optimization.
Implementing Your Chosen APM Tool: Best Practices
Once you’ve selected an application performance monitoring tool, successful implementation is key to maximizing its benefits:
- Define Clear Objectives: What do you hope to achieve with APM? Establishing specific, measurable, achievable, relevant, and time-bound (SMART) goals will guide your implementation process.
- Start Small: Don’t try to implement everything at once. Begin by monitoring critical applications and gradually expand coverage as you gain experience.
- Monitor Key Metrics: Focus on the metrics that matter most to your business. These may include response times, error rates, transaction throughput, and resource utilization.
- Continuously Monitor and Adjust: Application performance monitoring is an ongoing process. Regularly review your monitoring data and make adjustments as needed to optimize performance.
Making the Most of Your Investment in Application Performance Monitoring
Application performance is directly linked to user experience and business success. Investing in the right application performance monitoring tools empowers you to proactively identify and address performance bottlenecks, improve user satisfaction, and drive business growth. Remember to leverage free trials or free tiers offered by many vendors. This allows you to experience the tools firsthand and make an informed decision based on your specific requirements. The insights gained from these tools will provide you with a competitive edge, ensuring your applications remain performant, reliable, and scalable.
From tracing distributed transactions across microservices with Instana to leveraging the open-source flexibility of Prometheus, each tool offers unique strengths. Consider your specific requirements, from infrastructure monitoring to real-user monitoring, and choose the tool that best aligns with your goals. By carefully evaluating your needs and leveraging the information presented in this guide, you can confidently select and implement an APM solution that will propel your organization towards greater success.
To further enhance your application performance testing and monitoring, consider using GoReplay to capture and replay real-world traffic. This open-source tool allows you to test the resilience and scalability of your applications under realistic conditions, complementing the capabilities of your chosen APM tool. Visit GoReplay to learn more.