Top 8 Application Performance Monitoring Metrics for 2025
In the competitive digital marketplace, application performance is not just a technical concern; it’s a core business imperative. A slow, error-prone application can lead to user frustration, abandoned carts, and a damaged brand reputation. But how do you move from simply knowing performance is important to actively managing and improving it? The answer lies in data-driven insights derived from the right set of application performance monitoring metrics. These metrics are the vital signs of your digital services, providing a clear window into their health, stability, and efficiency.
This guide moves beyond generic definitions to offer a comprehensive roundup of the 8 most critical metrics you must track. We will explore what each one means, why it is crucial for your success, and provide actionable strategies for monitoring and optimization. We will also detail how tools like GoReplay can simulate real-world traffic, allowing you to test how changes impact these very metrics before they affect a single user. This proactive approach ensures robust and reliable application performance under any condition, turning performance data into a strategic advantage. Let’s dive into the essential metrics that will empower your team to build faster, more dependable software.
1. Response Time
Response time is arguably the most critical of all application performance monitoring metrics. It measures the total time elapsed from a user’s initial request to the moment they receive the complete response from the application. This end-to-end duration includes network transit time, server processing, database query execution, and any other dependencies involved in fulfilling the request. It is the most direct indicator of performance from the end-user’s perspective; a slow response time is often the first thing a user will notice and complain about.

This metric directly correlates with user satisfaction and business outcomes. For example, Amazon famously discovered that a mere 100-millisecond delay in page load time could decrease sales by 1%. Similarly, Google aims for search query responses under 200 milliseconds to maintain a seamless user experience.
Why Response Time Matters
Monitoring response time is essential for understanding how your application feels to its users. A consistently low response time leads to higher engagement, better conversion rates, and improved user retention. Conversely, high or unpredictable response times can lead to user frustration, cart abandonment, and damage to your brand’s reputation. It serves as a high-level health indicator; a sudden spike often points to underlying issues in your infrastructure, code, or third-party services.
Actionable Tips for Monitoring Response Time
To effectively track this crucial metric, move beyond simple averages which can hide significant problems.
- Monitor Percentiles: Track the 95th (p95) and 99th (p99) percentiles. This shows you the experience of your worst-affected users, which is a much better indicator of systemic issues than an average value skewed by many fast responses.
- Set Dynamic Thresholds: Not all requests are equal. A user login might have a different acceptable response time than a complex report generation. Set specific, context-aware thresholds and alerts for different application endpoints.
- Segment by Geography: Users in different parts of the world will experience different network latency. Segment response time data by geographic location to identify and address regional performance bottlenecks, potentially with a Content Delivery Network (CDN).
2. Throughput (Requests Per Second)
While response time measures speed, throughput measures capacity. It is one of the most fundamental application performance monitoring metrics, quantifying the number of requests, transactions, or operations an application can handle within a specific time period. This is typically expressed as requests per second (RPS), requests per minute (RPM), or transactions per minute (TPM). Throughput indicates your application’s processing power and its ability to scale under pressure.

This metric reveals how well your system performs under various load conditions, directly impacting its ability to serve your entire user base. For instance, major e-commerce platforms like Shopify must support over 80,000 requests per second during massive events like Black Friday flash sales. Similarly, a high-volume platform like Twitter processes an average of over 5,700 requests every second to handle the global stream of tweets.
Why Throughput Matters
Monitoring throughput is essential for capacity planning and ensuring system stability. A low throughput can mean your servers are under-provisioned, your code is inefficient, or a bottleneck exists somewhere in your stack, preventing your application from handling more users. Conversely, a sudden, unexpected drop in throughput can be an early warning sign of a critical failure in a server, database, or downstream service. It helps you answer the question: “Can our system handle the expected user load?”
Actionable Tips for Monitoring Throughput
Effectively tracking throughput requires looking beyond a single, aggregated number. It’s about understanding your application’s limits and behavior under real-world stress.
- Correlate with Response Time: Monitor throughput alongside response time for a complete performance picture. High throughput with low response time is the ideal state. If throughput increases but response time degrades sharply, you’ve likely found your system’s performance ceiling.
- Establish a Baseline: Measure and record your application’s throughput during normal operational periods. This baseline helps you immediately identify anomalies, such as a sudden traffic spike or a dip indicating a potential outage.
- Perform Load Testing: Don’t wait for real users to find your breaking point. Use traffic-capturing tools to perform regular load testing and determine maximum sustainable throughput. This helps you proactively scale your infrastructure before peak events.
- Segment Request Types: Not all requests are created equal. A simple API call to fetch static data has a different performance profile than a complex transaction involving multiple database writes. Segment throughput metrics by endpoint or transaction type to gain more granular insights.
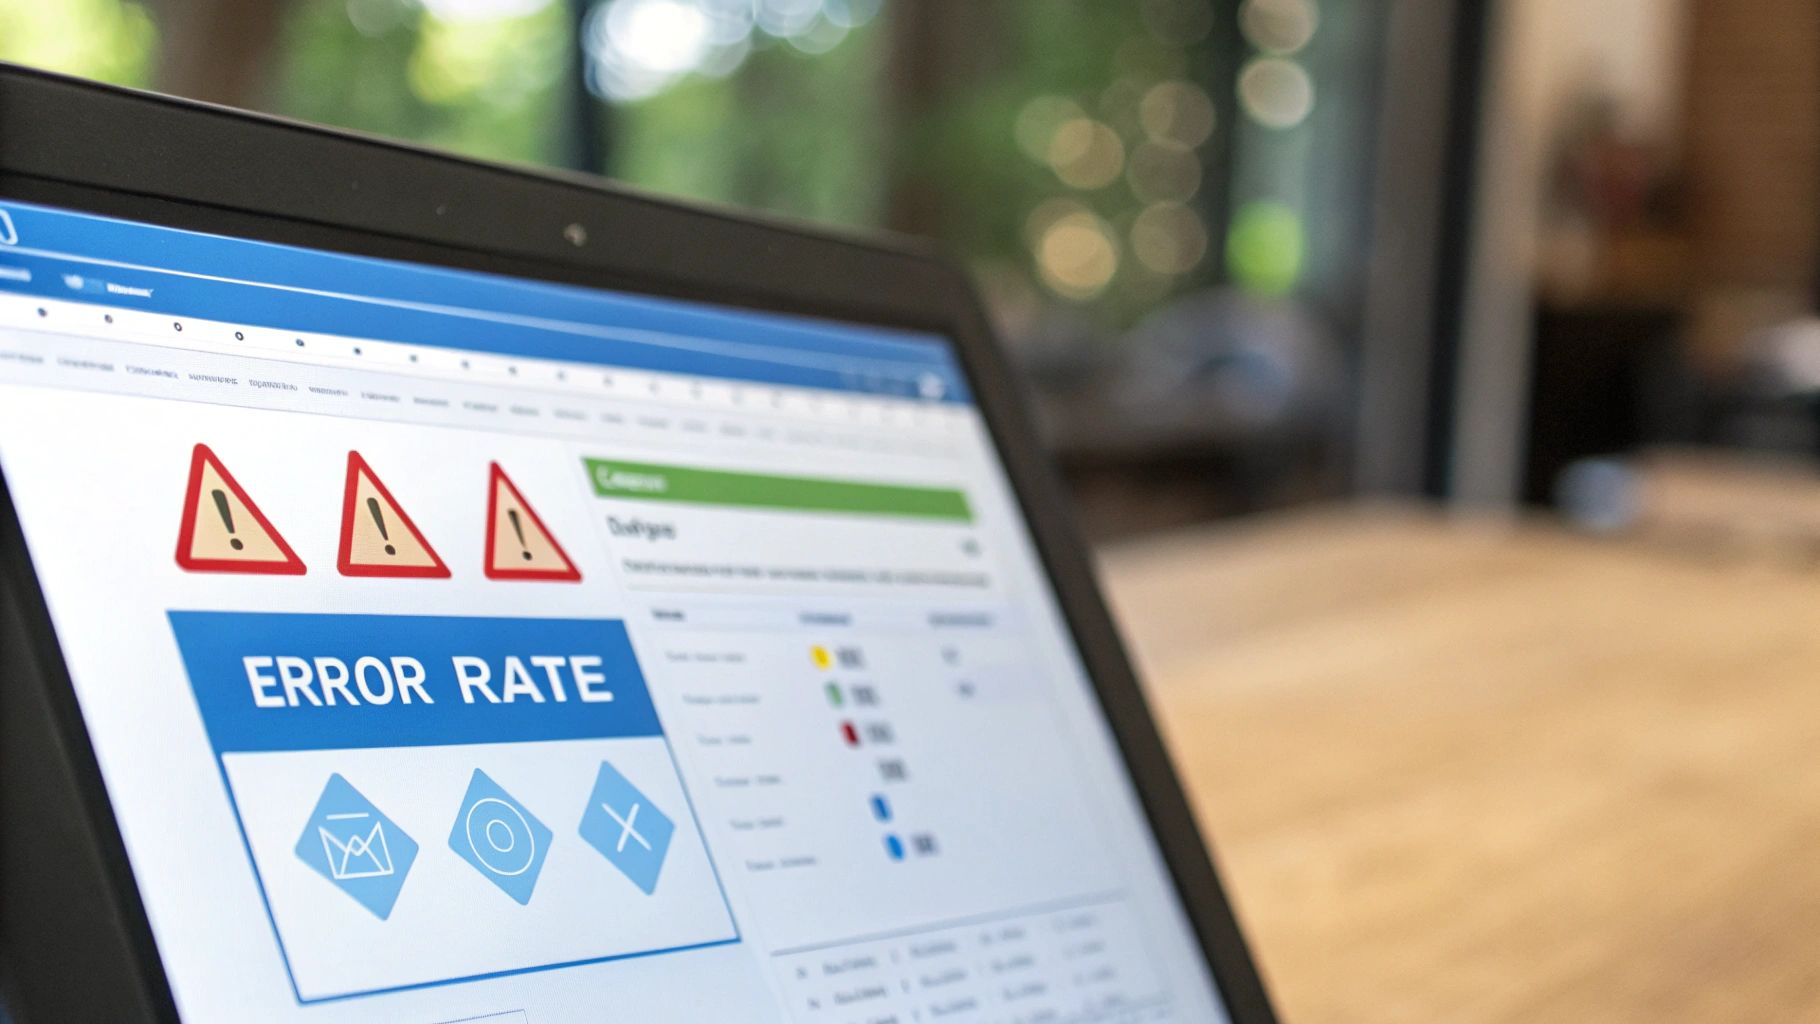
3. Error Rate
While response time measures how fast an application is, the error rate measures how reliable it is. This metric quantifies the percentage of failed requests or operations compared to the total number of requests over a specific period. It is a fundamental indicator of application stability and code quality. A low error rate is a prerequisite for a positive user experience; even a fast application is useless if it consistently fails to perform its core functions.
This metric is non-negotiable for services where reliability is paramount. For example, a financial platform like Stripe aims for error rates far below 0.01% to maintain trust and ensure transaction integrity. Similarly, a ride-sharing service like Uber monitors error rates in real-time to prevent service disruptions that could leave users stranded. A sudden spike in the error rate is often the first sign of a bad deployment, a failing dependency, or a critical infrastructure problem.
Why Error Rate Matters
Monitoring the error rate is crucial for maintaining application health and user trust. A high error rate directly translates to a poor user experience, leading to lost revenue, customer churn, and a damaged brand reputation. Tracking this metric helps teams proactively identify and fix bugs, configuration issues, and downstream service failures before they impact a significant number of users. It provides immediate feedback on the stability of new code releases and infrastructure changes. For a deeper understanding of how this ties into backend services, you can explore this essential guide to API monitoring.
Actionable Tips for Monitoring Error Rate
Simply counting errors is not enough. To get meaningful insights, you need a more sophisticated approach.
- Categorize and Prioritize: Not all errors are equal. Group errors by type (e.g., 404 vs. 500), severity, and impact. This allows you to prioritize fixing critical, user-facing bugs over minor, non-impactful warnings.
- Monitor Trends, Not Just Absolutes: A sudden increase in the error rate is a more significant signal than a steady, low-level count. Monitor the rate of change and set alerts for anomalous spikes to catch problems as they happen.
- Set Context-Aware Thresholds: A critical payment endpoint should have a much lower error tolerance (near zero) than a non-essential background job. Define distinct alert thresholds for different microservices or application components based on their business impact.
4. Apdex Score
While metrics like response time are crucial, they don’t always tell the full story of user experience. The Application Performance Index (Apdex) is an industry-standard metric that translates raw performance data into a simple, unified score of user satisfaction. It measures the ratio of satisfactory and tolerating response times to the total number of requests, providing a score from 0 (no users satisfied) to 1 (all users satisfied). This score categorizes user experiences into three zones: Satisfied, Tolerating, and Frustrated, based on a predefined response time threshold (T).

Popularized by the Apdex Alliance and widely adopted by monitoring tools like New Relic, this metric is used by large e-commerce platforms to measure checkout process satisfaction and by financial services firms to track trading platform responsiveness. It simplifies performance down to a single, understandable number that directly reflects how users perceive your application’s speed.
Why the Apdex Score Matters
The Apdex score provides a clear, business-relevant view of application performance. Instead of debating whether a 500ms or 800ms response time is “good,” Apdex gives you a standardized way to answer the question: “Are our users happy with our application’s performance?” A consistently high score (e.g., above 0.90) indicates excellent user satisfaction, while a declining score is an immediate red flag that performance issues are beginning to frustrate users, even before they start to complain. It is one of the most effective application performance monitoring metrics for communicating performance health to non-technical stakeholders.
Actionable Tips for Monitoring Apdex Score
To leverage Apdex effectively, you must configure it thoughtfully and use it as part of a broader monitoring strategy.
- Set Realistic Thresholds (T): The ‘T’ value is the core of Apdex. A login page might have a T value of 1 second, while a complex data report could be 5 seconds. Set these thresholds based on actual user expectations for each specific transaction.
- Monitor Trends, Not Just Scores: A single Apdex score is a snapshot. The real value comes from tracking the score’s trend over time. A gradual decline can reveal slow-burning issues that might otherwise go unnoticed.
- Segment Your Apdex Score: Don’t rely on a single, application-wide score. Segment Apdex by user type (e.g., free vs. premium), transaction type (e.g., search vs. checkout), or browser to pinpoint exactly where user frustration is highest.
5. CPU Utilization
CPU utilization is a fundamental infrastructure metric that measures the percentage of time a server’s central processing unit (CPU) is actively executing processes rather than being idle. As one of the core application performance monitoring metrics, it provides a direct view into the workload of your hardware. High utilization can indicate that your application is resource-intensive or that the server is nearing its capacity limit, while low utilization might suggest over-provisioning.
This metric is critical for balancing performance and cost. For instance, major cloud services like AWS and Google Cloud’s internal systems operate at high, but controlled, CPU utilization to maximize hardware efficiency and reduce operational costs. Netflix famously engineers its services to run at a sustained high CPU load (around 70-80%) to ensure they are getting the most value from their compute instances without compromising stability.
Why CPU Utilization Matters
Monitoring CPU utilization is essential for capacity planning and identifying performance bottlenecks at the infrastructure level. A server constantly running at 95-100% CPU capacity has no headroom for traffic spikes or new processes, leading to increased response times, request queuing, and potential system crashes. Sustained high CPU usage is often a symptom of inefficient code, unoptimized database queries, or simply insufficient hardware resources for the application’s demand. It serves as an early warning system before a resource crunch impacts end-users.
Actionable Tips for Monitoring CPU Utilization
Effective monitoring goes beyond just looking at the overall percentage; it requires context and a deeper analysis.
- Correlate with Application Metrics: A spike in CPU utilization means little on its own. Correlate it with metrics like response time and error rate. If CPU usage increases but performance remains stable, it might be acceptable. If it directly corresponds to a slowdown, you have a clear issue to investigate.
- Set Sustained High-Usage Alerts: Instantaneous spikes are often normal. The real danger lies in prolonged high usage. Set alerts for when CPU utilization exceeds a threshold like 80% for a sustained period (e.g., more than five minutes) to catch real problems without being spammed by false alarms.
- Monitor CPU Steal Time: In virtualized or cloud environments, “steal time” is the percentage of time a virtual CPU waits for a real CPU, while the hypervisor is servicing another virtual processor. High steal time means your instance isn’t getting the CPU cycles it needs and is a strong indicator of a “noisy neighbor” problem on a shared host.
6. Memory Usage
Memory usage is a foundational application performance monitoring metric that tracks the amount of physical memory (RAM) an application consumes. This includes all aspects of memory allocation, from the application’s main process to heap memory for dynamic objects, stack memory for function calls, and various buffers. Proper memory management is the bedrock of a stable application; excessive consumption or inefficient allocation can lead to slowdowns, out-of-memory errors, and catastrophic crashes that bring services to a halt.
This metric is vital for resource-intensive platforms. For instance, Java applications at LinkedIn meticulously monitor heap usage to preempt OutOfMemoryError exceptions that could disrupt professional networking services. Similarly, Spotify’s streaming clients and backend services are carefully monitored for memory usage to ensure a smooth, uninterrupted listening experience for millions of users, where even a small memory leak could have a massive cumulative impact.
Why Memory Usage Matters
Monitoring memory usage is crucial for preventing performance degradation and ensuring application stability. A slow, creeping increase in memory consumption over time, known as a memory leak, can eventually exhaust all available resources and crash the application or even the host server. By tracking this metric, teams can identify inefficient code, optimize resource allocation, and plan for capacity, ensuring the application remains responsive and reliable under load. It’s a direct indicator of an application’s resource efficiency and long-term health.
Actionable Tips for Monitoring Memory Usage
Effective memory monitoring goes beyond simply checking the total RAM used. It requires a more nuanced approach to identify specific problems.
- Track Memory Growth Trends: Don’t just look at the current value. Monitor memory usage over hours and days to spot gradual increases. A sawtooth pattern is often normal due to garbage collection, but a consistently rising floor indicates a potential memory leak.
- Set High-Watermark Alerts: Configure alerts to trigger when memory consumption exceeds a critical threshold, such as 85% of the allocated amount. This gives your team a chance to intervene before an out-of-memory event occurs.
- Analyze Garbage Collection (GC): In managed runtimes like the JVM or .NET, track the frequency and duration of GC events. Frequent or long-running GC cycles are a strong sign of memory pressure and can significantly impact application performance.
- Use Memory Profilers: For deep-dive analysis, use memory profiling tools. These tools can provide a snapshot of the heap, allowing you to see exactly which objects are consuming the most memory and help pinpoint the source of leaks.
7. Database Query Performance
For many applications, the database is the central nervous system, and its health is directly tied to overall performance. Database query performance measures the speed, efficiency, and reliability of your database operations. This includes critical metrics like query execution time, throughput (queries per second), and the identification of slow queries. Since a poorly performing database is a common bottleneck, closely monitoring these specific application performance monitoring metrics is non-negotiable for maintaining a responsive and scalable service.
The performance of your database directly impacts the user-facing response time. For example, a platform like Airbnb must execute complex queries instantly to filter millions of listings, while Slack relies on rapid database operations to deliver real-time messages without perceptible delay. A single slow query can have a cascading effect, holding up application threads and degrading the experience for numerous users simultaneously.
Why Database Query Performance Matters
Monitoring database performance is crucial because it often reveals the root cause of application slowness. A slow API endpoint might not be due to inefficient application code but rather an unoptimized database query it triggers. Tracking these metrics helps you proactively identify inefficient queries, missing indexes, and connection pool issues before they lead to major outages. This insight is essential for maintaining application responsiveness, ensuring data integrity, and scaling your infrastructure effectively.
Actionable Tips for Monitoring Database Query Performance
To gain a clear picture of your database health, you need to go beyond surface-level server metrics and dive into the queries themselves.
- Identify Slow and Frequent Queries: Use your APM tool or database’s native monitoring to create a “top N” list of the slowest and most frequently executed queries. Optimizing these high-impact queries will yield the most significant performance improvements.
- Monitor Connection Pool Health: An exhausted connection pool can bring your application to a standstill. Track the number of active versus idle connections and set alerts for high utilization to prevent connection timeouts and failures.
- Track Lock Waits and Deadlocks: In high-concurrency environments, database locks can cause significant delays. Monitor lock wait times and track the occurrence of deadlocks, which happen when two or more transactions are permanently blocked, each waiting for the other to release a resource.
8. Application Availability (Uptime)
Application availability, often called uptime, is one of the most foundational application performance monitoring metrics. It measures the percentage of time your application is operational and accessible to end-users over a defined period. This metric is the bedrock of Service Level Agreements (SLAs) and directly impacts user trust, business revenue, and brand credibility. If an application isn’t available, no other performance metric matters.
This metric is a direct promise to your customers. For instance, major cloud providers build their reputations on high availability guarantees. Google Cloud Platform offers a 99.95% uptime SLA for most services, while Salesforce publicly maintains its commitment to 99.9% availability for its customers. These percentages are not just numbers; they represent a core business commitment.
Why Application Availability Matters
Monitoring availability is critical because it represents the most basic user expectation: that the service will work when they need it. Unplanned downtime can lead to immediate revenue loss, customer churn, and significant damage to your market reputation. Consistent high availability builds user confidence and is a key competitive differentiator. Tracking availability isn’t just about measuring success; it’s about managing failure by understanding the frequency and duration of outages to improve system resilience.
Actionable Tips for Monitoring Application Availability
Effectively tracking uptime requires a multi-faceted approach that goes beyond a simple “is it on?” check.
- Monitor from Multiple Locations: Use distributed monitoring probes to check availability from different geographic regions. This helps differentiate between a true global outage and a regional network issue, ensuring you get an accurate picture of what real users are experiencing.
- Define ‘Available’ Clearly: An application might respond to a basic ping but fail on a critical function like user login. Define clear criteria for availability that include synthetic transaction monitoring, which simulates key user workflows to confirm that core features are operational.
- Track Recovery Metrics: Don’t just track uptime. Monitor Mean Time to Detection (MTTD) and Mean Time to Recovery (MTTR). Reducing the time it takes to find and fix an outage is just as important as preventing one in the first place.
Key Metrics Comparison for Application Performance Monitoring
| Metric | Implementation Complexity 🔄 | Resource Requirements ⚡ | Expected Outcomes 📊 | Ideal Use Cases 💡 | Key Advantages ⭐ |
|---|---|---|---|---|---|
| Response Time | Moderate – requires end-to-end tracking and breakdown of delays | Moderate – monitoring tools for client/server/network | Direct measure of user experience responsiveness | User-facing applications where latency impacts satisfaction | Clear indicator of overall performance, easy to communicate |
| Throughput (Requests Per Second) | Moderate to High – needs load testing and multi-layer measurement | High – requires infrastructure to measure many requests accurately | Indicates system capacity and scalability under load | High-traffic systems needing capacity planning and scalability | Shows maximum supported load, useful for bottleneck identification |
| Error Rate | Low to Moderate – error logging and classification required | Low – mainly logging and monitoring setup | Measures reliability and stability of the system | Critical systems needing SLA compliance and error prioritization | Direct indicator of health, enables proactive incident response |
| Apdex Score | Moderate – needs configuration of thresholds and aggregation logic | Low to Moderate – requires response time data and scoring algorithm | Translates performance into user satisfaction score | Businesses needing user-centric performance reporting | Combines complex data into simple, business-relevant metric |
| CPU Utilization | Low – uses standard OS/hardware metrics per system | Low – utilizes existing system monitoring tools | Shows resource utilization and potential bottlenecks | Infrastructure and capacity planning, performance tuning | Easy to monitor, helps identify over/under-provisioning |
| Memory Usage | Moderate – tracks multiple memory types, may need profiling tools | Moderate – profiling and monitoring required for detailed data | Prevents crashes and optimizes resource allocation | Applications with heavy memory consumption and leak risks | Identifies leaks early, essential for stability and cost control |
| Database Query Performance | High – requires DB-specific tools and query analysis expertise | High – specialized monitoring and tuning resources | Optimizes database responsiveness and throughput | Data-intensive applications dependent on DB performance | Pinpoints slow queries, enables targeted optimization |
| Application Availability (Uptime) | Low – simple percentage calculation, requires comprehensive monitoring | Low to Moderate – distributed monitoring for accuracy | Measures overall service reliability and user access | SLA measurement, business continuity, customer trust | Clear business impact metric, essential for SLA compliance |
Transforming Metrics into Action: Your Path to Peak Performance
We’ve journeyed through the eight pillars of application health, from the user-facing immediacy of Response Time and Apdex to the foundational stability signaled by CPU Utilization and Memory Usage. Each of these core application performance monitoring metrics provides a unique lens through which to view your system’s behavior. Understanding them individually is the first step, but true mastery lies in synthesizing their collective story.
Seeing a high Error Rate alongside a spike in CPU Utilization tells a different story than an Error Rate spike alone. Similarly, a declining Apdex score might be your first clue to investigate subtle increases in Database Query Performance latency. It is this interconnectedness that transforms raw data into a narrative of your application’s real-time operational health. Isolated numbers are just noise; correlated insights are your roadmap to resolution.
From Reactive Monitoring to Proactive Optimization
The ultimate goal is to move beyond simply watching dashboards and reacting to fires. The real power comes from embedding these metrics into the very fabric of your development and deployment lifecycle. This proactive stance is built on three key actions:
- Establish Performance Budgets: Don’t just track metrics, define clear, non-negotiable thresholds for them. A performance budget might state that your p95 Response Time must remain under 400ms or your Error Rate must never exceed 0.1%. This turns performance into a feature, just as critical as any other business requirement.
- Implement Intelligent Alerting: Configure alerts that are not just noisy but context-aware. An alert for high Memory Usage is useful, but an alert that triggers only when high memory correlates with increased response times for critical endpoints is far more actionable. This reduces alert fatigue and focuses your team on issues that directly impact users.
- Create a Culture of Performance: Share performance dashboards widely. Discuss Apdex scores in sprint retrospectives. When performance is a shared responsibility, from developers to product owners, the entire team becomes invested in building fast, reliable, and resilient software.
The Bridge Between Knowing and Doing
Ultimately, these application performance monitoring metrics are your guide, but proactive testing is your vehicle for improvement. You can’t afford to wait until code hits production to see how it impacts performance. This is where a strategy of capturing and replaying real-world traffic becomes a game-changer. By safely simulating production load in a staging environment, you can validate the impact of every change against your key metrics before deployment. This vital step bridges the gap between monitoring and prevention, allowing you to innovate with confidence. By weaving these metrics and proactive testing practices into your daily workflows, you elevate performance from a technical chore to a powerful strategic advantage that drives user satisfaction and achieves business goals.
Ready to stop guessing and start testing with real traffic? GoReplay allows you to capture and replay your production user traffic in a staging environment, giving you the power to rigorously test how your changes affect these critical application performance monitoring metrics before they go live. Discover how to build more resilient applications by visiting GoReplay today.