Why Application Performance Metrics Matter More Than Ever
Think of your application’s performance metrics as its vital signs. Just like a doctor uses heart rate and blood pressure to assess a patient’s health, you need metrics to understand how your application is performing. Many teams, however, treat these metrics as a technical checklist item, not a source of valuable business insight. In reality, these numbers tell a story about every user interaction, revealing areas for improvement and potential problems.
This shift in perspective is critical. Are your users enjoying a smooth experience, or are they frustrated by slow loading times? Are transactions processing seamlessly, or are errors impacting sales? Performance metrics provide the answers. They highlight your application’s strengths and pinpoint areas needing attention. Forward-thinking engineering teams are moving away from reactive problem-solving and embracing a proactive approach that anticipates and prevents issues before users even notice.
From Reactive to Proactive: Using Metrics to Drive Success
The most effective teams use performance metrics not just for troubleshooting, but for strategic decision-making. They analyze trends, identify patterns, and predict potential problems. This proactive approach leads to a better user experience, higher customer satisfaction, and a healthier bottom line. Companies that prioritize and understand application performance metrics often outperform their competitors, gaining a significant advantage in today’s demanding market. It’s not just about keeping the system running; it’s about optimizing for peak performance and building a better product.
The growing importance of these metrics is reflected in the rapid growth of the application performance monitoring (APM) market. Fueled by the increasing complexity of IT systems, this market has seen remarkable expansion. From 2023–2024, the market was valued at approximately $9.66 billion and is projected to reach $17.71 billion by 2029, demonstrating a 13.2% CAGR. Discover more insights into the APM market. This significant growth highlights the increasing recognition of the vital role performance metrics play in business success. By understanding these metrics, you’re not just collecting data; you’re gaining valuable insights that can transform your application from a functional tool into a powerful driver of growth.
The Essential Metrics That Actually Tell Your Story
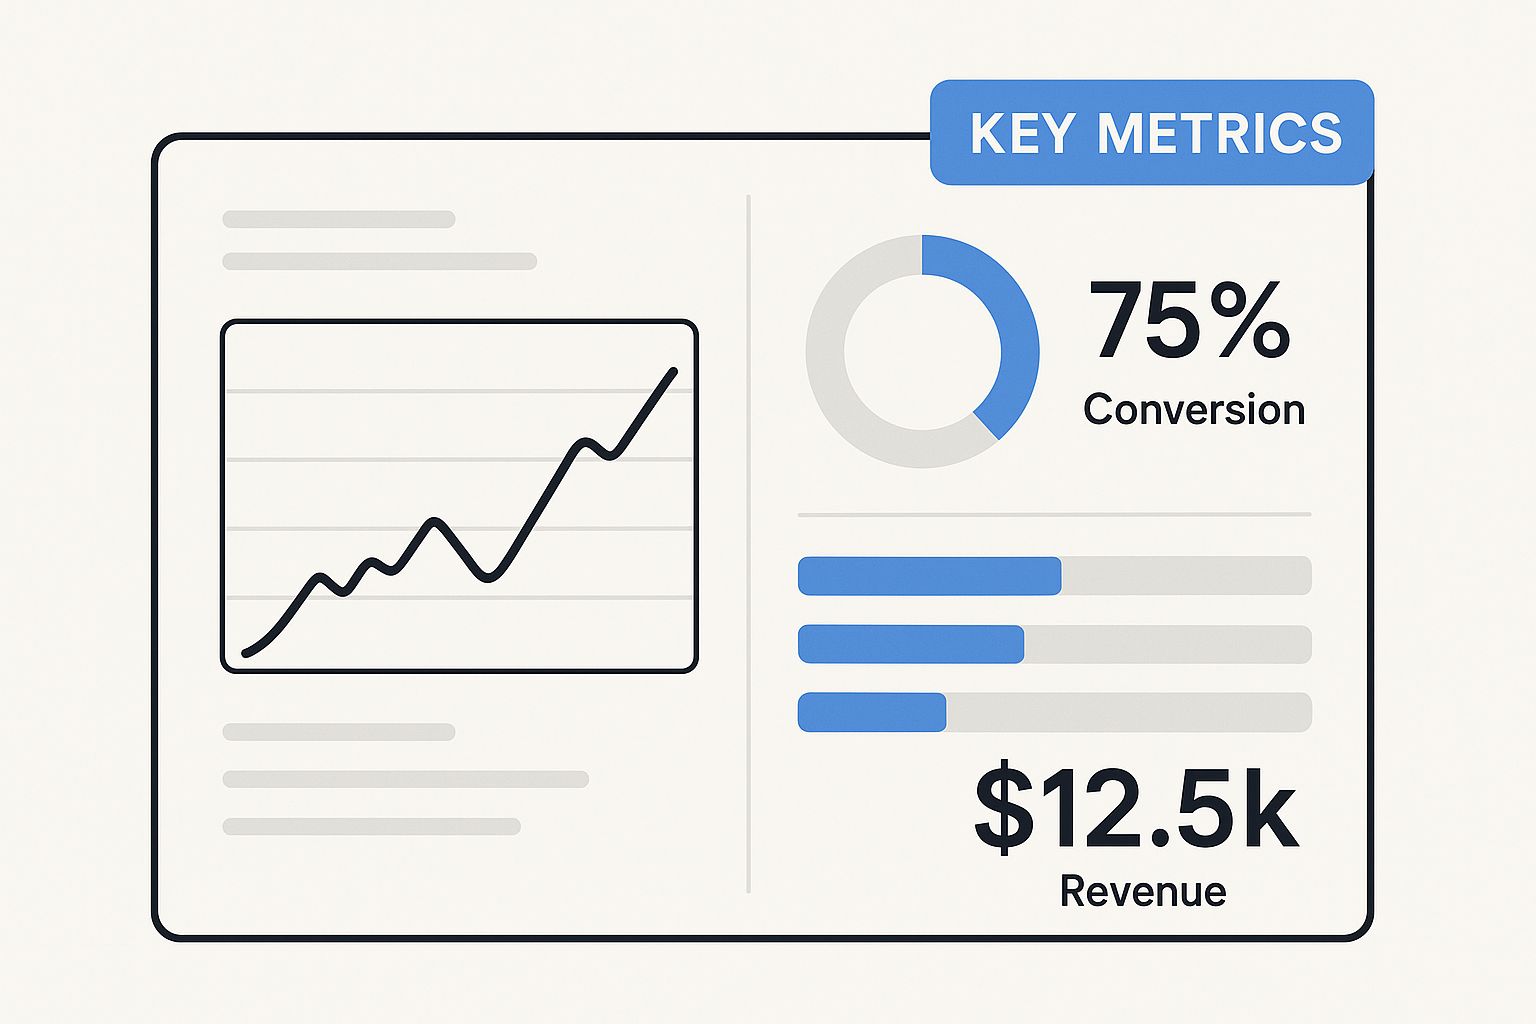
The infographic above shows a modern dashboard displaying key application performance metrics. Notice how the clean design makes it easy to spot potential problems, visualizing metrics like response time, error rate, and throughput. These core metrics offer a snapshot of your application’s health.
But with so many metrics available, which ones truly matter?
Key Performance Indicators: More Than Just Numbers
While many metrics exist, some offer more valuable insights. Response time, for instance, tells you how quickly your application reacts to user requests. Think of it like a conversation – a slow response can lead to frustration. In the digital world, that translates to lost customers. Throughput, on the other hand, measures the amount of data your application processes over a specific time. Can your application handle a surge in users during a flash sale? Throughput tells you that. Finally, error rate tracks how often errors pop up in your application. A high error rate is a warning sign of underlying issues needing immediate attention. You might be interested in: boosting application performance with load testing.
To help visualize the importance and impact of these metrics, let’s explore a comparison table. This table summarizes the key performance metrics, outlines healthy ranges, flags potential warning signs, and illustrates the impact on your business.
Core Application Performance Metrics Comparison
| Metric Type | What It Measures | Good Range | Warning Signs | Business Impact |
|---|---|---|---|---|
| Response Time | How quickly the application responds to user requests | < 500ms (generally, but varies by application) | > 2 seconds consistently | Frustrated users, abandoned transactions, negative reviews |
| Throughput | Volume of data processed over a period | Depends on application requirements; consistent and predictable is key | Sudden drops or inability to handle peak loads | Inability to serve users, lost revenue, reputational damage |
| Error Rate | Frequency of errors in the application | < 1% | > 5% consistently | Application instability, data corruption, security vulnerabilities |
As you can see, maintaining these metrics within acceptable ranges is crucial for a healthy application and a positive user experience. Ignoring warning signs can have significant consequences for your business.
The Interplay of Metrics: Connecting the Dots
These core metrics aren’t isolated. They’re intertwined, like threads in a tapestry. Understanding their relationships gives you a deeper understanding of your application’s behavior. Imagine a sudden jump in error rate, coupled with a drop in throughput and a slower response time. This could point to a server struggling under pressure or a database bottleneck. By connecting these dots, you can quickly pinpoint the root cause of performance hiccups.
Tracking trends over time helps you anticipate problems before they impact your users. This proactive approach is essential for maintaining a high-performing, reliable application.
Turning Data into Action: Metrics in Practice
Ultimately, metrics are only useful if they lead to improvements. Setting clear goals and tracking progress transforms raw data into actionable insights. Perhaps you need to optimize your code, beef up your infrastructure, or implement caching strategies. The goal is to continuously improve your application’s performance and deliver a better user experience, benefitting your users and boosting your bottom line.
Navigating The Modern Monitoring Landscape
The world of application monitoring has changed drastically. Remember the days when a simple “is it up?” check was enough? Those days are long gone. Today’s applications live in a complex web of microservices, cloud platforms, and interconnected systems. Each connection point represents a potential failure point.
This complexity can feel daunting, but it also unlocks a powerful opportunity. Teams that embrace this new reality gain a level of insight into their applications they never thought possible.
Beyond Traditional Monitoring: Embracing Observability
Traditional monitoring tools struggle in this environment. They were built for simpler times, for monolithic applications, not the distributed systems of today. That’s where observability comes in.
Observability isn’t just about collecting metrics. It’s about understanding the internal state of a system by examining the data it produces: metrics, logs, and traces. This comprehensive view is crucial for navigating the complexities of modern architectures.
Think of it like this: imagine one small microservice slowing down and impacting another service further down the line. Observability gives you the context to connect these seemingly unrelated events.
AI-Powered Analytics: The Next Frontier
Modern applications generate massive amounts of data – far too much for humans to analyze effectively. AI-powered analytics are becoming essential for sifting through this data, spotting anomalies, and predicting potential issues.
This allows teams to move from reactive problem-solving to proactive optimization. Instead of fighting fires, they can prevent them. This shift is critical for staying competitive.
The market for these technologies is booming. Studies show the app analytics market is projected to reach $48.06 billion by 2033, growing at a CAGR of 21.2% from 2025-2033. This growth reflects the increasing need for user insights and digital marketing optimization, which are closely tied to application performance. Discover more insights into the App Analytics Market.
Performance Monitoring: A Competitive Advantage
Leading organizations now understand that performance monitoring isn’t just a cost of doing business; it’s a strategic investment. They see application performance metrics not as technical details, but as a source of competitive advantage.
By understanding how performance impacts user experience and business outcomes, these organizations can make better decisions, innovate faster, and deliver exceptional value. This data-driven approach to performance management is key to succeeding in today’s dynamic market.
Practical Measurement Strategies That Actually Work
Let’s face it, many teams are awash in data, yet struggle to extract meaningful insights. The real magic isn’t about gathering more application performance metrics, it’s about focusing on the right ones and understanding how to use them effectively. Imagine a toolbox overflowing with every tool imaginable, but you’re unsure which one to use for a specific task. Frustration mounts, and the project stalls. Similarly, collecting every possible metric without a clear objective leads to confusion, not clarity. A focused approach is essential: select the metrics that truly tell the story of your application’s performance, and use them to drive positive change.
Establishing Meaningful Baselines: Your Starting Point
Before embarking on any improvement journey, you need to understand your current position. Baselines provide that essential foundation. They represent the typical operating conditions of your application. Think of it like taking your application’s resting heart rate. This provides a valuable reference point for comparison when conditions change. For example, if response times usually hover around 200ms, and suddenly jump to 2 seconds, you have a clear indication that something’s amiss. Establishing baselines for key metrics like response time, error rate, and throughput allows you to quickly identify deviations and investigate potential problems.
Setting Realistic Targets: Aiming for Improvement
Baselines are invaluable, but they’re just the starting point. You also need to define realistic targets to strive towards. These targets shouldn’t be arbitrary numbers pulled out of thin air. They should be aligned with your business goals and user expectations. For instance, if your objective is to enhance user engagement, you might aim for a 10% reduction in page load time. Setting achievable targets motivates the team and offers a clear roadmap for improvement.
Building a Measurement Framework: Connecting the Dots
The most effective teams don’t just collect metrics; they create a measurement framework. This framework links individual metrics to business outcomes. For example, how does a 1% decrease in error rate impact customer satisfaction or revenue? By making these connections, you can demonstrate the value of performance enhancements to stakeholders and justify investment in optimization initiatives. This holistic perspective transforms raw data into actionable insights that guide business decisions.
The screenshot above showcases a Grafana dashboard, a popular tool for visualizing application performance metrics. Observe how it clearly presents key metrics like CPU usage, memory usage, and request rate. These visualizations simplify the process of identifying trends and spotting anomalies. By analyzing this data, teams can rapidly pinpoint performance bottlenecks and investigate potential issues. This clear visual representation empowers teams to take proactive steps and optimize their application’s performance.
This practical approach to measurement—establishing baselines, setting targets, and building a framework—empowers teams to go beyond simple data collection and truly grasp their application’s performance narrative. This understanding forms the bedrock for continuous improvement and delivering a superior user experience.
Real-World Implementation With GoReplay Examples
Theory is a great starting point, but putting these performance metrics into practice is where things get interesting. Let’s use GoReplay as our real-world example to see how application performance metrics translate into tangible improvements. GoReplay’s talent for capturing and replaying live HTTP traffic is like having a performance time machine – we can see how our application performs under real-world conditions and test changes without affecting live users.
Capturing Baseline Data With GoReplay
Just like a pit crew wouldn’t tune a race car without knowing its current lap time, we need a baseline before we start optimizing. GoReplay makes capturing this baseline surprisingly easy. It captures your application’s current traffic, creating a snapshot of its performance under normal conditions. Think of it as a performance fingerprint. This captured traffic then becomes your benchmark for measuring the impact of any changes you make. This recorded traffic provides valuable insights into your application’s typical behavior under load.
The screenshot above from the GoReplay website shows just how simple its interface is. The commands for capturing and replaying traffic are straightforward, making it easy for developers of any experience level to incorporate performance testing into their workflow.
Analyzing Traffic Patterns and Simulating Scenarios
With a baseline in hand, GoReplay lets you analyze your traffic patterns. This is like studying the telemetry data from our race car – speed, braking, cornering – to pinpoint areas for improvement. The real magic of GoReplay lies in its ability to replay captured traffic under different conditions. Imagine simulating a sudden surge in users, or a period of network latency, and seeing exactly how these scenarios impact your application performance metrics, like response time and error rate. It’s a safe, controlled environment for experimentation and identifying bottlenecks.
Interestingly, the market for application metrics and monitoring tools is booming. Expected to reach $37.78 billion by 2035, with a CAGR of 11.3%, this growth underscores how crucial performance optimization has become. In fact, over 70% of enterprises now actively use real-time application performance monitoring to catch problems before they impact users. Explore the growing market for application performance monitoring tools.
Validating Performance Improvements Before Going Live
GoReplay allows you to test performance improvements in a safe, controlled environment before they go live. This is like testing our modified race car on a practice track before the actual race. By replaying the captured traffic against your updated application, you can see if your changes have the desired effect. This reduces the risk of introducing new performance problems and builds confidence in your optimizations. This proactive approach minimizes disruptions and helps ensure a smooth user experience. With GoReplay, you’re not just collecting numbers, but gaining actionable insights that lead to real improvements in application performance and user satisfaction.
Advanced Techniques That Give You The Complete Picture

Want to truly master application performance? While basic metrics offer a starting point, the real magic happens when you embrace advanced techniques. These methods unlock a deeper understanding of your application’s performance and how your users actually experience it.
Distributed Tracing: Following the Request’s Journey
Think of a complex dish with dozens of ingredients. Distributed tracing helps you follow each ingredient’s path from the pantry to the plate, just like tracking a user request as it travels through your application’s different services. This creates a detailed map, exposing performance bottlenecks and showing how services interact. For example, if a user transaction slows to a crawl, distributed tracing can pinpoint the exact service causing the delay.
Let’s say a user is trying to buy a product on your e-commerce site. Distributed tracing allows you to see the request’s journey through inventory, payment gateway, and shipping services. If there’s a delay, you’ll know precisely which service is the culprit.
Synthetic Monitoring: A Dress Rehearsal for Your Application
Imagine a theater production. Before the curtains rise, actors do a dress rehearsal. Synthetic monitoring is like that—it’s a practice run for your application. You simulate user actions, like logging in or adding items to a cart, to identify and fix potential problems before real users encounter them. This proactive approach helps ensure a smooth and efficient user experience.
Regular synthetic monitoring might reveal that your login process slows down during peak hours, giving you time to optimize it before impacting real users.
Real User Monitoring (RUM): Seeing Through Your Users’ Eyes
Ever wish you could see your application exactly as your users see it? Real User Monitoring (RUM) makes that possible. It captures performance data directly from user interactions, revealing how your application performs across different devices, browsers, and network conditions. This real-world insight helps pinpoint friction points that lab testing might miss.
RUM might reveal that users with older phones on slower networks experience significant lag, leading you to optimize your app for those specific conditions.
Combining Metrics, Logs, and Traces: The Power of Observability
Modern application performance metrics platforms don’t just show numbers. They combine metrics, logs, and traces to give you a complete picture. Metrics show what is happening (like slow response times). Logs explain why it’s happening (maybe a database query timed out). Traces reveal where it’s happening (in a specific service). This powerful combination allows you to understand your application’s behavior deeply and resolve issues quickly. For a more detailed look at performance testing metrics, check out this guide on essential performance testing metrics.
This multifaceted approach is like having a detective’s toolkit for your application. It provides the clues you need to solve performance mysteries efficiently.
To illustrate the evolution of monitoring, let’s take a look at a comparison table:
To better understand the differences between traditional and advanced monitoring techniques, let’s examine the following table:
Traditional vs. Advanced Monitoring Approaches
| Monitoring Approach | Data Sources | Insight Level | Use Cases | Implementation Complexity |
|---|---|---|---|---|
| Basic Metrics | Server CPU, memory, disk usage | System-level resource utilization | Identifying resource bottlenecks | Low |
| Log Analysis | Application logs | Error detection and troubleshooting | Diagnosing application issues | Medium |
| Advanced Metrics | Response times, error rates, request throughput | Application performance trends | Tracking application health | Medium |
| Distributed Tracing | Request traces across services | Understanding request flows and dependencies | Identifying performance bottlenecks in distributed systems | High |
| Real User Monitoring (RUM) | User interactions, browser performance | Actual user experience | Optimizing user journeys | Medium |
| Synthetic Monitoring | Simulated user interactions | Proactive performance testing | Validating application performance under different scenarios | Medium |
This table shows how monitoring has evolved from basic system checks to a more comprehensive approach that considers the entire user journey and the interplay between different services.
Intelligent Alerting and Machine Learning: From Reactive to Proactive
Instead of reacting to problems after they occur, tools like intelligent alerting and machine learning empower you to be proactive. These technologies can automatically spot unusual behavior and potential problems before they impact your users. This reduces downtime and improves overall user experience. For instance, machine learning can analyze historical performance data to predict future bottlenecks, giving you the opportunity to take preventative action. These advances elevate application performance metrics from simple data points to strategic insights, allowing you to create an outstanding user experience.
Imagine your application as a car. Instead of waiting for the engine to fail, these advanced tools act like predictive maintenance, alerting you to potential problems and helping you prevent breakdowns.
Building A Culture That Actually Cares About Performance
Having top-notch monitoring tools won’t get you far if your team doesn’t understand them. Truly effective organizations build a culture that values performance insights. They don’t just collect data; they act on it.
Making Performance Metrics Accessible to Everyone
Application performance metrics shouldn’t be a secret language spoken only by engineers. Everyone, from product managers to the marketing team, should grasp how performance affects the bottom line. Imagine marketing launching a huge campaign without knowing the application’s limits. Disaster waiting to happen, right? Transparency is key. Make performance data easily accessible and understandable for everyone.
Fostering Shared Accountability
Performance is a team sport. Developers, operations, and business stakeholders all contribute. Foster a sense of shared responsibility. When everyone feels accountable, performance becomes a priority, not an afterthought. This shared ownership encourages collaboration on optimization. Regularly share performance data and discuss how it connects with business goals.
Integrating Performance into the Development Workflow
Thinking about performance shouldn’t be something you tack on at the end. Integrate it into every step of development. This doesn’t mean endless meetings; it means encouraging developers to consider performance from the get-go. Just like we build security into the development process, performance needs to be a core element.
Dashboards That Drive Action
Dashboards should provide clear, actionable information, not a sea of confusing numbers. Focus on the metrics that truly matter for your business objectives. A dashboard crammed with every data point is overwhelming, like a doctor trying to diagnose a patient with hundreds of readings. Keep it simple. Prioritize key application performance metrics that actually inform decision-making.
Continuous Improvement Through Feedback Loops
Establish a feedback loop where performance insights drive ongoing improvement. Regularly review your data, identify areas for optimization, and implement changes. Then, track the impact and refine. This continuous feedback loop transforms performance monitoring from passive observation into active optimization. By turning insights into action, you create a cycle of continuous improvement.
This cultural shift transforms application performance monitoring from a technical requirement into a core value. It’s what fuels innovation and keeps users happy. Learn how GoReplay can help you build this culture of performance within your organization.