Application Performance Improvement with GoReplay
Let’s be honest—synthetic load tests just don’t cut it. They almost always miss the mark, which is why so many performance bugs sneak past staging and right into production. This is where using real-world traffic becomes your secret weapon for genuine application performance improvement.
The Problem with Traditional Performance Testing
For years, we’ve all relied on synthetic load testing tools to see if our applications are ready for prime time. You know the drill: write a script that follows a “typical” user journey, fire it at a test server, and check the response times. It’s a decent way to find obvious breaking points, but this approach has a massive blind spot: it isn’t real.
Real users are unpredictable. They are chaotic. They click things out of order, abandon carts halfway through a purchase, and hit obscure API calls you’d never even think to script. This “long tail” of user behavior is exactly where the most frustrating performance bottlenecks love to hide. Your scripted tests might give you the green light, but your actual users are still stuck dealing with lag and errors.
The Gap Between Simulation and Reality
The disconnect happens because simulated traffic can’t possibly replicate the sheer randomness and concurrency of a live environment. A standard load test might throw 1,000 identical requests at an endpoint, but that’s nothing like 1,000 different users all doing different things across your entire application at the same time.
This is precisely why a tool like GoReplay, which captures and replays actual production traffic, is so powerful. It closes that gap.
The core issue is that scripted tests validate what you think will happen. Replaying real traffic validates what is actually happening, uncovering the unknown unknowns in your system’s performance.
This is what it looks like in action. GoReplay sits there, capturing live user interactions that you can then use for analysis and replay.
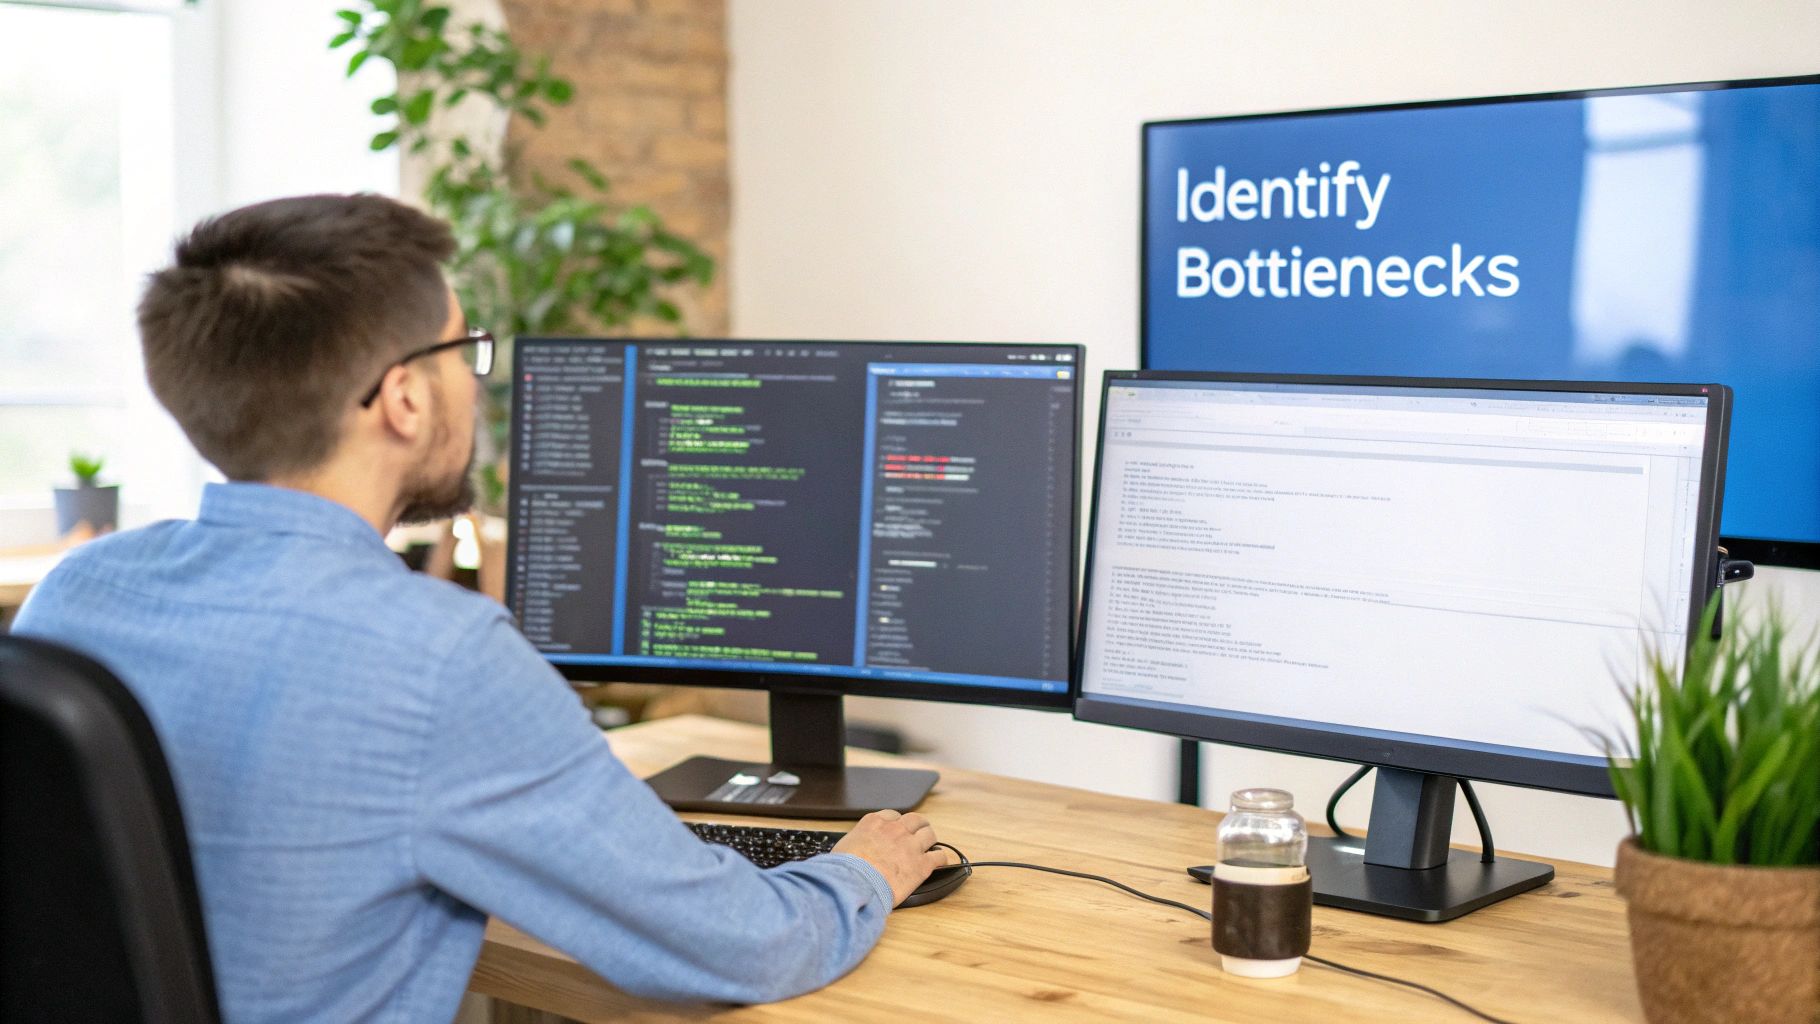
The real value here is moving past simple simulations and into data-driven validation. You’re no longer guessing. And with modern tech, this approach is becoming even more essential.
Take Artificial Intelligence (AI), for instance. The process is getting smarter. AI-powered Real User Monitoring (RUM) can now sift through huge amounts of interaction data to spot tiny performance dips—like slowing page loads in a specific region during peak hours—before users even complain. In fact, many analysts predict that AI will be at the heart of most performance frameworks by 2025, pushing the industry from reactive fixes to proactive, intelligent management. You can find more great insights on AI’s growing role over at uxify.com.
Capturing Live Traffic Safely with GoReplay
Alright, let’s move from theory to practice and start capturing traffic from your live production server. The idea might sound a little nerve-wracking, but GoReplay is engineered from the ground up to be a passive listener. It simply monitors network packets without getting in the way of your application’s normal request-response cycle.
That means zero added latency to your live service.
First things first, you need to know which network interface and port your application is using. Getting this right is critical to ensure you’re actually capturing the traffic you care about. If your app is running on port 8080, for example, that’s where you’ll point GoReplay.
To get started, here’s the basic command for capturing HTTP traffic and saving it to a file. This tells GoReplay to listen on port 8080 and write every request it sees into a file named traffic.gor.
sudo goreplay —input-raw :8080 —output-file traffic.gor
Breaking that down:
--input-raw: This flag is your bread and butter. It tells GoReplay to capture raw traffic from a specific network port.--output-file: This one’s pretty self-explanatory—it specifies the file where GoReplay will store the captured traffic for you to use later.
Handling HTTPS and Sensitive Data
Most applications today don’t just run on HTTP; they run on HTTPS, which encrypts everything. To get around this, you need to run GoReplay on the same machine as your application server or reverse proxy, before the traffic gets encrypted. This strategic placement allows it to see the raw, unencrypted HTTP requests, giving you a crystal-clear picture of what your users are actually doing.
Of course, capturing live traffic immediately brings up security and privacy. You absolutely cannot, under any circumstances, record sensitive user data like passwords, API keys, or personal information. This isn’t just a good idea; it’s a legal necessity to comply with regulations like GDPR and CCPA.
The goal is to replicate traffic patterns, not to copy sensitive data. You can learn everything you need about performance from user behavior in aggregate, without ever compromising individual privacy.
Thankfully, GoReplay has powerful middleware options baked right in to help you filter or rewrite data on the fly. You can use flags like --http-rewrite-header to modify headers or --http-allow-url to only capture requests that match specific URL patterns.
Filtering Traffic for Cleaner Test Data
For more complex data sanitization, your best bet is to write a simple script and feed it to GoReplay using the --middleware flag. This script can inspect each and every request, find sensitive information, and replace it with placeholder text before it’s ever written to your output file.
For instance, you could whip up a small program in Python or Go that intercepts requests from GoReplay. It could look for an Authorization: Bearer header and replace the actual token with something like [REDACTED]. This approach ensures your traffic.gor file is a high-fidelity copy of your traffic’s structure and volume, just without any of the security risks.
This careful approach to capturing and cleaning traffic is fundamental. It gives you the realistic, safe, and actionable data you need to drive meaningful application performance improvement in your test environments. With a clean traffic file in hand, you’re ready for the next stage: replaying it.
Alright, you’ve got your sanitized traffic file in hand. Now for the fun part: unleashing that real-world load on your staging or development environment. This is where the magic really happens. Forget guessing about user behavior—you’re about to simulate it with perfect fidelity. This step is a total game-changer for application performance improvement, closing the gap between theory and what actually happens in production.
The basic command to get started is refreshingly simple. Just point GoReplay to your traffic file with --input-file and direct it to your test environment using --output-tcp. Instantly, you’re creating a 1:1 mirror of the production load your app was handling.
Pushing the Limits with Speed Control
A one-to-one replay is fantastic for validation, but what about the future? How will your application handle a sudden traffic spike or next quarter’s growth? GoReplay makes stress testing incredibly easy with the --output-tcp-speed flag. This lets you control the playback rate with a simple percentage.
--output-tcp-speed 100%: Replays traffic exactly as it was captured.--output-tcp-speed 500%: Blasts your app with five times the original traffic, perfect for a serious stress test.--output-tcp-speed 10%: Slows things way down, which is great for isolating and watching specific, tricky interactions up close.
This level of control is how you find breaking points before your users do. You can learn more about how this elevates your testing in our detailed guide on traffic replay.
The goal here isn’t just to see how your app performs today, but how it will hold up under real pressure. Simulating a 10x load might reveal that a database connection pool that seems fine now would completely choke during a major Black Friday sale.
This whole process is a powerful, repeatable loop for driving optimization. You find a bottleneck, you fix it, and you validate the fix with the same real-world traffic.
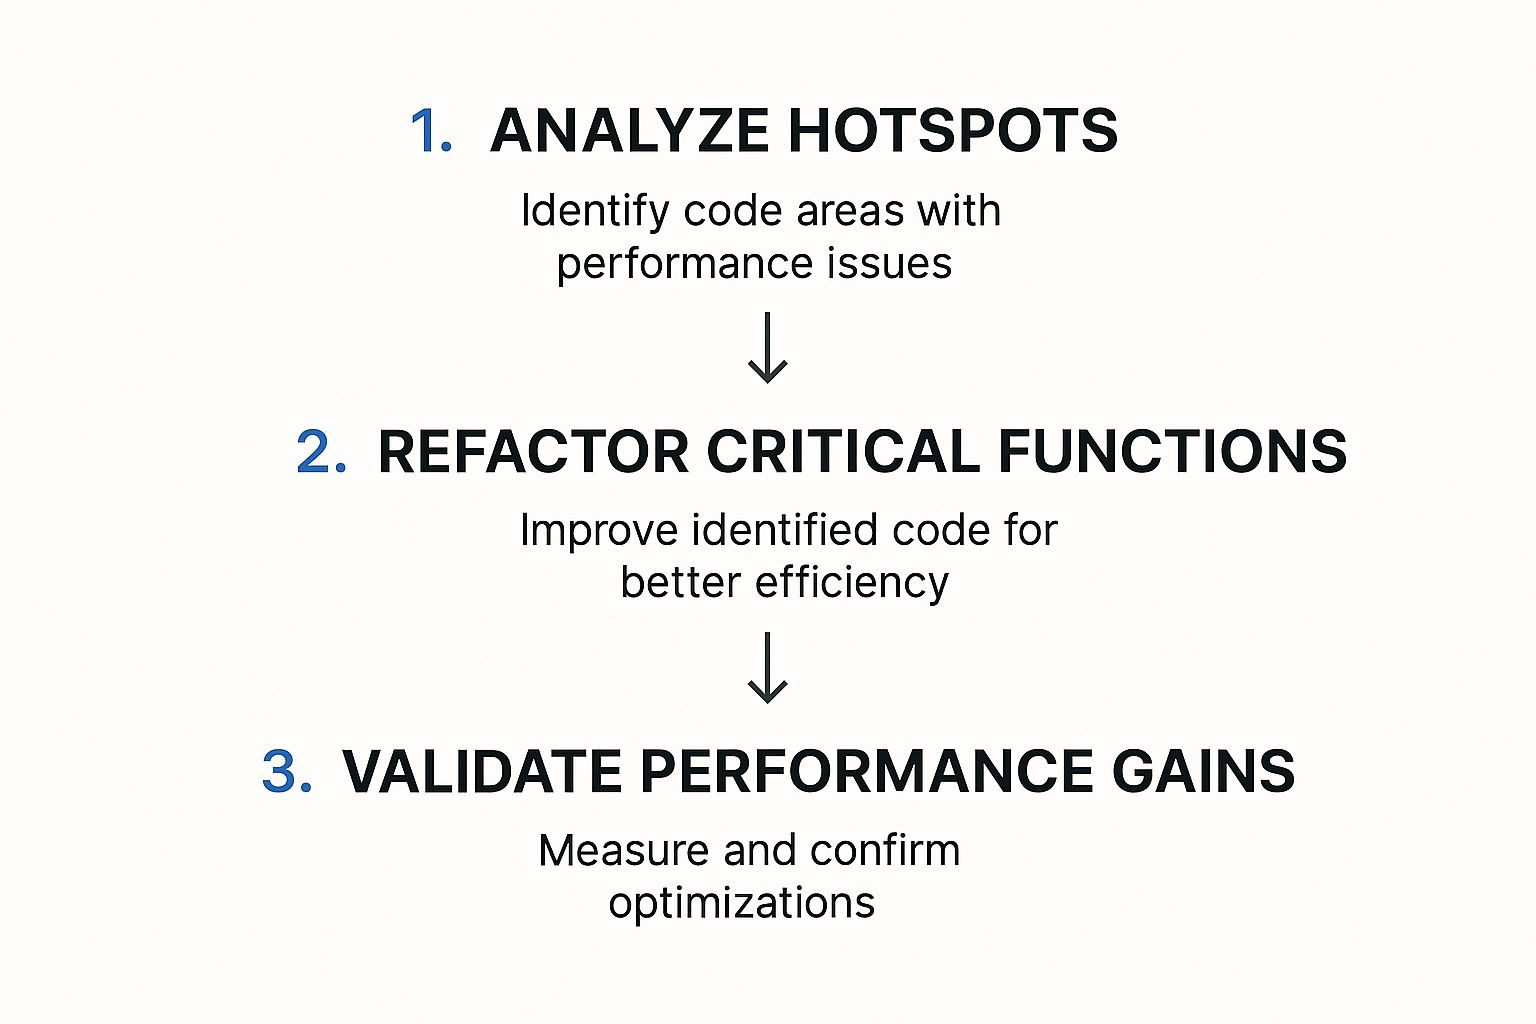
The image above nails it: analyze hotspots, refactor the code causing the trouble, and then validate your fix by re-running the exact same traffic replay. It’s a simple but effective cycle.
Adapting Traffic on the Fly with Middleware
Let’s be real—your staging environment probably isn’t a perfect clone of production. You might have different hostnames, API endpoints, or authentication setups. This is where middleware becomes your best friend.
By using the --middleware flag during replay, you can pass every request through a script to modify it on the fly. For instance, a quick middleware script could rewrite the Host header on every request to match your staging server’s address. This guarantees the replayed traffic hits the right server, even if the original requests were for your production domain. It’s this flexibility that makes your tests incredibly powerful and adaptable to any environment.
Finding Bottlenecks by Analyzing Test Results
Running the test is just the beginning. The real magic happens when you translate the raw output from your replayed traffic into a clear, actionable story about your application’s health. This is where you dig in, moving beyond simple pass/fail metrics to find the subtle signals that point directly to performance bottlenecks.
Think of it as detective work. You’re looking for clues in the data. The most obvious places to start are the core Key Performance Indicators (KPIs).
- Response Times: Keep an eye on the average time it takes for your application to respond. Any sudden spikes or a consistently high average are immediate red flags.
- Error Rates: Did you see an increase in HTTP 5xx server errors or 4xx client errors during the test? That’s a sure sign your system is struggling under load.
- Resource Utilization: Watch your test server’s CPU and memory usage like a hawk. High utilization can point straight to inefficient code or sluggish database queries that need a tune-up.
Using Shadowing for Direct Comparison
One of GoReplay’s most powerful features is traffic shadowing. Instead of just replaying traffic to a test server, shadowing sends the exact same request to both your production and test environments at the same time. GoReplay then compares the responses—headers, status codes, body, and all—and flags any differences.
This technique is a game-changer for catching regressions before they go live. Let’s say your new code in staging returns a response 50ms slower than production for the same request. Boom. You’ve just found a performance regression before it ever has a chance to impact a real user.
The real value of shadowing is the immediate, direct feedback it provides. You’re not just looking at metrics in a vacuum; you’re getting a side-by-side comparison of old versus new. It makes it dead simple to validate that your changes are actually improvements, not setbacks.
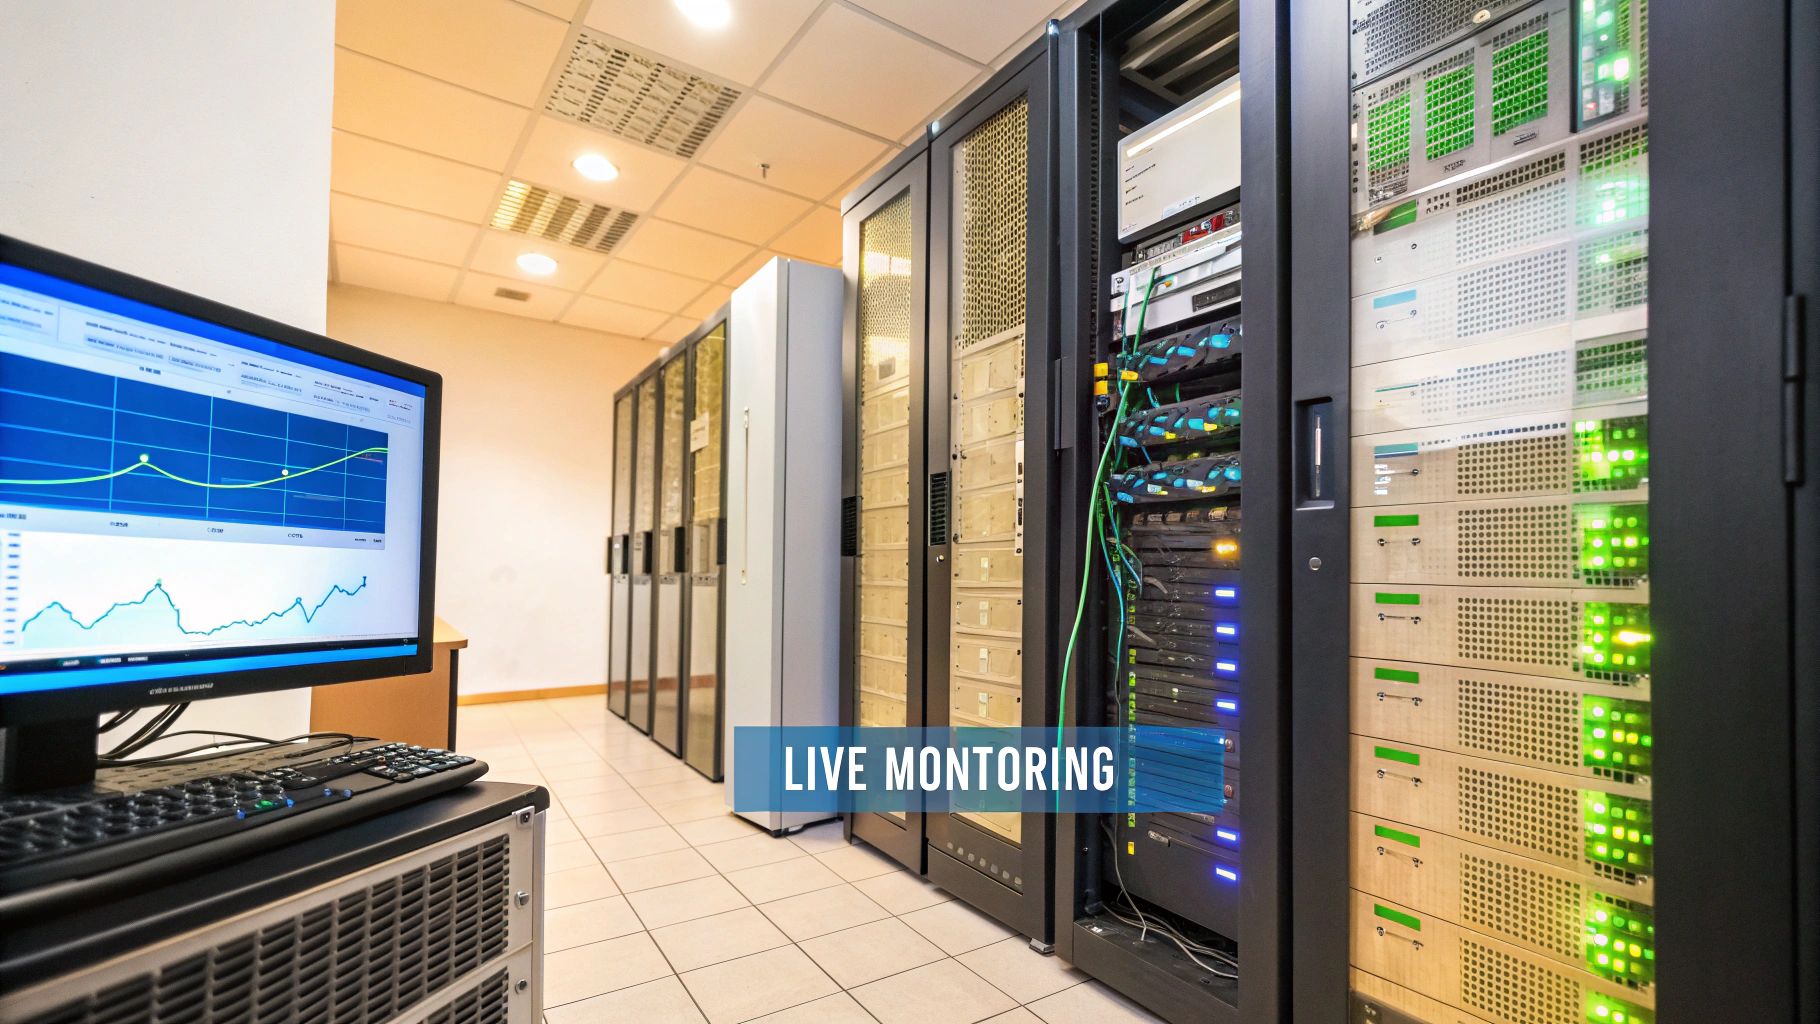
Visualizing Performance Data
While raw logs are great, visualizing the data is what often reveals the deeper patterns. When you pump GoReplay’s output into monitoring tools like Prometheus and Grafana, you get a panoramic dashboard view of your application’s behavior under real-world load.
This is how you connect the dots. You can instantly correlate a spike in response time with a jump in CPU usage, which immediately narrows your search for the root cause. No more guesswork.
When you’re trying to improve application performance, you need to track the right metrics. They’re your compass, telling you if you’re heading in the right direction. Below is a table summarizing some of the most critical metrics you should be monitoring.
Key Performance Metrics for Analysis
| Metric | What It Measures | Why It Matters for Improvement |
|---|---|---|
| Apdex Score | User satisfaction with application responsiveness. | A low score directly signals a poor user experience, pointing to areas that need immediate attention. |
| SLA Compliance | Your service’s ability to meet its uptime and performance promises. | Failing to meet SLAs can have business consequences. This metric keeps you honest about reliability. |
| Average Response Time | The time from a user request to the first byte of the response. | This is a direct measure of speed. High response times lead to user frustration and abandonment. |
| CPU Usage | The percentage of CPU capacity being used by your application. | High CPU usage under normal load can indicate inefficient code or resource-hungry processes. |
These metrics, which you can learn more about in this guide from Coralogix, are standard for a reason. They provide a clear, data-driven view into both user satisfaction and system health, helping you pinpoint exactly where optimizations will have the most impact.
By combining direct response comparisons from shadowing with broad metric visualization, you build a complete picture of your application’s weaknesses. You’re no longer staring at abstract data; you have a clear roadmap for optimization.
Alright, you’ve used GoReplay to hunt down a performance bottleneck. That’s a huge win, but identifying the problem is really only half the battle. Now comes the critical part: implementing a fix and—most importantly—proving that it actually made a difference.
This is where you can build a powerful, data-driven feedback loop.
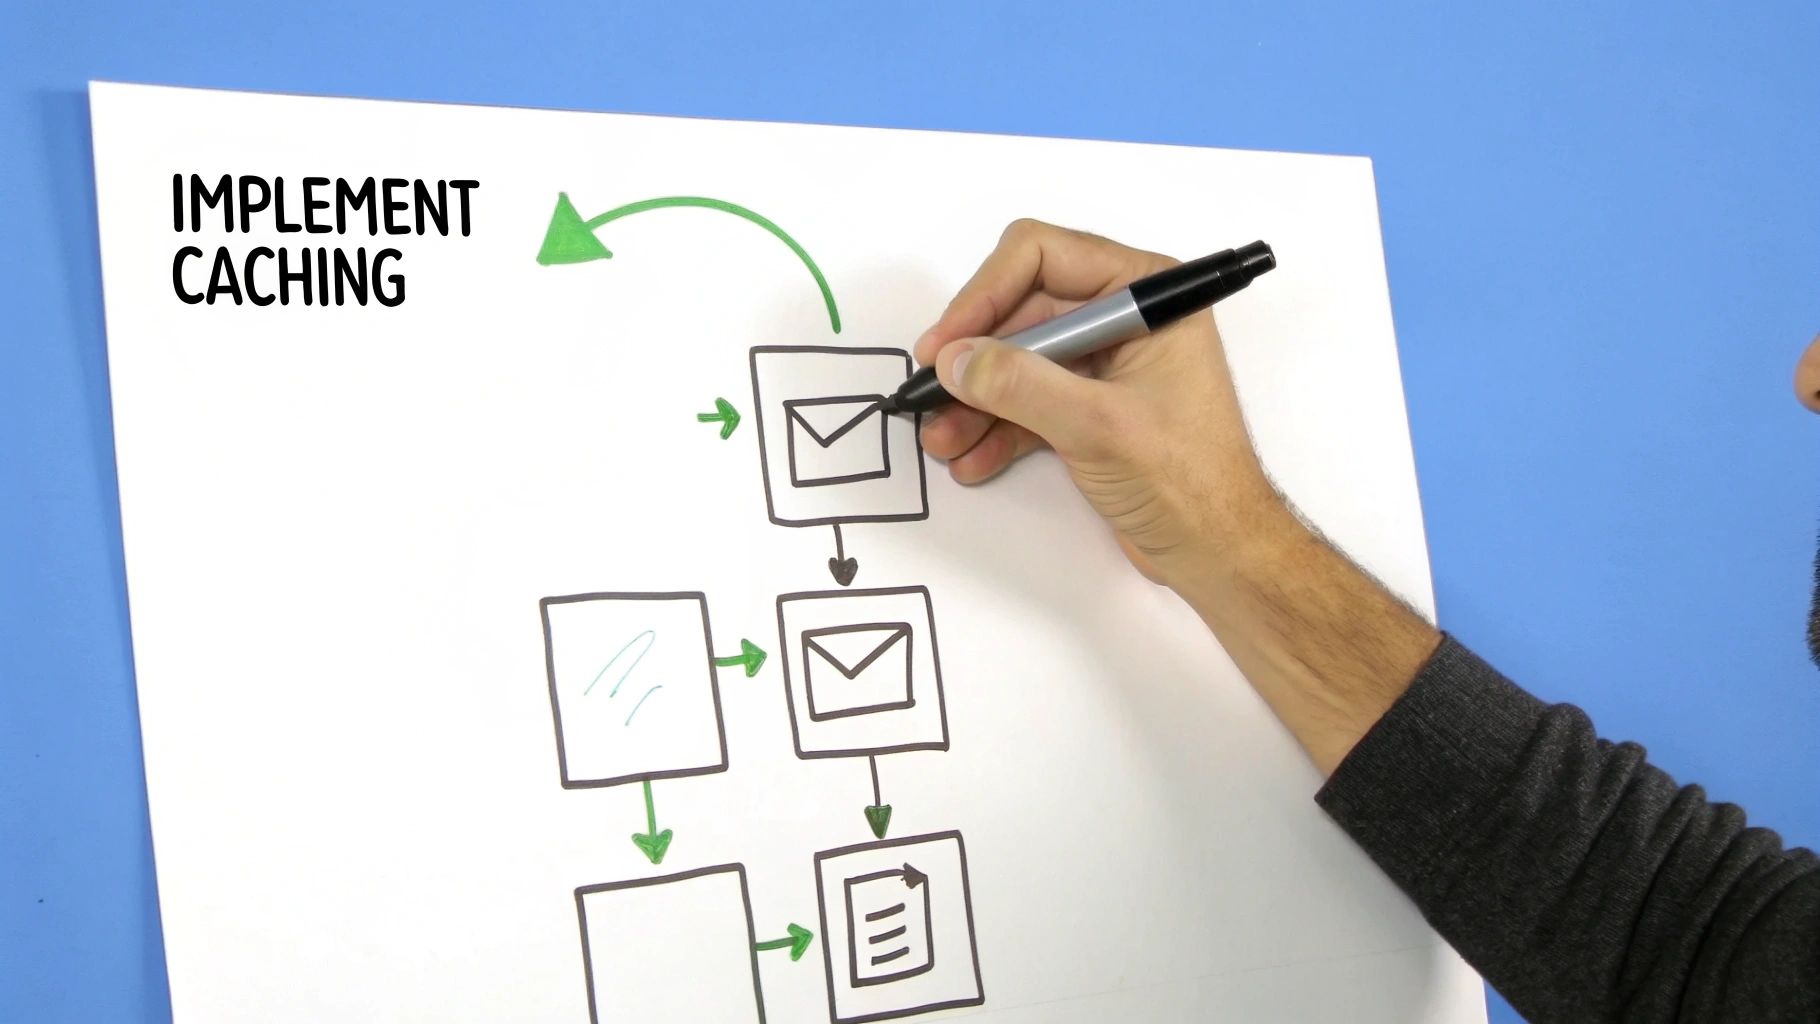
Once your team deploys a potential fix—maybe it’s refactoring a clunky database query, adding a caching layer, or optimizing a CPU-hungry algorithm—you don’t just cross your fingers. Instead, you grab the exact same traffic.gor file you used to find the problem in the first place and replay it all over again.
This simple, iterative process gives you a clear, undeniable before-and-after comparison. By using the same realistic production traffic for both tests, you completely eliminate guesswork and other variables. The performance data will tell you in black and white whether your change improved things, made them worse, or had no real impact at all.
From Hypothesis to Hard Data
Let’s walk through a common scenario. Imagine your initial analysis showed the /api/v1/user/profile endpoint was struggling, with response times hitting 800ms under load. Your team suspects a series of complex database joins is the culprit. After refactoring the code, you push the fix to your staging environment.
Now, you replay the original traffic against the updated staging server. You’re looking for a measurable change. Did the average response time for that endpoint drop? In a successful optimization, you might see the new average settle around a much healthier 150ms. That’s not a guess; it’s a verifiable improvement backed by data from real user behavior.
The core principle here is scientific validation. Treat every optimization as a hypothesis that must be proven with empirical evidence. Replaying identical traffic loads removes confounding variables and makes your performance metrics completely trustworthy.
This approach builds tremendous confidence and ensures your engineering effort is focused on what truly matters. There’s nothing more frustrating than spending a week on an “optimization” that delivers zero real-world benefit. This validation loop keeps that from happening.
To dig deeper into how this iterative testing method strengthens your overall strategy, check out our article on boosting application performance with advanced load testing. This continuous cycle of implementing, testing, and validating is the most reliable path to building faster, more resilient applications. It transforms performance tuning from an art into a science.
Common Questions About Using GoReplay
Bringing a new tool into your stack always raises a few questions, and GoReplay is no different. It’s an incredibly powerful way to improve application performance, but knowing how to handle common scenarios is the key to unlocking its full potential.
Let’s walk through some of the questions that come up most often when teams start their journey with traffic replay.
Is It Safe to Run GoReplay on a Live Production Server?
Yes, it is. GoReplay was engineered from the ground up to be safe and non-intrusive on live servers. It’s extremely lightweight and works by passively listening to network packets—much like a network sniffer. It never gets in the way of your application’s actual request-response flow.
This passive approach means it does not add any latency to your production traffic.
That said, a little bit of caution is always a good idea. A smart move is to monitor your server’s CPU and memory usage right after you first deploy GoReplay. Running it during an off-peak period for the initial setup can also help build your confidence before you let it run continuously.
How Do I Handle Sensitive Data Like Passwords or API Keys?
This is probably one of the most critical aspects to get right. GoReplay gives you powerful middleware features designed specifically for this. You can write a simple script to find and rewrite any sensitive data, like authentication tokens or personal information, before it ever gets saved to a traffic file.
By using the --middleware flag, GoReplay can pipe every single request through your custom script. For instance, you could have a script that automatically finds an Authorization: Bearer [token] header and replaces the token with Authorization: Bearer [REDACTED].
This keeps the traffic structure perfectly intact while ensuring you protect sensitive user data and stay compliant with privacy rules like GDPR or CCPA.
Your goal is to replicate realistic traffic patterns, not to mirror sensitive user data. The structure and volume of requests provide all the necessary insights for performance analysis without compromising privacy. This focus on traffic shape over content is what makes the process secure.
How Is This Different from Tools Like JMeter or Gatling?
This question really gets to the heart of why GoReplay is so effective.
Traditional load testing tools like JMeter or Gatling are fantastic for generating synthetic, scripted traffic. You can use them to test specific user journeys and known endpoints under controlled, repeatable conditions. They’re built for creating predictable load.
GoReplay, on the other hand, captures real, unpredictable user traffic. It catches the entire “long tail” of user behavior—all the strange requests, unexpected interactions, and edge cases you would never think to script. Maybe a user submits a form with an unusual character set or hits an old, rarely used API endpoint that’s been forgotten.
This realism is what makes GoReplay so incredibly good at finding regressions and performance issues that scripted tests almost always miss. It’s the difference between testing a hypothesis and observing reality. You get a much higher-fidelity validation of your application’s performance, ensuring your optimizations solve problems your actual users are facing.
Ready to stop guessing and start using real traffic to validate your application? GoReplay gives you the tools to capture and replay production traffic safely, helping you find and fix bottlenecks before they impact your users. Start improving your application performance today.