Mastering Application Monitoring in 2025
Modern applications demand sophisticated monitoring. This listicle delivers eight application monitoring best practices for optimal performance and reliability. Learn how to proactively identify and resolve issues before they impact users by implementing techniques like end-to-end transaction monitoring, robust alerting, comprehensive error tracking, and user experience monitoring. Mastering these application monitoring best practices will help your team deliver a seamless digital experience. We’ll also explore infrastructure as code for monitoring, context-aware anomaly detection, log aggregation and analysis, and establishing SLOs and error budgets.
1. Implement End-to-End Transaction Monitoring
End-to-end transaction monitoring is a crucial application monitoring best practice that involves tracking the entire journey of a user transaction across all components of your application stack. This includes everything from the initial user interaction on the frontend, through middleware services, backend databases, and even third-party integrations. This holistic approach provides significantly more context than monitoring individual components in isolation, enabling teams to pinpoint performance bottlenecks and understand the full impact of issues on the user experience. This is essential for maintaining application performance and reliability in today’s complex, distributed systems.
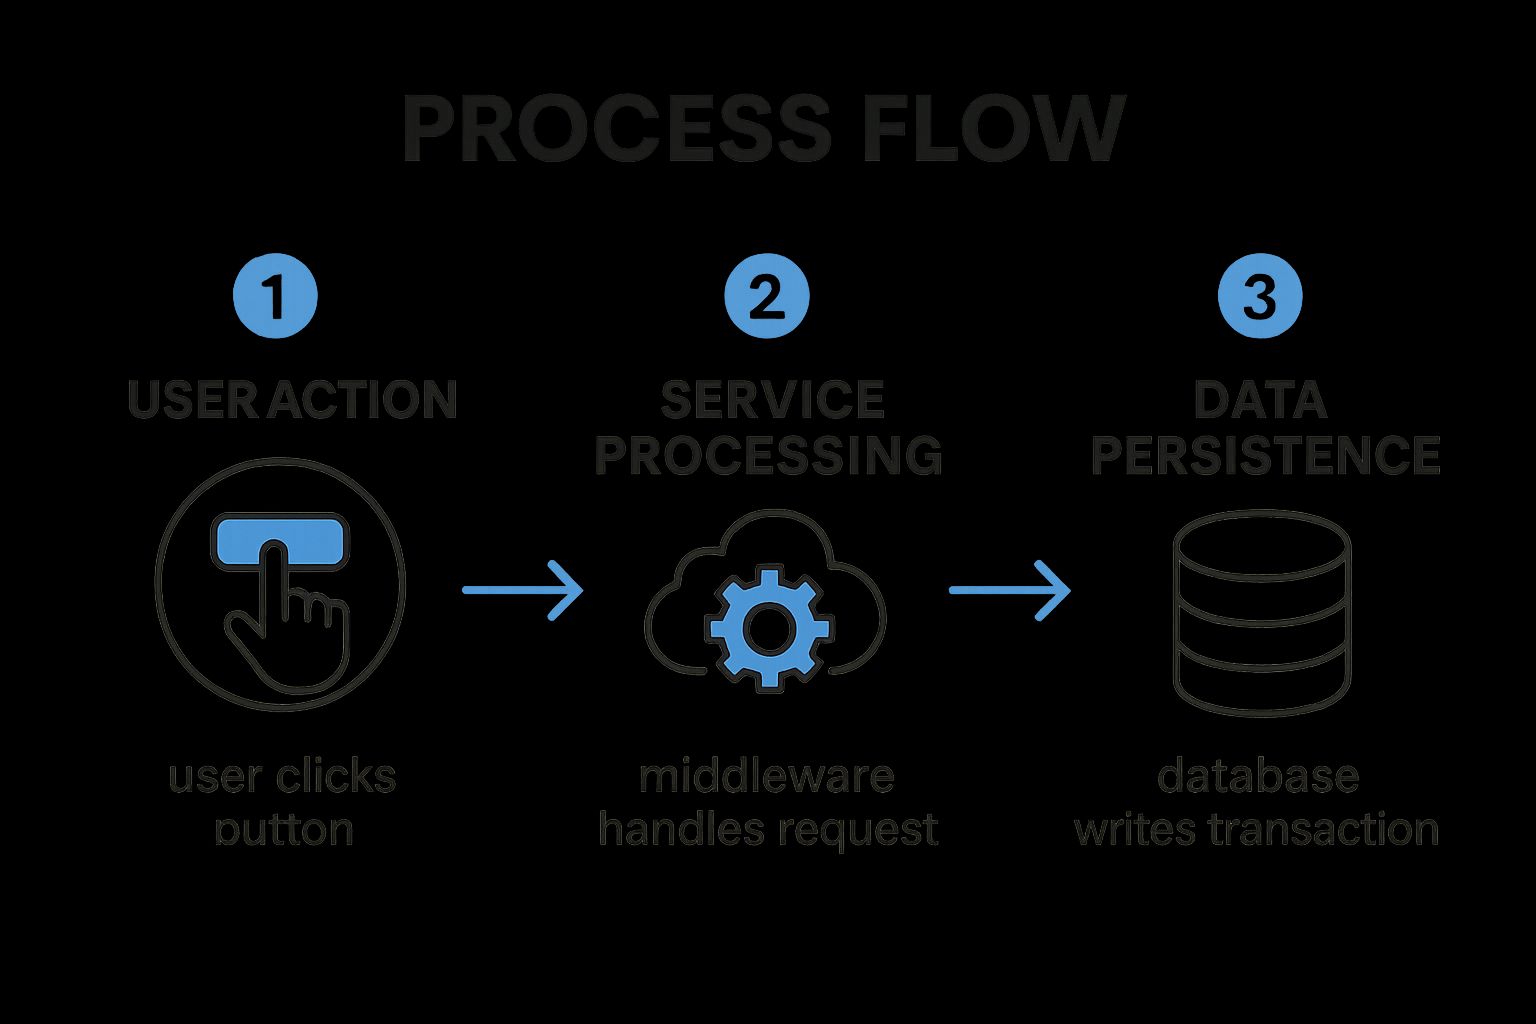
The infographic above visualizes the process of a typical web transaction, highlighting the various components involved and the flow of data between them. Let’s delve into this process: A user initiates a transaction via their browser (Step 1). The request then travels to a load balancer (Step 2), which distributes traffic across multiple web servers (Step 3). These servers interact with application servers (Step 4) which handle the business logic and may also connect to caching services (Step 5) to improve performance. Finally, the application servers communicate with databases (Step 6) to retrieve or store data. This visualization demonstrates the intricate dependencies within a distributed system and emphasizes the need for end-to-end visibility. As we can see, a performance bottleneck at any stage can impact the overall transaction time and user experience.
End-to-end transaction monitoring provides several key features, including distributed tracing capabilities, cross-component dependency mapping, transaction flow visualization, service-to-service communication tracking, and latency measurement at each hop. This enables teams to understand how each component contributes to the overall performance of a transaction.
Benefits of implementing end-to-end transaction monitoring:
- Complete Visibility: Gain a comprehensive understanding of complex distributed systems and how different services interact.
- Bottleneck Identification: Pinpoint performance bottlenecks at the intersection points between services.
- Accurate Root Cause Analysis: Determine the root cause of performance issues more quickly and efficiently.
- Improved MTTR: Reduce mean time to resolution by identifying and addressing issues faster.
- Better Understanding of System Dependencies: Visualize and analyze the complex relationships between different services.
However, there are some drawbacks to consider:
- Data Volume: End-to-end monitoring generates large volumes of data that require efficient storage and analysis.
- Performance Overhead: Instrumentation can introduce a slight performance overhead.
- Implementation Complexity: Implementing end-to-end monitoring can be complex, particularly in legacy systems.
- Cost: Full implementation across large environments can be expensive.
Companies like Netflix, Uber, and Etsy have successfully implemented end-to-end transaction monitoring to optimize their application performance and enhance user experiences. Netflix uses it to monitor requests across their microservices architecture, Uber tracks rider experiences from app opening to trip completion, and Etsy monitors the full shopping experience. These examples demonstrate the effectiveness of this best practice in real-world scenarios.
Tips for implementing end-to-end transaction monitoring:
- Prioritize Critical Journeys: Start by identifying the most critical user journeys to monitor.
- Standardize Instrumentation: Use OpenTelemetry for standardized instrumentation across all components.
- Use Correlation IDs: Implement correlation IDs that follow requests across services.
- Focus on Business Transactions: Monitor business transactions rather than just technical metrics.
- Establish Baselines: Establish transaction performance baselines before optimizing.
Learn more about Implement End-to-End Transaction Monitoring
By following these application monitoring best practices and leveraging tools like Datadog APM, New Relic, Dynatrace, or the open-source Jaeger, inspired by Google’s Dapper, you can significantly improve the performance, reliability, and user experience of your applications. Implementing end-to-end transaction monitoring deserves its place on this list because it provides a comprehensive and proactive approach to identifying and resolving performance issues in modern distributed systems.
2. Establish a Robust Alerting Strategy
A robust alerting strategy is crucial for effective application monitoring best practices. It ensures that the right people are notified about critical issues at the right time, minimizing downtime and preventing alert fatigue. This involves defining meaningful thresholds based on business impact, not just system metrics, and implementing alert severity levels that dictate the urgency and response required. Clear escalation paths are essential, directing alerts to the appropriate teams based on the nature of the issue, ensuring swift and effective remediation. Without a robust alerting strategy, critical issues might go unnoticed, leading to significant business disruptions, while excessive, irrelevant alerts can desensitize teams, leading them to ignore potentially important warnings.

A well-defined alerting strategy incorporates several key features. Multi-level alert thresholds allow for nuanced responses based on the severity of the issue. Alert correlation and deduplication reduce noise by grouping related alerts and suppressing duplicates. Dynamic baselining automatically adjusts thresholds based on historical data, ensuring alerts remain relevant despite fluctuating traffic or system load. Classifying alerts based on their business impact aligns monitoring with business priorities. Finally, automated incident response workflows can trigger pre-defined actions, such as restarting services or escalating to on-call engineers, accelerating the resolution process.
The benefits of a robust alerting strategy are numerous. It reduces noise and alert fatigue, allowing teams to focus on genuine issues. It ensures that critical issues receive immediate attention, minimizing downtime and preventing user impact. Furthermore, a well-designed strategy speeds up incident response time by providing context and actionable information. By aligning monitoring with business priorities, it ensures resources are focused on the most impactful areas. You can Learn more about Establish a Robust Alerting Strategy.
However, implementing and maintaining a robust alerting strategy does come with challenges. It requires ongoing maintenance to keep thresholds relevant and accurate. Initially, setting appropriate thresholds can be difficult, requiring careful analysis and fine-tuning. Regular tuning may be necessary to reduce false positives and ensure alerts remain actionable. Implementing a comprehensive strategy across heterogeneous systems can be complex, requiring careful integration and coordination. Finally, successful adoption requires cultural changes across teams, emphasizing the importance of prompt response and collaboration.
Several organizations have successfully implemented robust alerting strategies, demonstrating the tangible benefits of this approach. PagerDuty, for instance, implemented intelligent alert grouping that reduced alert volume by a staggering 98%. LinkedIn’s automated issue detection system prioritizes user-impacting problems, ensuring rapid response to issues affecting their customer base. Slack’s alert system categorizes notifications by service impact level, allowing teams to prioritize their responses effectively.
For those looking to implement or improve their alerting strategy, here are some actionable tips. Define alerts based on user experience (SLIs - Service Level Indicators) rather than purely system metrics. This ensures that alerts reflect the actual impact on users. Implement a tiered alerting approach (warning, critical, emergency) to differentiate severity and response requirements. Use alert correlation to group related issues and avoid alert storms. Schedule regular alert audits to remove outdated or noisy alerts, keeping your system clean and efficient. Finally, create runbooks for common alerts to provide step-by-step instructions and speed up resolution. These practices, popularized by Google’s Site Reliability Engineering practices and platforms like PagerDuty, VictorOps (now Splunk On-Call), and OpsGenie (Atlassian), as well as Rob Ewaschuk’s insightful essay “My Philosophy on Alerting,” are key to effective application monitoring and incident management. This focus on proactive, user-centric alerting is what earns this best practice its place on this list.
3. Implement Comprehensive Error Tracking
Effective application monitoring goes beyond simply knowing if your application is up and running. It requires understanding how it’s performing and proactively identifying potential problems before they impact your users. This is where comprehensive error tracking, a crucial application monitoring best practice, comes into play. Error tracking involves capturing, aggregating, and analyzing application errors and exceptions to identify patterns, prioritize fixes, and understand the impact on user experience. It helps shift your team from reactive firefighting to proactive problem solving.
A robust error tracking system moves beyond basic logging by providing valuable context, frequency information, and impact assessments for each error. This allows teams to efficiently focus on resolving the most critical issues first, maximizing development resources and minimizing user disruption. Instead of sifting through logs, developers receive actionable insights, accelerating the debugging process.
How it Works:
Error tracking solutions typically involve integrating a library or agent within your application code. This library captures exceptions and errors in real-time, along with relevant contextual information. The captured data is then transmitted to a centralized platform where it’s aggregated, deduplicated, and analyzed. This platform provides tools for visualizing error trends, exploring stack traces, and prioritizing fixes based on impact and frequency.
Key Features of Effective Error Tracking Systems:
- Real-time error capture and notification: Be informed of errors as they happen, enabling swift responses to critical issues.
- Error deduplication and grouping: Avoid being overwhelmed by redundant reports; similar errors are grouped for efficient analysis.
- Stack trace analysis: Dive into the code execution path to pinpoint the root cause of errors quickly.
- Error impact assessment: Understand how many users are affected by each error, helping prioritize fixes based on business impact.
- Integration with deployment tracking: Correlate errors with specific code deployments to quickly identify problematic releases.
- Error trend visualization: Monitor error rates over time to identify patterns and proactively address emerging issues.
Pros and Cons:
Pros:
- Prioritized bug fixes: Focus on resolving issues with the largest user impact first.
- Faster debugging: Contextual information speeds up the debugging process.
- Proactive issue resolution: Identify and fix issues before users report them.
- Improved release quality: Make data-driven decisions about release readiness.
- Increased code quality accountability: Provides clear visibility into code stability and encourages proactive improvements.
Cons:
- Data volume: Can generate large volumes of data that require effective filtering strategies.
- Code modifications: May require code changes to capture optimal context for errors.
- Privacy concerns: Carefully handle user data captured in error reports to comply with privacy regulations.
- Performance impact: Detailed error reporting can introduce a slight performance overhead.
- Requires discipline: The system is only effective if teams commit to addressing identified issues.
Examples of Successful Implementation:
- GitHub: Uses error tracking to proactively identify and fix issues before they impact a significant number of users, maintaining a seamless development experience.
- Airbnb: Correlates errors with specific code deployments for rapid identification of problematic releases, minimizing disruption to their vast user base.
- Spotify: Prioritizes error fixes based on user impact statistics, ensuring that the most critical issues for their millions of listeners are addressed first.
Actionable Tips for Implementation:
- Capture user context: Include information like browser, device, and user actions to understand the circumstances surrounding errors.
- Implement source maps: Demystify minified JavaScript code for easier debugging.
- Set up alerts: Configure alerts for sudden increases in error rates to proactively address emerging problems.
- Tag errors: Use version information to correlate errors with specific deployments.
- Create a triage process: Establish a clear process for prioritizing error fixes based on impact and frequency.
- Consider impact and frequency: Balance the frequency of an error with its impact on users when prioritizing fixes.
Popular Error Tracking Tools:
- Sentry
- Rollbar
- Bugsnag
- TrackJS
- Application Insights (Microsoft)
By implementing comprehensive error tracking as part of your application monitoring best practices, you empower your team to proactively identify, understand, and resolve issues before they impact your users. This leads to improved application stability, enhanced user satisfaction, and a more efficient development process.
4. Adopt User Experience Monitoring
In the realm of application monitoring best practices, user experience monitoring takes center stage. While traditional monitoring focuses on server-side metrics like CPU usage and memory consumption, user experience monitoring (UEM) shifts the perspective to how real users interact with your application. This approach emphasizes measuring performance from the end user’s point of view, providing crucial insights into what they actually experience. This can often differ significantly from what backend monitoring suggests, revealing hidden performance bottlenecks and usability issues. UEM tracks metrics such as page load time, time to interactive (TTI), frontend errors, and complete user journeys within the application. By understanding how users navigate and interact with your application, you gain a valuable understanding of their digital experience.

UEM leverages several key features to achieve this, including Real User Monitoring (RUM), which captures performance data from actual user sessions; Synthetic transaction monitoring, which simulates user interactions to proactively identify potential issues; and Frontend performance metrics tracking, which provides granular details about client-side performance. Furthermore, User journey analysis maps out the steps users take within the application, revealing friction points and areas for optimization. Client-side error capture pinpoints JavaScript errors and other frontend issues that impact the user experience. Finally, Geographic performance variation analysis identifies performance discrepancies based on user location.
The benefits of incorporating UEM into your application monitoring best practices are numerous. It provides genuine visibility into the actual user experience, identifying issues that traditional backend monitoring often misses. This empowers teams to prioritize improvements that directly impact users, leading to increased satisfaction and engagement. UEM enables performance comparisons across different user segments, providing insights into how performance varies based on factors like device type, location, and network conditions. Critically, it supports business KPI correlation, allowing you to link performance improvements to tangible business outcomes like conversion rates and revenue.
While UEM offers substantial advantages, it’s important to be aware of potential drawbacks. Implementing UEM may require additional frontend instrumentation. Furthermore, collecting user experience data may raise privacy concerns that necessitate user consent. High-traffic applications can generate large volumes of data, requiring robust data storage and analysis capabilities. Environmental variables such as user networks and devices introduce complexity into performance analysis. Finally, while invaluable, synthetic monitoring may not perfectly replicate real user conditions.
Examples of successful UEM implementation abound. Google leverages Core Web Vitals to measure and enhance user experience across its vast array of properties. Amazon meticulously measures and optimizes user experience metrics, directly correlating them with conversion rates. Facebook’s performance monitoring regime prioritizes user interaction responsiveness, ensuring a seamless and engaging experience for its billions of users.
To effectively implement UEM, consider the following tips: Implement both synthetic and real user monitoring for comprehensive coverage. Focus on key user journeys rather than attempting to monitor everything. Utilize the RAIL performance model (Response, Animation, Idle, Load) to guide your optimization efforts. Segment performance data by device type, region, and connection speed to pinpoint specific areas for improvement. Establish performance budgets for critical user paths to ensure consistent performance. Finally, correlate experience metrics with business outcomes to demonstrate the value of your UEM initiatives.
Tools like Google’s Core Web Vitals initiative, SpeedCurve, New Relic Browser, Catchpoint, and Dynatrace Real User Monitoring have popularized and advanced the field of UEM, providing robust solutions for capturing, analyzing, and acting on user experience data.
By adopting user experience monitoring as a core component of your application monitoring best practices, you can gain a deep understanding of how users interact with your application, identify and address performance bottlenecks, and ultimately deliver exceptional digital experiences that drive business success.
5. Implement Infrastructure as Code for Monitoring
Implementing Infrastructure as Code (IaC) for your application monitoring is a crucial best practice for modern software development and operations. This approach elevates your monitoring strategy by applying the same rigor and automation used for managing your application’s infrastructure to your monitoring setup itself. Instead of manually configuring dashboards, alerts, and other monitoring components, you define them in code, which is then version-controlled, tested, and deployed automatically. This shift brings numerous benefits and ensures your monitoring remains reliable, consistent, and scalable.
How it Works:
IaC for monitoring involves using declarative configuration files to define your monitoring resources. These files describe the desired state of your monitoring setup, including dashboards, alert rules, data sources, and notification channels. Tools like Terraform, CloudFormation, or platform-specific tools like the Prometheus Operator then interpret these configurations and automatically provision and manage the monitoring infrastructure. This allows for automated deployments, easy replication across environments, and simplified management of complex monitoring setups.
Features of IaC for Monitoring:
- Version-controlled monitoring configurations: Track changes, revert to previous versions, and collaborate effectively on monitoring setup.
- Automated dashboard deployment: Eliminate manual configuration and ensure consistent dashboards across different environments.
- Environment-specific monitoring parameters: Tailor monitoring configurations to specific needs, such as different thresholds for testing and production.
- Template-based alert definitions: Standardize alerts and reduce redundancy by defining reusable alert templates.
- Monitoring configuration testing: Validate changes before deployment to prevent unintended consequences.
- Drift detection for monitoring setup: Identify and correct any manual changes that deviate from the defined configuration.
Why Implement IaC for Monitoring?
This approach deserves its place among the best practices for application monitoring because it addresses several key challenges of managing monitoring at scale. Manual configuration is prone to errors, inconsistent across environments, difficult to track, and nearly impossible to reproduce reliably. IaC solves these problems by providing a consistent, repeatable, and auditable process for managing your entire monitoring setup. It also enables faster onboarding of new services and features by streamlining the creation and deployment of corresponding monitoring resources. This is especially important in fast-paced, agile environments.
Pros:
- Ensures consistency across environments: No more discrepancies between development, staging, and production monitoring.
- Enables quick recovery from monitoring failures: Recreate your entire monitoring setup automatically from code.
- Facilitates knowledge sharing across teams: Monitoring configurations become part of the codebase, promoting collaboration and understanding.
- Supports rapid onboarding of new services: Quickly define and deploy monitoring for new applications and features.
- Creates audit trail for monitoring changes: Track who made changes, when, and why.
- Reduces configuration errors: Automated deployments minimize human error and ensure consistent application of configurations.
Cons:
- Initial learning curve for teams new to IaC concepts: Requires training and familiarity with IaC tools and principles.
- Requires additional tooling and processes: Integrating IaC into your workflow requires adopting new tools and adapting existing processes.
- May be challenging to convert existing configurations: Migrating from manual configurations to IaC can be time-consuming.
- Some monitoring platforms have limited API capabilities: IaC relies on APIs, and limited API support can restrict automation possibilities.
- Requires discipline to avoid manual changes: Manual changes can lead to configuration drift and negate the benefits of IaC.
Examples of Successful Implementation:
- HashiCorp utilizes Terraform to manage their Datadog monitoring setup across various environments.
- Monzo Bank employs monitoring as code to ensure consistent observability across their microservices architecture.
- Netflix automates their monitoring configuration using their internal tooling for streamlined management.
Tips for Implementing IaC for Monitoring:
- Start small: Begin with critical alerts and dashboards before converting your entire monitoring setup.
- Use templating: Standardize monitoring across similar services by using templates to define common configurations.
- Implement CI/CD pipelines: Integrate monitoring changes into your CI/CD pipelines for automated testing and deployment.
- Create reusable modules: Develop monitoring modules that can be shared and reused across different teams.
- Establish naming and tagging standards: Ensure consistency and facilitate easy management of your monitoring resources.
- Document alert behavior: Clearly document the expected behavior of alerts within the code to improve understanding and troubleshooting.
Popular Tools and Technologies:
- Terraform providers for various monitoring platforms (e.g., Datadog, Prometheus)
- Grafana’s grafonnet library for defining dashboards as code
- Prometheus Operator for managing Prometheus deployments on Kubernetes
- AWS CloudFormation for managing monitoring resources within the AWS ecosystem
By embracing IaC for your application monitoring best practices, you can significantly improve the reliability, scalability, and maintainability of your monitoring systems, ensuring your applications are always observable and performant.
6. Implement Context-Aware Anomaly Detection
Context-aware anomaly detection represents a significant advancement in application monitoring best practices. Moving beyond static thresholds, this method leverages the power of machine learning and statistical analysis to identify unusual application behavior while considering the context in which it occurs. This context includes factors like time of day, day of week, seasonal trends, and even deployment events. By understanding what “normal” looks like under various circumstances, context-aware anomaly detection drastically reduces false positives and surfaces truly critical deviations. This makes it an invaluable tool for modern, dynamic applications.
How it Works:
This approach establishes dynamic baselines of expected application performance metrics by analyzing historical data. Instead of relying on fixed thresholds, it learns the typical patterns and fluctuations for each metric within different contexts. For instance, it recognizes that higher website traffic on weekends is expected and doesn’t trigger an alert. When the system observes a deviation that falls outside the predicted range for a specific context, it flags it as a potential anomaly. This allows the system to identify subtle performance degradations or unusual patterns that would be missed by traditional threshold-based alerting systems. Features like seasonality-aware thresholds, multi-dimensional anomaly detection, and automatic pattern recognition further refine this process. The system continuously learns and adapts to evolving application behavior, automatically adjusting its sensitivity to ensure accurate detection.
Examples of Successful Implementation:
Several industry leaders have embraced context-aware anomaly detection to optimize their application monitoring strategies:
- Google Cloud: Utilizes AI-powered anomaly detection across its platform services to proactively identify and address potential issues.
- Microsoft Azure Application Insights: Implements smart detection for abnormal failure rates, allowing developers to quickly pinpoint and diagnose problems.
- PayPal: Employs anomaly detection to identify unusual payment processing patterns, enhancing fraud detection and security.
Benefits and Drawbacks:
| Pros | Cons |
|---|---|
| Reduces alert noise and false positives | Requires sufficient historical data to establish reliable baselines |
| Identifies subtle issues missed by static thresholds | May have a learning period before reaching optimal performance |
| Adapts to changing application patterns | Can be complex to understand the reasoning behind a specific anomaly detection |
| Detects compound issues across multiple metrics | Computationally intensive for large-scale applications |
| Ideal for dynamic, cloud-native applications | May require tuning for applications with highly variable behavior |
Actionable Tips for Implementation:
- Start Small: Begin with high-value metrics where traditional thresholds are difficult to set, such as error rates or latency.
- Sufficient Historical Data: Train models on at least 2-4 weeks of historical data to establish accurate baselines.
- Business Context Integration: Combine anomaly detection with business context for effective prioritization of alerts.
- Explainable AI: Utilize explainable AI approaches to understand the reasoning behind detected anomalies.
- Gradual Sensitivity Adjustment: Incrementally increase sensitivity as false-positive rates decrease and confidence in the model grows.
- Feedback Loop: Implement human feedback mechanisms to improve model accuracy and relevance.
When and Why to Use This Approach:
Context-aware anomaly detection is particularly valuable for applications with complex, dynamic behavior, where setting static thresholds is challenging and often leads to excessive false positives. This includes modern cloud-native applications, microservices architectures, and systems experiencing fluctuating workloads. It excels in scenarios where subtle deviations from normal behavior can have significant consequences.
Popularized By:
Several platforms have pioneered and popularized context-aware anomaly detection, including:
- Dynatrace’s Davis AI assistant
- New Relic’s NRQL anomaly detection
- Datadog Watchdog
- AWS CloudWatch Anomaly Detection
- Google Cloud Operations’ AI-driven alerts
By embracing context-aware anomaly detection as part of your application monitoring best practices, you can significantly improve the efficiency of your monitoring efforts, reduce alert fatigue, and proactively identify critical issues before they impact your users.
7. Implement Log Aggregation and Analysis
Log aggregation and analysis is a crucial application monitoring best practice that involves collecting, centralizing, structuring, and analyzing log data generated by all components of an application. This practice provides invaluable insights into system behavior, facilitates efficient troubleshooting, and enables the identification of emerging patterns. By implementing a comprehensive logging strategy, teams gain the ability to correlate events across complex, distributed systems and quickly sift through massive volumes of log data to pinpoint relevant information during investigations. This is critical for maintaining application stability, performance, and security.
How it Works:
Log aggregation and analysis pipelines typically involve several key stages:
- Collection: Log data is gathered from various sources, including servers, applications, databases, and network devices.
- Centralization: Collected logs are forwarded to a central repository, eliminating data silos and providing a unified view of the system.
- Structuring: Logs are often structured using formats like JSON or key-value pairs, enabling easier parsing and analysis.
- Analysis: Aggregated logs are analyzed using various techniques, including full-text searching, pattern recognition, and statistical analysis. Dashboards and visualizations can be created to monitor key metrics and identify trends.
Why This is a Best Practice:
In today’s complex software environments, understanding the intricate workings of an application and diagnosing issues quickly is paramount. Log aggregation and analysis provides the crucial context needed for effective troubleshooting and root cause analysis. Historical analysis of log data allows teams to identify long-term trends and patterns, leading to proactive problem-solving and performance optimization. Moreover, robust logging is essential for meeting compliance and audit requirements, providing auditable records of system activity.
Features and Benefits:
- Centralized Log Collection: Simplifies access to all log data from a single location.
- Structured Logging Formats: Facilitates automated parsing and analysis.
- Real-time Log Streaming: Enables immediate visibility into system behavior.
- Log Parsing and Indexing: Allows for efficient searching and filtering.
- Full-text Search Capabilities: Empowers quick identification of specific events.
- Log Retention Policies: Balances storage costs with compliance needs.
- Pattern Recognition: Helps identify recurring issues and anomalies.
Pros and Cons:
Pros:
- Provides crucial context for troubleshooting.
- Enables historical analysis of system behavior.
- Supports compliance and audit requirements.
- Helps identify issues across distributed systems.
- Facilitates post-incident analysis.
Cons:
- Can generate enormous volumes of data requiring significant storage.
- May impact application performance if logging is excessive.
- Requires standardization across different applications.
- Can be expensive at scale.
- Sensitive data handling requires careful planning.
Examples of Successful Implementation:
- Netflix: Processes over 1.3 trillion log events per day through their centralized logging platform for real-time monitoring and analysis.
- Twitter: Uses structured logging to analyze user experience and performance across their distributed platform.
- Stripe: Implements contextual logging to track payment processing flows, ensuring security and compliance.
Actionable Tips:
- Implement structured logging (JSON/key-value) for easier parsing.
- Include correlation IDs to track requests across services.
- Use log levels appropriately (ERROR, WARN, INFO, DEBUG).
- Implement sampling for high-volume debug logs.
- Define retention policies based on importance and compliance needs.
- Create dashboard visualizations for common log patterns.
- Establish standard logging formats across the organization.
Popular Tools:
- ELK Stack (Elasticsearch, Logstash, Kibana)
- Splunk
- Graylog
- Sumo Logic
- Loki (Grafana)
Implementing log aggregation and analysis as part of your application monitoring best practices empowers your teams with the data and insights needed to build resilient, high-performing, and secure applications. By proactively addressing potential issues and optimizing system behavior, you can significantly improve the overall user experience and business outcomes.
8. Establish SLOs and Error Budgets
One of the most crucial application monitoring best practices is establishing Service Level Objectives (SLOs) and Error Budgets. This framework provides a structured approach to defining, measuring, and managing application reliability targets, enabling teams to balance the speed of innovation with the stability of their systems. This approach is vital for any organization serious about delivering a high-quality user experience while maintaining a rapid development pace. It shifts the conversation from vague notions of “reliability” to concrete, measurable objectives, fostering a data-driven culture around application performance.
SLOs define clear, measurable goals for service performance and availability. They answer the question: “How reliable does this service need to be?” These objectives are typically expressed as a percentage of successful operations within a specific time window. For example, an SLO might target 99.9% uptime for a critical API over a rolling 30-day period.
Paired with SLOs are Error Budgets. An Error Budget quantifies the acceptable amount of unreliability allowed within the SLO’s timeframe. Using the previous example, a 99.9% uptime SLO over 30 days leaves an error budget of 0.1%, translating to approximately 43.2 minutes of permissible downtime. This budget provides a clear boundary for acceptable risk, allowing teams to make informed decisions about prioritizing new features versus addressing reliability issues.
Features of using SLOs and Error Budgets:
- Quantifiable reliability targets: Moves reliability from subjective assessment to objective measurement.
- User-centric success metrics: Focuses on the aspects of performance that directly impact users (availability, latency, etc.).
- Defined measurement windows: Provides clear timeframes for evaluating performance against objectives.
- Calculated error margins for risk management: Quantifies acceptable risk, enabling informed decision-making.
- Automated SLO tracking: Facilitates continuous monitoring and reporting of SLO performance.
- Performance-based deployment controls: Can be integrated into CI/CD pipelines to prevent deployments that would exceed the error budget.
Pros:
- Creates shared understanding of reliability expectations: Aligns engineering, business, and operations teams around common reliability goals.
- Balances innovation speed with stability requirements: Provides a framework for managing the inherent trade-offs between delivering new features and maintaining system stability.
- Provides objective criteria for engineering priorities: Data-driven insights into when to focus on reliability improvements versus new feature development.
- Reduces organizational tensions around reliability trade-offs: Offers a clear, data-backed rationale for prioritizing work.
- Enables data-driven reliability investments: Justifies investments in reliability improvements by demonstrating their impact on SLOs and error budgets.
Cons:
- Requires mature monitoring infrastructure: Accurate SLO tracking relies on comprehensive monitoring and alerting systems.
- Can be challenging to define appropriate SLIs initially: Requires careful consideration of user needs and system capabilities. SLIs (Service Level Indicators) are the metrics used to measure SLOs.
- Needs organizational buy-in across engineering and business teams: Successful implementation requires a cultural shift towards data-driven reliability management.
- May require cultural shifts in how reliability is viewed: Teams need to embrace the concept of acceptable failure within defined boundaries.
- Demands regular review and refinement: SLOs and error budgets should be reviewed and adjusted periodically to reflect changing business needs and system performance.
Examples of Successful Implementation:
- Google: Manages thousands of SLOs across its vast service infrastructure to balance reliability and innovation.
- GitHub: Employs error budgets to guide decisions about prioritizing feature development versus stability improvements.
- Spotify: Uses SLOs to maintain high audio streaming quality while continuously evolving its platform.
Actionable Tips for Implementing SLOs and Error Budgets:
- Start small: Begin with a few critical SLOs for core services before expanding to less critical systems.
- Focus on user experience: Define SLOs based on metrics that directly reflect the user experience, such as availability, latency, and error rate.
- Establish tiered budgets: Implement both long-term (e.g., quarterly) and short-term (e.g., weekly) error budgets to manage risk effectively.
- Automate everything: Automate SLO monitoring, error budget calculations, and alerting to reduce manual overhead.
- Define clear policies: Establish clear procedures for what happens when error budgets are depleted, including halting deployments or prioritizing reliability work.
- Regularly review and adjust: Review and refine SLOs and error budgets quarterly, or more frequently as needed, based on evolving business needs and system performance.
Popularized By:
- Google’s Site Reliability Engineering (SRE) framework
- The SRE Book by Betsy Beyer, Chris Jones, Jennifer Petoff, and Niall Murphy
- Datadog SLO monitoring
- New Relic SLI/SLO capabilities
- Prometheus and Grafana SLO tooling
By implementing SLOs and error budgets as part of your application monitoring best practices, you can create a culture of data-driven reliability, enabling faster innovation while maintaining a high-quality user experience.
Best Practices Comparison Matrix
| Best Practice | Implementation Complexity 🔄 | Resource Requirements ⚡ | Expected Outcomes 📊 | Ideal Use Cases 💡 | Key Advantages ⭐ |
|---|---|---|---|---|---|
| Implement End-to-End Transaction Monitoring | High - requires instrumentation across all components | High - storage for trace data, possible performance overhead | Full visibility into complex, distributed systems; accurate root cause analysis | Complex distributed systems, microservices | Improved MTTR; holistic system understanding |
| Establish a Robust Alerting Strategy | Medium to High - requires continuous tuning and cultural adoption | Medium - ongoing maintenance and tooling | Reduced alert fatigue; faster incident response aligned to business impact | Organizations needing scalable alerting with impact focus | Noise reduction; critical issue prioritization |
| Implement Comprehensive Error Tracking | Medium - requires code modifications and context capture | Medium - storage and processing of error data | Prioritized bug fixing; proactive issue resolution and debugging efficiency | Development teams focusing on quality and release stability | Faster debugging; user impact awareness |
| Adopt User Experience Monitoring | Medium - requires frontend instrumentation, privacy considerations | Medium to High - data volume and consent handling | Insights into real user performance; prioritization of impactful improvements | Web/mobile apps with heavy user interaction | User-centric performance insights |
| Implement Infrastructure as Code for Monitoring | Medium - initial learning curve and tooling setup | Low to Medium - automation reduces manual effort | Consistent, reproducible monitoring configurations; faster onboarding | Teams scaling monitoring across environments | Configuration consistency; auditability |
| Implement Context-Aware Anomaly Detection | High - needs historical data, ML model tuning, computational resources | High - processing power and data storage | Reduced false positives; detection of subtle and multi-metric anomalies | Dynamic, cloud-native apps with complex patterns | Superior anomaly detection; adaptive sensitivity |
| Implement Log Aggregation and Analysis | Medium to High - requires standardization and ingestion setup | High - storage and indexing of large log volumes | Centralized troubleshooting; compliance support; post-incident insights | Distributed systems, compliance-heavy environments | Context-rich troubleshooting; audit readiness |
| Establish SLOs and Error Budgets | Medium - needs mature monitoring and organizational alignment | Medium - automated tracking and reporting tools | Balanced innovation and reliability; data-driven prioritization | Organizations managing stability vs. feature velocity | Clear reliability targets; reduced organizational tension |
Taking Your Application Monitoring to the Next Level
Implementing application monitoring best practices, as outlined above, is crucial for maintaining the health, performance, and reliability of your applications. From end-to-end transaction monitoring and robust alerting strategies to comprehensive error tracking and user experience monitoring, each practice plays a vital role in ensuring optimal application performance. By embracing infrastructure as code for monitoring, context-aware anomaly detection, and log aggregation and analysis, you gain deeper insights into your application’s behavior and can proactively address potential issues. Establishing SLOs and error budgets provides a framework for measuring success and managing risk. Mastering these application monitoring best practices empowers your teams to identify and resolve problems quickly, minimize downtime, improve user satisfaction, and ultimately deliver a superior product. This proactive approach translates to increased customer loyalty, a stronger brand reputation, and a competitive edge in the market.
These best practices aren’t a one-time implementation; they require continuous refinement and adaptation as your application evolves. By fostering a culture of proactive monitoring and consistently evaluating your strategies, you’ll ensure your applications remain resilient and performant in the face of increasing complexity and user demands.
Ready to take your application monitoring to the next level and gain unparalleled insights into your system’s performance under real-world conditions? Explore GoReplay (https://goreplay.org), a powerful tool that allows you to capture and replay real traffic, enhancing your testing and monitoring capabilities for more robust and reliable applications.