
Analytics Dashboard UI Principles That Make Metrics Clear

You’ve just shipped a release. An engineer opens the dashboard, scans a screen full of charts, and still can’t tell whether the new build is slower. The graphs render correctly, the filters work, and the page looks finished. Nobody can confidently say whether to keep rolling out or investigate.
That’s the problem an analytics dashboard UI should solve: shortening the distance between seeing a metric and making a defensible decision.
Why Most Dashboards Fail Their Readers
A dashboard can be published, polished, and largely useless. Availability, interpretation, and action are separate design problems, and a screenshot proves none of them.
A 2025 scoping review of U.S. public-health dashboards found that 42 of 89 dashboards remained accessible or active, while only 26 studies reported a formal usability assessment. These findings aren’t a benchmark for software engineering dashboards. They demonstrate the difference between delivering a dashboard and establishing that people can continue using it effectively.
Analytics dashboard UI means the layout, visual encoding, metric labels, filters, and interaction behavior that let people read operational data correctly. It includes the apparently small decisions: whether an error rate names its denominator, whether a comparison uses equivalent traffic, and whether an empty chart means no errors or no data.
Start with a decision, not a metric inventory
An engineer evaluating a release needs a different view from an analyst investigating customer behavior. Putting every available metric on the same page doesn’t accommodate both readers. It makes both readers sort through irrelevant information.
Define the decision before choosing the components:
- Reader: Name the person responsible for acting, such as the release engineer.
- Decision: State the choice, such as continuing deployment or investigating a regression.
- Evidence: Identify the measures and comparisons needed to justify that choice.
- Next action: Provide the relevant breakdown, request details, or investigation path.
Choosing useful software development KPIs helps establish that evidence, but a meaningful metric still needs a meaningful presentation.
Practical rule: Finish the sentence “This chart helps the reader decide whether to…” before adding the chart.
The visual must fit the question, the page must expose the answer, and the interactions must remain usable under realistic conditions. Those requirements matter more than chart variety.
Run a simple audit today: name the decision each existing chart supports. Remove charts that support none, or move them into an exploratory workspace where browsing is the explicit purpose.
Match Each Question to the Right Visual
| Reader question | Best visual | Visual to avoid |
|---|---|---|
| How has a value changed over time? | Line chart | Pie chart |
| How do categories compare? | Bar chart sorted by value | Unsorted 3D bars |
| What is the status of one KPI? | Big-number card with a delta against target | Gauge with no target line |
| How is a total split into shares? | Stacked or 100% bar with up to four parts | Pie chart with more than five slices |
| Where do values cluster or outliers sit? | Histogram or box plot | Average value alone |
| Which exact values must be checked? | Sortable table | Unlabeled chart |
| How do two variables relate? | Scatter plot | Dual-axis line chart |
Treat the share-chart limits in this table as design constraints, not scientific cutoffs. Keep the visible categories small enough to label clearly, and move the full breakdown into a table when necessary.
The question comes first. A line chart is useful for seeing whether latency changed around a deployment; a sorted bar chart is better for identifying which endpoint deteriorated most. Neither replaces a table when someone needs to verify a particular response.
Choose the evidence before the component
Use a card when the immediate decision is pass or fail against an agreed threshold. Use a chart when direction, timing, distribution, or relationships determine the next action.
For example, an adoption card can show whether an app update has reached the required audience, while a time series reveals whether adoption has stalled. Capgo’s adoption metrics examples for app updates are useful when defining the underlying question before choosing its visual treatment.
Operational metrics need the same care. Distinguish traffic replay measurements from real user monitoring metrics so readers don’t interpret test behavior as evidence of the current customer experience.
Avoid visuals that manufacture a story
A crowded pie chart asks readers to compare similar angles and repeatedly consult a legend. A bar chart gives them a common baseline and room for direct labels.
Dual-axis line charts create a different problem: changing either axis range can make unrelated movements appear closely aligned. Use separate aligned panels when the series have different units, or a scatter plot when the actual question concerns their relationship.
Before approving a chart, check its assignment:
- Time series: Can the reader locate the event or interval that matters?
- Comparison: Can the reader identify the largest relevant difference without calculating it?
- Distribution: Can the reader see unusual values rather than just an average?
- Verification: Can the reader retrieve the exact underlying record?
Write the reader’s question above the chart while designing it. If the visual doesn’t answer that question, change the visual before polishing its styling.
Layout That Puts the Answer First
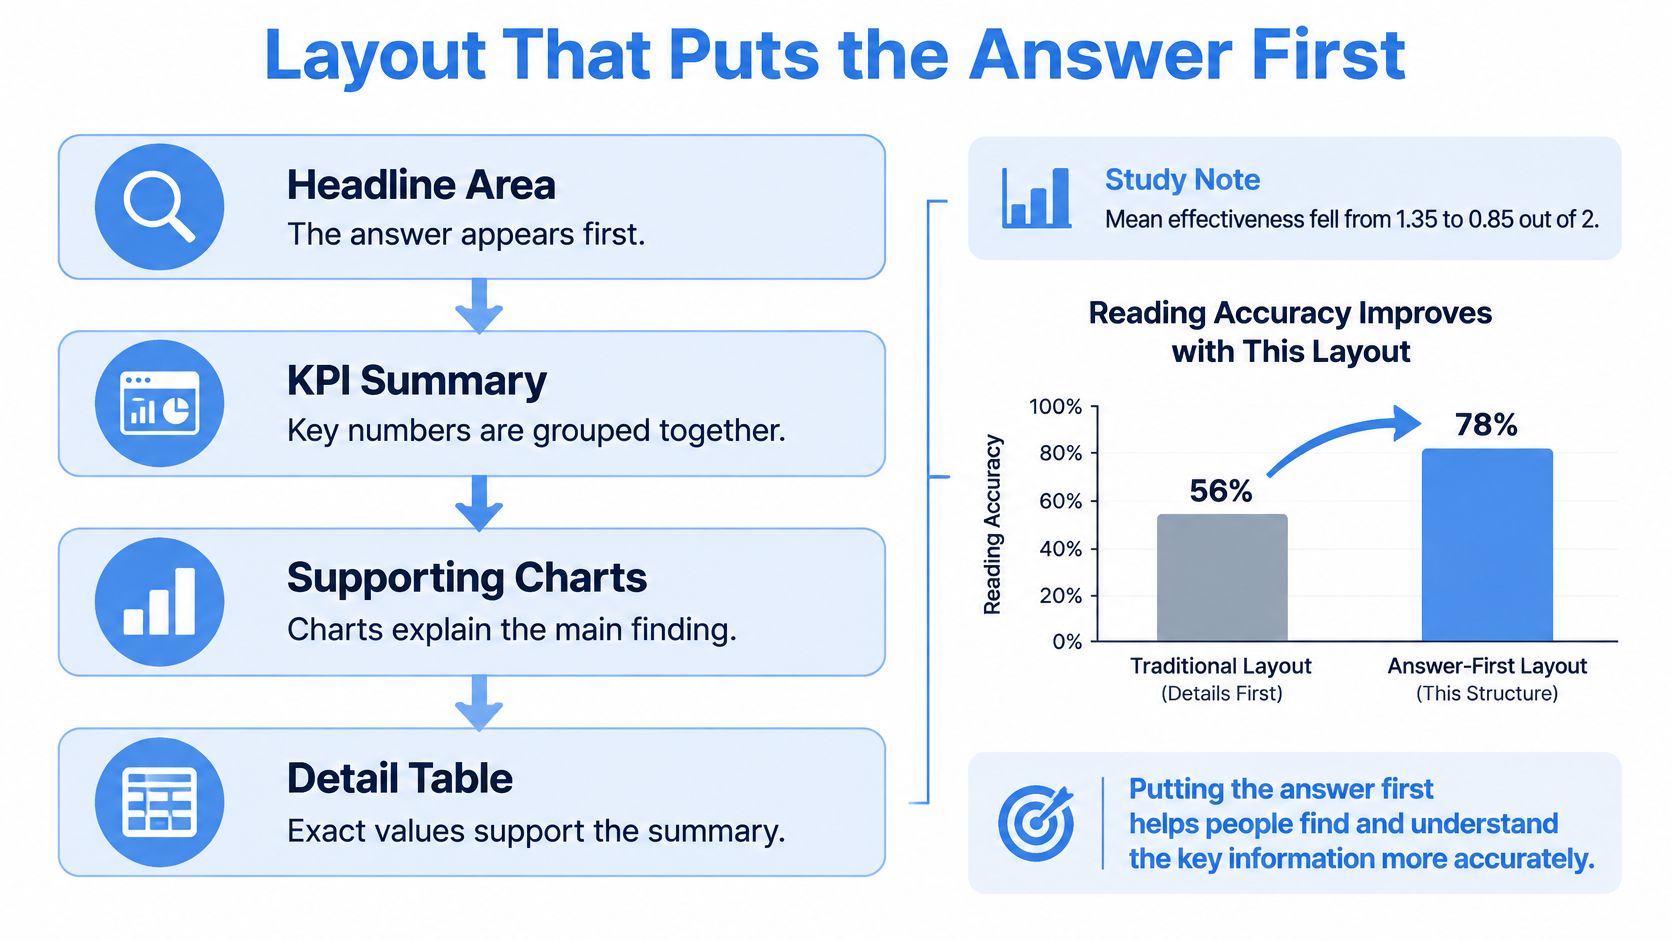
Dashboard structure affects how accurately people complete tasks. In a controlled study reported in the ACM Digital Library, mean effectiveness was 1.35 out of 2 in one dashboard condition versus 0.85 out of 2 in a condition involving misaligned visual literacy, while challenging tasks averaged 5 minutes 19 seconds, compared with 3 minutes 18 seconds for easier tasks.
Those results don’t prove that a particular grid works everywhere. They support treating grouping, ordering, and visual comprehensibility as functional requirements rather than decoration.
The following structure makes the intended reading path explicit.
Organize around status, explanation, and evidence
For a checkout service, place the release-critical summary at the top: tail latency, error rate, and failed payments. Each summary needs a relevant comparison, not merely a large value.
Use the middle band to explain movement. Group latency charts together, then errors and volume, rather than scattering related measures across whichever spaces remain.
Reserve the lower area for endpoint breakdowns and request tables. These components require deliberate investigation, so they shouldn’t compete with the initial status assessment.
- Headline area: State the operational question and surface the most important result.
- Supporting charts: Show when the change occurred and which dimensions could explain it.
- Detail area: Let engineers inspect the records needed to confirm or reject an explanation.
For an English-language interface, the upper-left position is a sensible starting point for the primary result. Validate the reading order with the actual audience rather than assuming everyone follows the intended path.
Make filter scope visible
Put global controls, such as environment and time range, in a persistent top bar. Place local controls beside the component they affect, and label their scope explicitly.
A status-code filter inside a request table shouldn’t change the headline error rate without notice. If cross-filtering is intentional, show the active selection near every affected component and offer an obvious reset.
For monitoring interfaces that serve both people and automated consumers, Agentable’s dashboard features for agent-ready websites provide a related perspective on organizing monitoring information around its consumer.
Squint at the page. The primary result should remain visually distinct even when the supporting labels become difficult to read.
If every panel attracts equal attention, the hierarchy needs revision.
Visual Hierarchy, Color and Number Formatting
A dashboard works like a newspaper front page: headline size tells you what deserves attention before you read the details. Giving every card a bright border and oversized number is like printing every story as breaking news.
Make the primary KPI values prominent, keep explanatory labels quieter, and reserve the strongest accent for the condition that requires action. Muted text still needs to be readable. Secondary doesn’t mean barely visible.
A shared review should focus on the decision, not on which component looks most impressive.

Give color a stable meaning
Use a neutral foundation with a restrained set of accents. If red means a failed threshold in one panel, don’t use it as an arbitrary series color elsewhere.
Color alone can’t carry the result. Pair status with text, an icon, a line pattern, or another visible distinction so readers can identify it without recognizing the hue.
- Status: Pair a warning color with a label such as “Above release budget.”
- Series identity: Keep baseline and candidate styling consistent across related charts.
- Selection: Distinguish the selected endpoint without making it look like an error.
- Validation: Check the page in greyscale and with color-vision simulation tools.
Keep red and green for status when that convention suits the audience. Don’t color an increase green automatically: more requests might be good, but more failed requests aren’t.
Format numbers for the decision
Round displayed values to the precision the reader can use. As a formatting example, 12.4 ms is easier to compare than 12.37429 ms when the extra decimals cannot affect the decision.
Keep units consistent within a comparison, use thousands separators, and label every delta with its comparison period. Distinguish percentage changes from percentage-point changes, and define whether higher or lower is preferable.
Bar charts should start at zero because readers compare bar lengths. Line charts can use a narrower range to expose movement, provided the axis is clear and the range doesn’t exaggerate a harmless fluctuation.
Label lines at their ends when space permits instead of making readers repeatedly match them to a distant legend. Retain a useful fallback for crowded or narrow layouts.
The check is straightforward: can the reader explain why the most prominent element deserves attention? If not, reduce its emphasis or change what occupies that position.
Interaction Speed Thresholds to Design For
| Interaction budget | Intended experience | UI response |
|---|---|---|
| Approximately 100 milliseconds | Feels immediate | Acknowledge the input |
| About 1 second | Preserves uninterrupted thought | Return a useful result |
| Roughly 10 seconds | Risks losing attention | Provide progress or asynchronous completion |
These interaction thresholds, along with a good INP target of 200 milliseconds or less at the 75th percentile, are described in MotherDuck’s customer analytics dashboard guidance. Treat them as engineering targets for different parts of the experience, not as interchangeable measures.
A selected filter can respond immediately even when its query is still running. Change the control state, identify the affected panels, and show that their results are updating.
Separate acknowledgement from completion
Don’t leave old values looking current while a replacement query runs. Keep them visible if that preserves context, but mark them as stale or updating.
For longer work, show meaningful progress when it’s measurable. Otherwise, describe the operation and allow the reader to continue elsewhere, cancel it, or receive a completion notification.
Build the fast path deliberately:
- Pre-aggregate: Prepare common groupings such as endpoint and status code before users request them.
- Cache: Reuse frequently requested time windows, with freshness information attached.
- Constrain: Limit expensive cross-filter combinations and explain unsupported selections.
- Render progressively: Draw a lightweight skeleton before charts arrive, without implying that empty placeholders are results.
Measure the whole investigation
Initial load time doesn’t describe the full experience. A page can appear promptly but become frustrating whenever someone changes the environment or drills into an endpoint.
Instrument input acknowledgement, query execution, result delivery, and chart rendering separately. Measure filter changes and table sorting under realistic traffic volumes, not just against a nearly empty development dataset.
Also protect the reader from request races. If they change a filter again before the previous query completes, cancel the obsolete request or discard its response rather than rendering results for the wrong selection.
Before development starts, write a latency budget for each interaction type. Include the loading, failure, cancellation, and retry states in the acceptance criteria.
Worked Example of a Replay Traffic Dashboard
Say your team is comparing a staging build against replayed production traffic. The dashboard has a narrow assignment: did the candidate change latency or error behavior enough to block the release?
The engineer needs both a release-level answer and a path to inspect the evidence behind it.
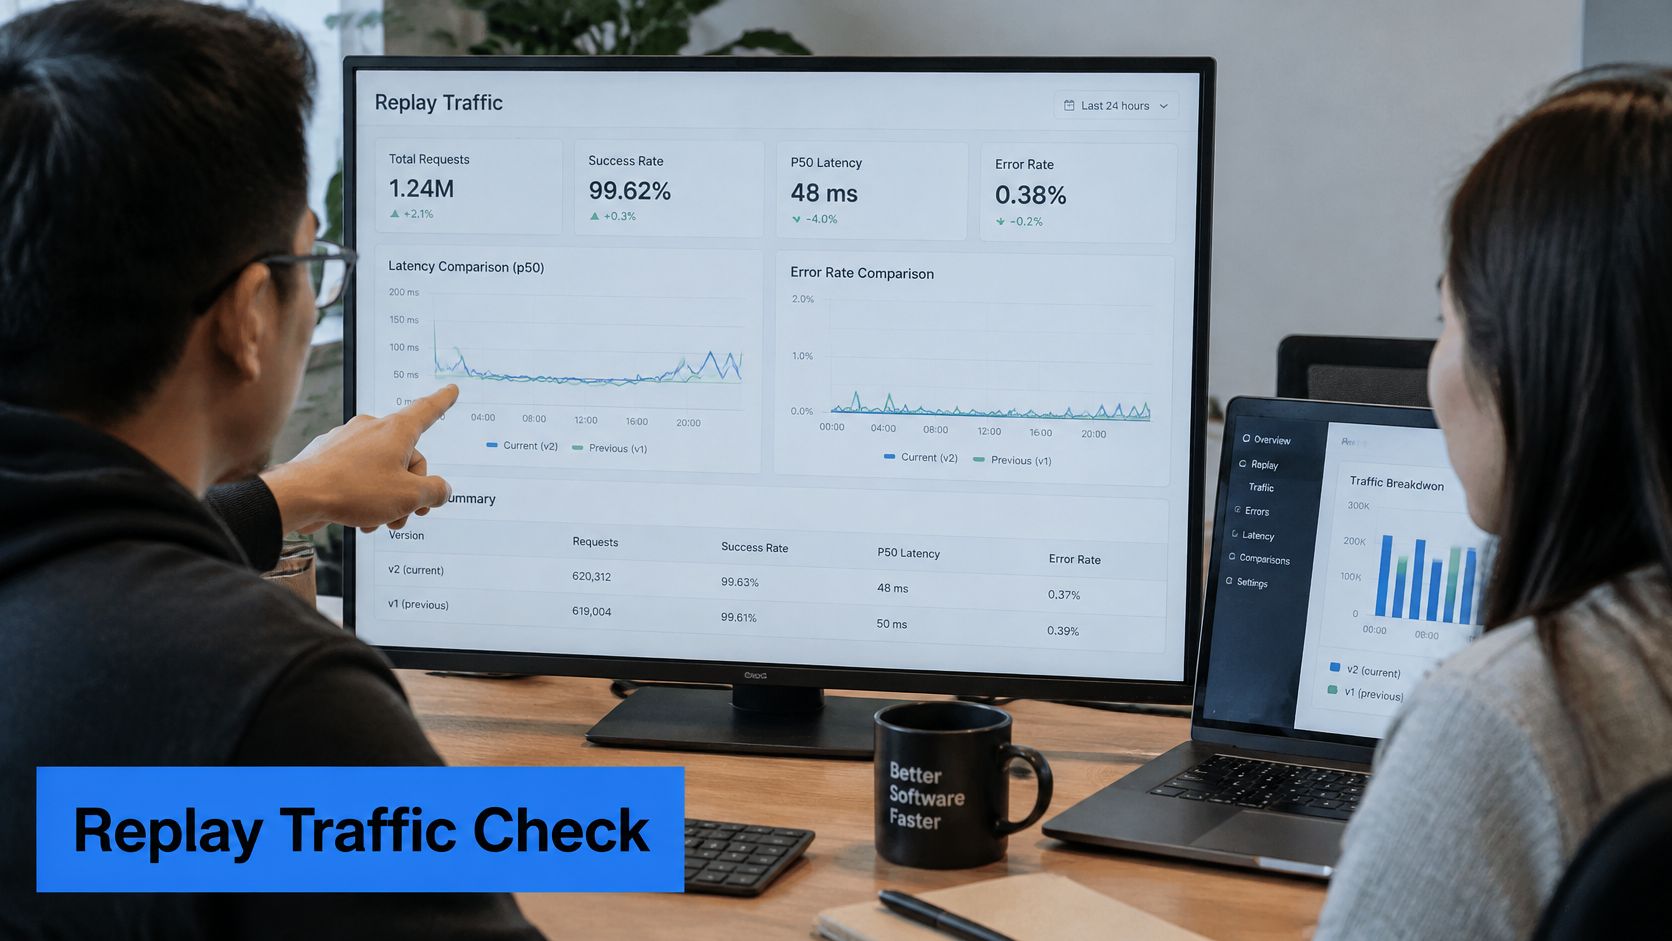
Read from verdict to request
In this proposed design, the top row contains cards for p95 latency, error rate, status-code mismatches, and requests replayed. Each card identifies the relevant comparison period; the latency card also shows its change against the baseline.
The request count isn’t a decorative volume metric. It helps the engineer determine whether the comparison includes the intended replay workload rather than an incomplete run.
The middle band contains the baseline and candidate latency series, directly labeled, with the deployment event marked. Where replay timing differs, use an aligned replay timeline rather than implying that unrelated wall-clock intervals are equivalent.
The lower area supports investigation:
- Endpoint ranking: A horizontal bar chart sorts endpoints by latency increase, making the largest regressions easy to locate.
- Mismatch table: A sortable table lists requests with different status codes and exposes endpoint and time filters.
- Comparison context: Build identifiers, replay configuration, and sampling information remain available beside the results.
The engineer starts with the status summary, checks whether the change persists through the run, selects an affected endpoint, and inspects the underlying requests.
For additional replay context, watch the accompanying video.
Define the release rule before reading the result
For this scenario, pass the release only if the p95 change stays within the agreed budget and there are no unexplained status-code mismatches. A failed condition opens an investigation; it doesn’t automatically establish that the application code is responsible.
Check whether masking, dependencies, replay configuration, or environment differences could explain the discrepancy. Keep those details inspectable rather than hiding them behind a reassuring status badge.
Signal-oriented dashboards in other domains illustrate a useful distinction between identifying activity and deciding what it means. StalkChain’s guide to on-chain signal tools for traders offers an adjacent example of that signal-investigation workflow, though the evidence and decisions differ from release testing.
A release verdict should expose its supporting evidence, not conceal it.
There’s no traffic-share pie chart or decorative gauge in this design. The page earns its space through an answer-first summary, a distinct question for each chart, and a visible release threshold.
Showing AI Insights Without Hiding the Data
In 2025, 43% of organizations surveyed across 38 countries reported using AI-powered analytics in production, according to Strategy’s global survey of 235 professionals. Adoption makes verification a practical interface requirement, not an optional enhancement.
The difficult question isn’t whether a dashboard can generate an explanation. It’s whether an engineer can check that explanation before acting on it.
Separate observed facts from model output. Label measured values as measured and forecasts or inferred explanations as estimated, using text and a distinct visual treatment rather than color alone.
Give every insight an evidence trail
An anomaly panel should expose the time window, active filters, data source, and relevant transformations. If the analysis used sampled traffic or excluded endpoints, put that information beside the claim.
Enterprise dashboard guidance from CreateBytes emphasizes explainability, data lineage, confidence indicators, feedback loops, and validation. Implement those ideas as inspectable controls, not as a generic trust badge.
- Evidence access: Open the exact series and selection that produced the anomaly.
- Uncertainty: Explain limitations in plain language, such as insufficient history or incomplete coverage.
- Feedback: Let users mark an insight useful, incorrect, or explained by an expected event.
- Change handling: Invalidate or recompute insights when their source data or configuration changes.
Keep recommendations reversible
An insight that says an endpoint caused a regression should let the reader inspect that endpoint’s measured behavior. Don’t present correlation as a confirmed cause, and don’t assign precise-looking confidence scores unless their interpretation is defensible.
Keep recommendations separate from execution. A suggestion to adjust a release or configuration needs an explicit review step, with enough context to understand the consequences.
A less automated dashboard can be the safer design when the evidence is incomplete. The AI assistant should point to the chart that verifies its claim, never replace that chart with a polished paragraph.
Accessibility and the Pre-Release Check
Contrast, alt text, and keyboard access are necessary, but they don’t fully address live analytical work. A reader also needs to understand complex charts, detect changes, maintain context, and inspect the evidence behind an alert.
A 2026 systematic review of machine learning for visualization accessibility found chart summaries and descriptive alt text in seven papers, question-and-answer interfaces in six, and keyboard navigation in three. Its scope was research on those approaches, not the accessibility of all dashboards, but the practical challenge is clear: equivalent access needs more than a static chart description.
Provide an equivalent investigation path
Give each chart a synchronized data table that respects the same filters. Make sorting and filter controls keyboard-operable, preserve visible focus, and ensure the reader can identify the current selection without relying on position or color.
For anomalies, provide a concise summary that names the affected metric, direction of change, and relevant context. Let readers control live updates so the interface doesn’t repeatedly interrupt a screen reader or move the row they’re examining.
Test with people who use assistive technology. Automated checks can identify some implementation defects, but they won’t tell you whether someone can complete a release investigation.
Use a task-based release checklist
Build the pre-release check around actual decisions:
- Live updates: Run a screen reader while new data arrives. Confirm that important changes are available without announcing every refresh.
- Metric interpretation: Check units, displayed precision, comparison periods, and the distinction between missing data and a genuine zero.
- Task completion: Ask representative users to assess release status, locate a suspect endpoint, and inspect a mismatched request. Record completion time, errors, and requests for help.
- Realistic inputs: Replay recorded production traffic in staging to exercise long labels, unexpected status codes, sparse series, and dense tables.
- Recovery: Interrupt a query and test expired sessions, failed requests, empty results, and retry behavior.
Our debugging and reproduction feature lets users inspect a captured request, replay a filtered sample, and compare the target response with the expected behavior. That supports checking whether an apparent dashboard anomaly corresponds to reproducible application behavior.
Ship when readers can reach the decision, inspect its evidence, and recover from failure through equivalent access paths. If they can’t determine the release status from the opening view, revise the top row before adding more panels.
GoReplay captures and replays live HTTP traffic into testing environments so you can evaluate changes against realistic request patterns. Visit GoReplay to build a replay-based testing workflow and give your dashboard decisions reproducible evidence.